Pike Robert, Neal Bill. Corporate finance and investment: decisions and strategy
Подождите немного. Документ загружается.


.
Chapter 4 Valuation of assets, shares and companies 105
■
Allowing for future dividend growth
Dividends fluctuate over time, largely because of variations in the company’s fortunes,
although most firms attempt to grow dividends more or less in line with the company’s
longer-term earnings growth rate. For reasons explained in Chapter 17, financial man-
agers attempt to ‘smooth’ the stream of dividends. For companies operating in mature
industries, the growth rate will roughly correspond to the underlying growth rate of the
whole economy. For companies operating in activities with attractive growth opportu-
nities, dividends are likely to grow at a faster rate, at least over the medium term.
■ Allowing for dividend growth: the DGM
The constant dividend valuation model can be extended to cover constant growth thus
becoming the Dividend Growth Model (DGM). This states that the value of a share is
the sum of all discounted dividends, growing at the annual rate g:
If D
o
is this year’s recently paid dividend,* D
o
(1g) is the dividend to be paid in one
year’s time (D
1
), and so on.
Such a series growing to infinity has a present value of:
The growth version of the model is often used in practice by security analysts (it is
popularly known as ‘the dividend discount model’), at least as a reference point, but
it makes some key assumptions. Dividend growth is assumed to result from earnings
growth, generated solely by new investment financed by retained earnings. Such
investment is, of course, worthwhile only if the anticipated rate of return, R, is in
excess of the cost of equity, k
e
. Furthermore, it is assumed that the company will retain
a constant fraction of earnings and invest these in a continuous stream of projects all
offering a return of R. It also breaks down if g exceeds k
e
. (Problems with the DGM are
discussed in Section 4.10.)
■ Navenby again
To illustrate the growth model, we return to the Navenby example but assume an infi-
nite project life. This requires removal of the asset sale at the end of year 5. Suppose fur-
ther that, at the end of the first year, it will retain 50 per cent of its earnings and reinvest
these at an expected annual return of 20 per cent, comfortably above the required 12 per
cent. In the next year, earnings would grow at 10 per cent to reach a new level of:
‘original’ cash flow return on reinvested earnings =
new earnings level of £0.1 m 20% (50% £0.1 m) (£0.1 m £0.01 m) £0.11 m
If further retentions of 50 per cent are made at the end of the second year and also
reinvested in further projects offering annual returns of 20 per cent, earnings after
three years will be:
£0.11 m 20% of (50% £0.11 m) (£0.11 m £0.011 m) £0.121 m
and so on. The policy of retention and reinvestment has launched Navenby on an
P
o
D
o
11 g2
1k
e
g2
D
1
1k
e
g2
P
o
D
o
11 g2
11 k
e
2
D
o
11 g2
2
11 k
e
2
2
D
o
11 g2
3
11 k
e
2
3
p
D
o
11 g2
n
11 k
e
2
n
*If the dividend has recently been paid, i.e. the next dividend will be paid in, say, a year’s time, the shares
are said to be ‘ex-dividend’. They trade without entitlement to a dividend for some considerable time.
CFAI_C04.QXD 10/28/05 2:29 PM Page 105

.
106 Part I A framework for financial decisions
exponential growth path. The dividend growth rate of 10 per cent is a compound of
the retention ratio, denoted by b, and the return on reinvested earnings, R:
g = (b R) = (50% 20%) = 10%
Table 4.3 shows the future behaviour of both earnings and dividends assuming b
and R are constant. Clearly, both magnitudes grow in tandem, so long as the compa-
ny maintains the same retention ratio (50 per cent).
In Chapter 17, we examine more fully the issues of whether and how a change in
dividend policy can be expected to alter share value. For the moment, we are mainly
concerned with the mechanics of the DGM and rely simply on the assumption that any
retained earnings are used for worthwhile investment. If this applies, the value of the
equity will be higher with retentions-plus-reinvestment than if the investment oppor-
tunities were neglected, i.e. the decision to retain earnings benefits shareholders
because of company access to projects that offer returns higher than the owners could
otherwise obtain.
Table 4.3
How earnings and divi-
dends grow in tandem
(figures in £m)
Year
1 2 3 4 etc.
Earnings 0.10 0.11 0.121 0.1331 etc.
Dividends (50%) 0.05 0.055 0.0605 0.06655 etc.
Self-assessment activity 4.6
XYZ plc currently earns 16p per share. It retains 75 per cent of its profits to reinvest at an
average return of 18 per cent. Its shareholders require a return of 15 per cent. What is the
ex-dividend value of XYZ’s shares? What happens to this value if investors suddenly
become more risk-averse by seeking a return of 20 per cent?
(Answer in Appendix A at the back of the book)
4.10 PROBLEMS WITH THE DIVIDEND GROWTH MODEL
The Dividend Growth Model, while possessing some convenient properties, has some
major limitations.
■ What if the company pays no dividend?
The company may be faced with highly attractive investment opportunities that cannot
be financed in other ways. According to the model, such a company would have no
value at all! Total retention is fairly common, either because the company has suffered
an actual or expected earnings collapse, or because, as in some European economies
(e.g. Switzerland), the expressed policy of some firms is to pay no dividends at all. The
American computer software firm Microsoft paid its first dividend only in 2003, while
two other computer firms, Dell and Apple, have yet to pay dividends at all. Yet we
observe that shares in such companies do not have zero values. Indeed, nothing could
be further from the truth.
In the case of Dell, $100 invested in its initial public offering in June 1988, would
have been worth about $38,000 by January 2005 following 100 per cent profits reten-
tion. After seven stock splits, 100 shares of Dell was equivalent to 9,600 shares. Apple’s
history is more chequered. It managed to survive the major strategic blunder of omitting
to license out the Macintosh operating system to other manufacturers. Having gone
CFAI_C04.QXD 10/28/05 2:29 PM Page 106

.
Chapter 4 Valuation of assets, shares and companies 107
public in 1980 at an issue price of $22, its share price plummeted to $7 in 1998, soaring
to nearly $70 in the dotcom bubble before receding to $15 in 2003. However, this firm
is enjoying a ‘second bite at the cherry’ with the spectacular success of the iPod digi-
tal music player. Its product, iTunes, registered its 200 millionth download in
December 2004, just ten months after launch, making Apple the world leader in legal-
ly downloaded music. During 2004, its shares rose from $20 to $65, including a 20 per-
cent jump in November on the announcement of its first quarter 2004 results.
A distressed company like Apple, in its ‘dog days’, would have a positive value so
long as its management were thought capable of staging a corporate recovery, i.e. the
market is valuing more distant dividends on hopes of a turn-around in earnings. If
recovery is thought unlikely, the company is valued at its break-up value.
For inveterate non-dividend payers, the market is implicitly valuing the liquidating
dividend when the company is ultimately wound up. Until this happens, the compa-
ny is adding to its reserves as it reinvests, and continually enhancing its assets, its
earning power and its value. In effect, the market is valuing the stream of future earn-
ings that are legally the property of the shareholders.
■ Will there always be enough worthwhile projects in the future?
The DGM implies an ongoing supply of attractive projects to match the earnings avail-
able for retention. It is most unlikely that there will always be sufficient attractive proj-
ects available, each offering a constant rate of return, R, sufficient to absorb a given
fraction, b, of earnings in each future year. While a handful of firms do have very
lengthy lifespans, corporate history typically parallels the marketing concept of the
product life cycle – introduction, (rapid) growth, maturity, decline and death – with
paucity of investment opportunities a very common reason for corporate demise. It is
thus rather hopeful to value a firm over a perpetual lifespan. However, remember that
the discounting process compresses most of the value into a relatively short lifespan.
■ What if the growth rate exceeds the discount rate?
The arithmetic of the model shows that if g k
e
, the denominator becomes negative
and value is infinite. Again, this appears nonsensical, but, in reality, many companies
do experience periods of very rapid growth. Usually, however, company growth settles
down to a less dramatic pace after the most attractive projects are exploited, once the
firm’s markets mature and competition emerges. There are two ways of redeeming the
model in these cases. First, we may regard g as a long-term average or ‘normal’ growth
rate. This is not totally satisfactory, as rapid growth often occurs early in the life cycle
and the value computed would thus understate the worth of near-in-time dividends.
Alternatively, we could segment the company’s lifespan into periods of varying growth
and value these separately. For example, if we expect fast growth in the first five years
and slower growth thereafter, the expression for value is:
Note that the second term is a perpetuity beginning in year 6, but we have to find its
present value. Hence it is discounted down to year zero as in the following expression:
where g
f
is the rate of fast growth during years 1–5 and g
s
is the rate of slow growth
beginning in year 6 (i.e. from the end of year 5).
a
5
t 1
D
o
11 g
f
2
11 k
e
2
t
a
q
t 6
D
5
11 g
s
2
11 k
e
2
t
P
o
D
o
11 g
f
2
11 k
e
2
D
o
11 g
f
2
2
11 k
e
2
2
p
D
o
11 g
f
2
5
11 k
e
2
5
¢
D
5
11 g
s
2
1k
e
g
s
2
1
11 k
e
2
5
≤
3Present value of all further dividends4
P
o
3Present value of dividends during year 1–54
CFAI_C04.QXD 10/28/05 2:29 PM Page 107

.
108 Part I A framework for financial decisions
However, we may note here that valuation of the dividend stream implies a known
dividend policy. Because dividends are not controlled by shareholders, but by the
firm’s directors, the DGM is more applicable to the valuation of small investment
stakes in companies than to the valuation of whole companies, as in takeover situa-
tions. When company control changes hands, control of dividend policy is also trans-
ferred. It seems particularly unrealistic, therefore, to assume an unchanged dividend
policy when valuing a company for takeover.
■ The P:E ratio and the Constant Dividend Valuation Model
If we examine the P:E ratio more closely, we find it has a close affinity with the growth
version of the DVM. The P:E ratio is defined as price per share (PPS) divided by earnings
per share (EPS). In its reciprocal form, it measures the earnings yield of the firm’s shares:
This equals the dividend yield plus retained earnings (bE) per share. As in the
DGM, the growth version of the DVM, we define the fraction of earnings retained as
b. We can then write:
E
V
D
V
bE
V
1
P:E
EPS
PPS
Earnings
Company value
E
V
The DGM may be used to examine the impact of changes in dividend policy, i.e.
changes in b. Detailed analysis of this issue is deferred to Chapter 17.
Example: the case of unequal growth rates
Consider the case of dividend growth of 25 per cent for years 1–5 and 7 per cent thereafter.
Assuming shareholders require a return of 10 per cent, and that dividend in year zero is 10p,
the value of the share is calculated as follows:
For years 1–5
Year Dividend (p) Discount factor at 10% PV (p)
1 10(1.25) 12.5 0.909 11.4
2 12.50(1.25)
2
15.6 0.826 12.9
3 etc. 19.5 0.751 14.6
4 24.4 0.683 16.7
5 30.5 0.621 18.9
Total 74.5
For later years, we anticipate a perpetual stream growing from the year 5 value at 7 per cent
p.a. The present value of this stream as at the end of year 5 is:
This figure, representing the PV of all dividends following year 5, is now converted into a
year zero present value:
PV £10.88 (PVIF
10.5
) (£10.88 0.621) £6.76
Adding in the PV of the dividends for the first five years, the PV of the share right now is:
PV (£0.745 £6.76) £7.51
D
6
k
e
g
s
D
5
11 7%2
110% 7% 2
30.5p11.072
0.03
32.64p
0.03
£10.88
earnings yield
The earnings per share (EPS)
divided by market share price
CFAI_C04.QXD 10/28/05 2:29 PM Page 108
.
Chapter 4 Valuation of assets, shares and companies 109
SHAREHOLDER VALUE
Cash flow from
operations
Cost of
capital
Business
strategy
Investment
strategy
Financing
strategy
Sales growth
Margin
Planning horizon
Capital investment
Working capital
Acquisitions
Credit rating
Tax rate
Capital structure
Dividend policy
Corporate
objective
Value
drivers
Strategic
focus
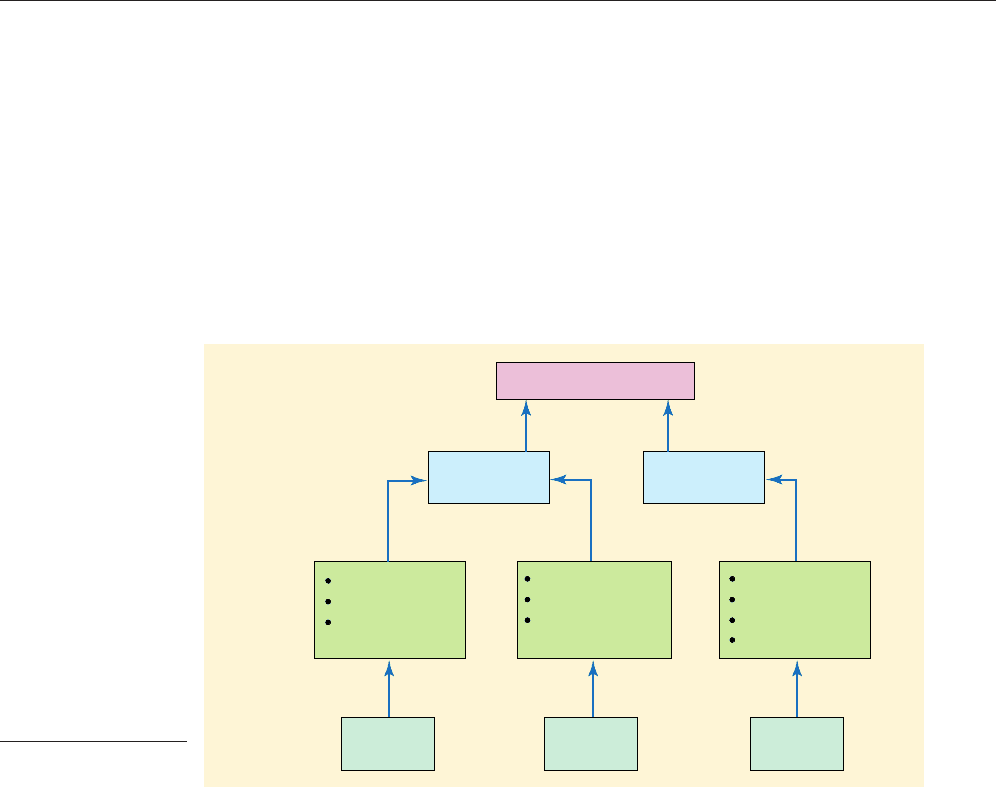
Figure 4.2
Shareholder value
analysis framework
The ratio E/V is the overall rate of return currently achieved. If this equals R, the rate
of return on reinvested funds, then bE/V is equivalent to the growth rate g in the DGM.
In other words, the earnings yield, E/V, comprises the dividend yield plus the growth
rate or ‘capital gains yield’ for a company retaining a constant fraction of earnings and
investing at the rate R. The two approaches thus look very similar. However, this
apparent similarity should not be over-emphasised for three important reasons:
1 The earnings yield is expressed in terms of the current earnings, whereas the DGM
deals with the prospective dividend yield and growth rate, i.e. the former is historic
in its focus, while the latter is forward-looking.
2 The DGM relies on discounting cash returns, while the earnings figure is based on
accounting concepts. It does not follow that cash flows will coincide with account-
ing profit, not least due to depreciation adjustments.
3 For the equivalence to hold, the current rate of return, E/V, would have to equal the
rate of return expected on future investments.
Despite these qualifications, it is still common to find the earnings yield presented
as the rate of return required by shareholders, and hence the cut-off rate for new
investment projects. Unfortunately, this confuses a historical accounting measure with
a forward-looking concept.
4.11 SHAREHOLDER VALUE ANALYSIS
During the 1980s, based on the work of Rappaport (1986), an allegedly new approach
to valuation emerged, called shareholder value analysis (SVA). In fact, it is not really
novel, but a rather different way of looking at value, based on the NPV approach.
The key assumption of SVA is that a business is worth the net present value of its
future cash flows, discounted at the appropriate cost of capital. Many leading US cor-
porations (e.g. Westinghouse, Pepsi and Disney) and a growing number of European
companies (e.g. Philips, Siemens) have embraced SVA because it provides a frame-
work for linking management decisions and strategies to value creation. The focus is
on how a business can plan and manage its activities to increase value for sharehold-
ers and, at the same time, benefit other stakeholders.
How is this achieved? Figure 4.2 shows the relationship between decision-making
CFAI_C04.QXD 10/28/05 2:29 PM Page 109

.
110 Part I A framework for financial decisions
and shareholder value. Key decisions – whether strategic, operational, investment or
financial – with important cash flow and risk implications are specified. Managers
should focus on decisions influencing the value drivers, the factors that have greatest
impact on shareholder value. Typically, these include the following:
1 Sales growth and margin. Sales growth and margins are influenced by competitive
forces (e.g. threat of new entrants, power of buyers and suppliers, threat of substi-
tutes and competition in the industry). The balance between sales, growth and prof-
its should be based not only on profit impact, but also on value impact.
2 Working capital and fixed capital investment. Over-emphasis on profit, particularly at
the operating level, may result in neglect of working capital and fixed asset man-
agement. In Section 4.7, the free cash flow approach advocated using cash flows
after meeting fixed and working capital requirements.
3 The cost of capital. A firm should seek to make financial decisions that minimise the
cost of capital, given the nature of the business and its strategies. As will be seen
later, this does not simply mean taking the source of finance that is nominally the
cheapest.
4 Taxation is a fact of business life, especially as it affects cash flows and the discount
rate. Managers need to be aware of the main tax impact on both investment and
financial decisions.
SVA requires specification of a planning horizon, say, five or ten years, and fore-
casting the cash flows and discount rates based on the underlying plans and strategies.
Various strategies can then be considered to assess the implications for shareholder
value.
A particular problem with SVA is specifying the terminal value at the end of the
planning horizon. One approach is to try to predict the value of all cash flows
beyond the planning horizon, based on that of the final year. Another is to simply
take the value of the net assets predicted at the end of the horizon. None of the
methods suggested is wholly satisfactory. It could be argued, however, that SVA
does not have to be used to obtain the value of the business – rather, it can estimate
the additional value created from implementing certain strategies. Assuming these
strategies deliver competitive advantage, and therefore returns in excess of the cost
of capital over the planning horizon, there is no need to wrestle with the terminal
value problem.
The real benefit of SVA is that it helps managers focus on value-creating activities.
Acquisition and divestment strategies, capital structure and dividend policies, per-
formance measures, transfer pricing and executive compensation are seen in a new
light. Short-term profit-related activities may actually be counter-productive in value-
creation terms.
Balti plc: a simple example of SVA
Balti plc is a food manufacturer with a stock market listing. Its shareholders require a return
of 12 per cent. It has just determined its free cash flow for the year at £100,000, as shown in
the first table below.
Depreciation is £75,000 p.a., rather less than capital expenditure of £125,000 p.a. Extra
investment in working capital to support growth plans is £50,000 p.a.
The free cash flows for years 2–5 of its five-year planning horizon are predicted similar-
ly at £150,000, £170,000, £230,000 and £250,000 respectively. Its net asset value after five
years is predicted to be £2.5 million.
The calculation of the value of the firm to its shareholders (i.e. SV) is shown in the sec-
ond table. The SV is the NPV of all future free cash flows, calculated at £2,036,500.
value drivers
Factors that have a powerful
influence on the value of a
business, and the investors’
equity stake
CFAI_C04.QXD 10/28/05 2:29 PM Page 110

.
Chapter 4 Valuation of assets, shares and companies 111
Self-assessment activity 4.7
Determine the impact on Balti’s SV if it is able to invest £0.3 million now in order to
extend its competitive advantage period to ten years. Assume free cash flow for years
6–10 stabilises at £250,000 p.a. and that the terminal value in year 10 is £4 million.
(Answer in Appendix A at the back of the book)
4.12 ECONOMIC VALUE ADDED (EVA)
Along with SVA comes another piece of ‘alphabet spaghetti’, EVA, a concept trade-
marked by the US consultancy house Stern Stewart (www.sternstewart.com).
Whereas SVA is a forward-looking technique devised for assessing the inherent
value of the equity invested in a firm, EVA is backward-looking, i.e. a measure of
performance. Like SVA, EVA relies heavily on the concept of the cost of capital. It is
used as a device for assessing how much value or wealth a firm actually has creat-
ed. Its roots lie in the accounting concept of Residual Income (e.g. see Horngren et
al. 1998), which is simply the accounting profit adjusted for the cost of using the
capital tied up in an activity.
However, the Stern Stewart version is rather more sophisticated as it attempts to
adjust the recorded profit in various ways. The logic of these adjustments is, broadly,
to avoid recording as a cost the items that are value-creating and that should perhaps
be treated as capital rather than current expenditure. For example, spending on R & D
and on product advertising and promotion contributes to wealth-creation in impor-
tant ways. In addition, any goodwill that has been written off in relation to previous
acquisitions is added back. The general impact of these adjustments – over 150 of these
might be required in a full EVA calculation – is to raise the profit measure and also the
capital employed.
Forecast data for Year 1 £000 Value drivers
Sales 900 Sales growth
less Operating costs (600)
Pre-tax profit 300 Margin
less Tax paid (100) Tax rate
Net operating profit after tax 200
add Depreciation 75
less Fixed capital investment (125) Capital expenditure
less Additional working capital (50) Working capital investment
Free cash flow 100
Calculation of shareholder value:
Forecast cash flows £000
Yr1 Yr2 Yr3 Yr4 Yr5 Terminal Value
100 150 170 230 250
NPV@12% £617,900
PV terminal value £1,418,600
2,500,000
Total NPV £2,036,500 Shareholder Value
CFAI_C04.QXD 10/28/05 2:29 PM Page 111

.
112 Part I A framework for financial decisions
Relating this to an all-equity-financed firm, EVA is calculated after making a further
adjustment for the opportunity cost incurred by shareholders when entrusting their
capital to the firm’s directors. The EVA formula can be written as:
EVA NOPAT (k
e
invested capital)
where:
NOPAT the Net Operating Profit After Tax, and after adjustment for the items
mentioned above
k
e
the rate of return required by shareholders
Invested capital Net Assets, or Shareholders’ Funds
To illustrate the concept, consider the data in Table 4.4.
Both firms have the same equity capital employed of £100 m, and both make posi-
tive accounting profits. However, after adjusting for the cost of the equity capital
employed, Firm B has effectively made a loss for investors, i.e. the negative EVA indi-
cates that it has destroyed value.
On the face of it, EVA is a simple and powerful tool for assessing performance,
explaining why it has been adopted by many firms as an internal performance meas-
urement device, e.g. for determining the performance of different operating units.
However, it is by no means problem-free:
1 Few firms have the resources required to compute EVA, division by division, with
the same degree of rigour as the full Stern Stewart model with its myriad required
adjustments.
2 It is based on book value, rather than market values (necessarily so for business
segments).
3 It relies on a fair and reliable way allocating shared overheads across business units,
the Holy Grail of management accountants.
4 It is difficult to identify the cost of capital for individual operating units.
5 It may be dysfunctional if managers are paid according to EVA, especially short-term
EVA. It is quite possible to encounter investment projects that flatter EVA in the short
term by virtue of high initial cash flows but to have a negative NPV. Such projects
might be favoured by managers who are paid by EVA. Similarly, some long-term
projects that take time and money to develop may lower EVA in the early years but
have a positive NPV. These, of course, could be rejected under an EVA regime.
The verdict is yet to be delivered on EVA, but like many other management tools, it
is probably inadequate when used alone – it is one way of looking at the picture that
should be supplemented by other perspectives.
We have discussed the reasons why financial managers may wish to value their own
and other enterprises, the problems likely to be encountered and the main valuation
techniques available.
Given the uncertainties involved in valuation, it seems sensible to compare the
implications of a number of valuation models and to obtain valuations from a number
of sources. A pooled valuation is unlikely to be correct, but armed with a range of
SUMMARY
Table 4.4
Calculation of EVA
NOPAT Equity EVA
Firm A £20 m £100 m 15% £20 m £15 m £5 m
Firm B £10 m £100 m 15% £10 m £15 m (£5 m)
k
e
CFAI_C04.QXD 10/28/05 2:29 PM Page 112

.
Chapter 4 Valuation of assets, shares and companies 113
valuations, managers should be able to develop a likely consensus valuation. This con-
sensus is, after all, what a market value represents, based upon the views of many
times more market participants. There should be no stigma attached to obtaining more
than one opinion–doctors do not hesitate to call for second opinions when unsure
about medical diagnoses.
Key points
■ An understanding of valuation is required to appreciate the likely effect of invest-
ment and financial decisions, to value other firms for acquisition, and to organise
defences against takeover.
■ Valuation is easier if the company’s shares are quoted. The market value is ‘correct’
if the EMH applies, but managers may have withheld important information.
■ Using published accounts is fraught with dangers, e.g. under-valuation of fixed
assets.
■ Some companies attempt to value the brands they control. An efficient capital mar-
ket will already have valued these, but not necessarily in a fully informed manner.
■ The economic theory of value tells us that the value of any asset is the sum of the
discounted benefits expected to accrue from owning it.
■ A company’s earnings stream can be valued by applying a P:E multiple, based upon
a comparable, quoted surrogate company.
■ Some observers like to compare the EBITDA (Earnings Before Interest, Tax
Depreciation and Amortisation) with share price for different companies as a
cross-check on valuation. Market-based EBITDA multiples can be used as valua-
tion tools.
■ Valuing a company on a DCF basis requires us to forecast all future investment cap-
ital needs, tax payments and working capital movements.
■ Valuation of unquoted companies is highly subjective. It requires examination of
similar quoted companies and applying discounts for lack of marketability.
■ The value of a share can be found by discounting all future expected dividend
payments.
■ The retention of earnings for worthwhile investment enhances future earnings, div-
idends and, therefore, the current share price.
■ The Dividend Valuation Model must be treated with caution. It embodies many
critical assumptions.
■ Economic Value Added (EVA) is the residual profit after allowing for the charge for
the firm’s use of investors’ capital.
■ The two main lessons of valuation are: use a variety of methods (or consult a vari-
ety of experts) and don’t expect to get it exactly right.
Further reading
Comprehensive treatments of share and company valuation are quite rare: Koller et al. (2004) is
probably the best available. A good overview can be found in Chapter 15 (the contribution by
Davies) of Firth and Keane (1986).
The brand valuation issue is addressed by Murphy (1989) and Barwise et al. (1989).
Young (1997) provides a practical application of the EVA concept.
CFAI_C04.QXD 10/28/05 2:29 PM Page 113

.
Questions with a coloured number
have solutions in Appendix B on page 693.
1 Amos Ltd has operated as a private limited company for 80 years. The company is facing increased competi-
tion and it has been decided to sell the business as a going concern.
The financial situation is as shown on the balance sheet:
QUESTIONS
114 Part I A framework for financial decisions
Balance Sheet as at 30 June 1999
£££
Fixed assets
Premises 500,000
Equipment 125,000
Investments 50,000
675,000
Current assets
Stock 85,000
Debtors 120,000
Bank 25,000
230,000
Creditors: amounts due within one year
Trade creditors (65,000)
Dividends (85,000
)
(150,000
)
Net current assets 80,000
Total assets less current liabilities 755,000
Creditors: amounts due after one year
Secured loan stock (85,000)
Net assets 670,000
Financed by
Ordinary shares (50p par value) 500,000
Reserves 55,000
Profit and loss account 1
15,000
Shareholders’ funds 670,000
The current market values of the fixed assets are estimated as:
Premises 780,000
Equipment 50,000
Investments 90,000
Only 90 per cent of the debtors are thought likely to pay.
Required
Prepare valuations per share of Amos Ltd using:
(i) Book value basis
(ii) Adjusted book value
2 The Board of Directors of Rundum plc are contemplating a takeover bid for Carbo Ltd, an unquoted compa-
ny which operates in both the packaging and building materials industries. If the offer is successful, there are
no plans for a radical restructuring or divestment of Carbo’s assets.
CFAI_C04.QXD 10/28/05 2:29 PM Page 114