Morris & Fan. Reservoir Sedimentation Handbook
Подождите немного. Документ загружается.


CACHÍ HYDROPOWER RESERVOIR, COSTA RICA 19.23
19.4.7 Repeated Depth Soundings
Two depth sounding surveys were made of the reservoir before and after the October
1990 flushing to determine the amount of material eroded from the reservoir and the
areas where erosion occurs during flushing. The surveys were performed with a 192-kHz
echo sounder, a total survey station giving the distance and bearing to the boat every second,
and a portable computer which calculated position on the national grid and stored the
information on disk. Survey cross sections ran perpendicular to the reservoir axis at 100-m
intervals. Depth data were recorded on paper, digitized, edited graphically, and then
converted into files of depth as a function of time. Depth errors were expected to be on the
order of 0.1 m. The total survey station was accurate to within 0.1 m, but the positioning
prism on the boat was mounted 4.5 m ahead of the sonar transducer. To minimize this
positioning error, the travel time of 4.5 m at the survey speed of 2.8 knots was computed and
the corresponding time delay was added into the depth data prior to merging with the
coordinate data file. Because heavy subbottom profiling equipment was carried in the boat
during the first survey only, there was a difference in the vessel draft of about 3 cm, which
was compensated for. Coordinate data and time- delayed depth data were merged to create a
file of x, v, z datapoints, and all data values within each 10- x 10-m grid along the survey
lines were averaged to determine the average depth within each grid during each of the
two surveys. There were 542 grid boxes having datapoints for both surveys, and depth
differences were computed for these locations.
From the 542 coincident grid boxes, it was found that most erosion occurred along the
thalweg with erosion depths typically in the 0.5- to 1.5-m range, similar to the deposition
depth. Most of the sediment delivered to the reservoir was deposited along the main channel and
subsequently removed by flushing. About 750,000 m
3
of material was eroded from the main
channel in the surveyed area (the lower reservoir basin), equivalent to about 300,000 tons dry
weight of sediment using a bulk density of 0.4 g/cm
3
. Erosion from the unsurveyed upper
reservoir basin was estimated at 50,000 to 100,000 tons by interpretation of side-scan sonar
and subbottom profiling. Total erosion during flushing was estimated at 350,000 to
400,000 tons.
River terraces submerged by the reservoir are elevated 5 to 10 m above the channel thalweg.
They showed either a consistent increase in sediment accumulation of 0.1 to 0.2 m, or a pattern
of alternating positive and negative changes. The largest net accumulation (0.1 to 0.2 m)
occurred on terraces covered with hyacinths during flushing. Hyacinths prevented desiccation
of surface sediments and also contributed organic debris. Accumulation depth was greatest on
lower terraces adjacent to the channel, or close to the river inflow. The rate of sediment
accumulation was small on the larger and higher terraces. Turbidity currents transporting the
inflowing fines along the main channel probably play a large role in this distribution
pattern. The Swedish team observed a turbidity current during a rainstorm when the reservoir
was full. The plunge point was observed to occur in the narrow region separating the upper and
lower reservoir, based on changing water color and hyacinth movement.
19.5 SEDIMENT RELEASE
19.5.1 Erosion Processes Observed during Flushing
Sundborg (1992a) reported on the erosional processes observed during drawdown and
flushing. The upper basin has a rather flat and shallow bottom and is normally covered
with water hyacinths. It contains beds of sandy or gravelly material from delta deposits,
and relatively small amounts of erosion were observed from this area during flushing.
In the main basin minor gullies were formed across the terraces during the slow draw-
down phase, and on terrace slopes there was a tendency for sediments to be eroded by
wave action. However, there were no traces of any generalized erosion of sediment from
CACHÍ HYDROPOWER RESERVOIR, COSTA RICA 19.24
the surface of the terraces, except for the small gullies draining tributaries which
reached a maximum width and depth of about 2 to 3 m.
Most of the inflowing sediment is deposited along the main channel, which is also
the zone of maximum erosion. The slow drawdown exposed channel sediments to
scouring action, and finer sediments were transported toward the dam. Each opening of
the bottom gates during slow drawdown released highly turbid water for a short
period, discharging fine-grained material that had been eroded from along the thalweg
and transported to the dam during the previous day's drawdown.
During the rapid drawdown phase (from 960 m to 921 m over a period of about 10
hours) the erosion and release of thalweg sediments was spectacular. This was
especially true during the last few meters of the drawdown when the water level declines
rapidly because of the reduced water surface area. So much sediment was being
eroded and transported during this period that hyperconcentrated flows were
observed along the flushing channel. Scars formed by sediment slumping were
observed within the reservoir after flushing. A photograph looking downstream
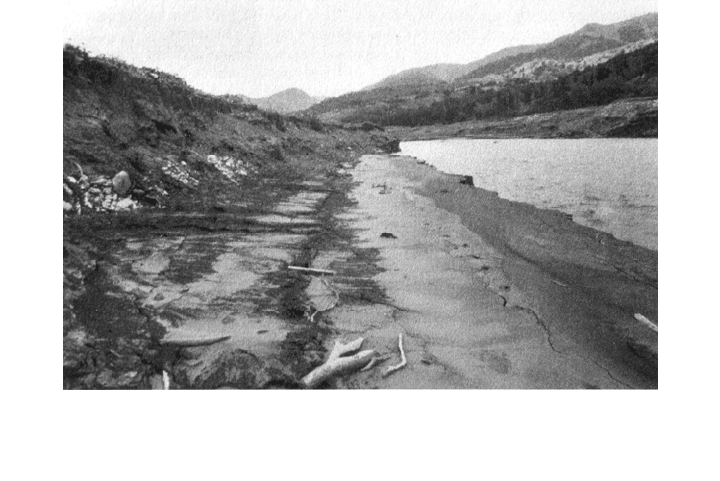
along the left bank of the main channel during flushing is shown in Fig. 19.16.
FIGURE 19.16 Photo looking downstream along main channel during flushing,
illustrating higher river terrace on the left, recent sandy deposits being eroded with visible
tension cracks, and the main channel on the right which has already eroded to the original
armor layer in the river (G. Morris).
Th
e turbid water released from the reservoir, as monitored from a light aircraft, was
observed to flow downstream to the ocean where it creates a stratified plume of turbid
water extending into the Caribbean Sea. Substantial amounts of sediment
were deposited on low floodplain areas and bars between the dam and the ocean.
These deposits would be eroded during subsequent floods.
19.5.2 Sediment Release during Flushing
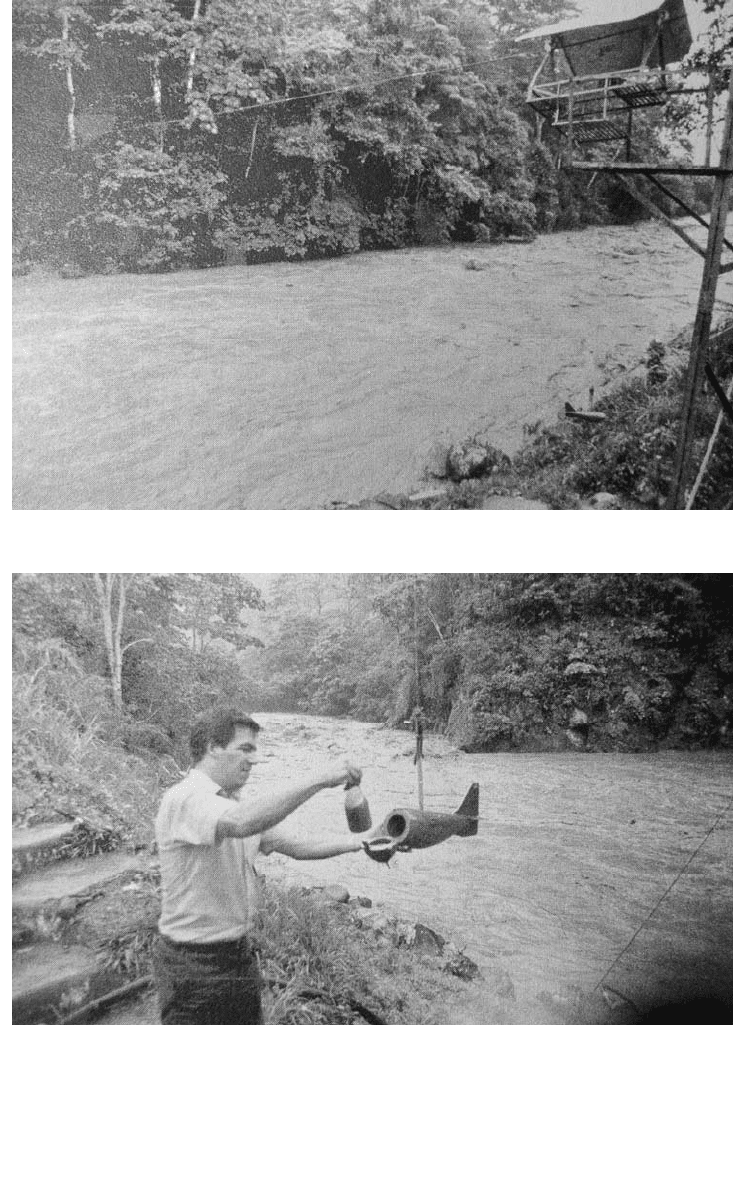
Jansson (1992b) summarized the monitoring of sediment outflow during flushing. ICE
monitored sediment discharge during flushing events by taking depth-integrated water
samples at 15- to 30-min intervals at the El Congo gage during the rapid drawdown and
free-flow periods (Fig. 19.17). The slow drawdown phase was sampled only
intermittently, as relatively small amounts of sediment are released during that phase.
Because the flushing period was controlled by gate operations and could easily be
CACHÍ HYDROPOWER RESERVOIR, COSTA RICA 19.25
(a)
(b)
FIGURE 19.17 Suspended solids measurement at El Congo station downstream of Cachí
reservoir during flushing. (a) Funicular carriage with sampler hanging beneath. (b) removal o
f
sample bottle containing sediment. (G. Morris)
CACHÍ HYDROPOWER RESERVOIR, COSTA RICA 19.26
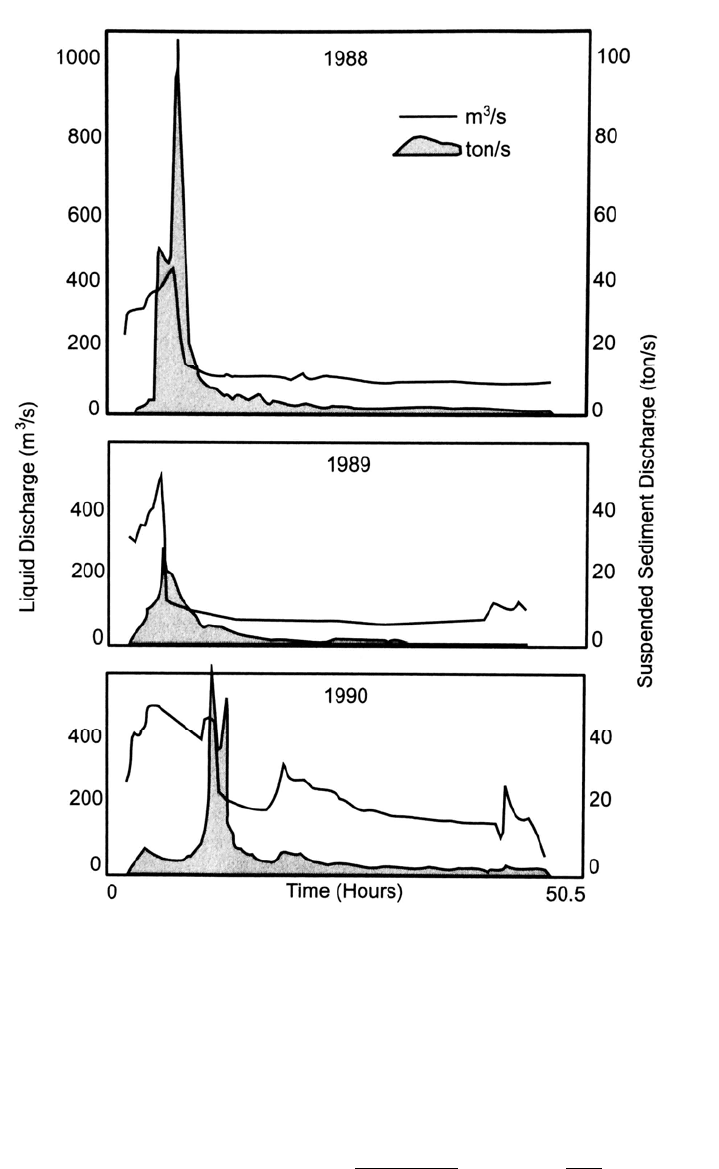
FIGURE 19.18 Discharge and sediment load at El Congo station downstream of Cachí reservoi
r
during 50.5 hours of flushing in three different years (after Jansson, 1992b).
e
asily monitored, reliable data on sediment release were obtained without use of
turbidimeters. The water discharge and sediment load during 50.5 hours of rapid drawdown
and free flow for three flushing events are shown in Fig. 19.18. Sediment discharge during
each period for the 1990 flushing is given below:
Slow evacuation 27,000 tons 4%
Rapid evacuation 278,700 tons 43%
Free flow 347,100 tons
54%
Total 652,800 tons 100%

CACHÍ HYDROPOWER RESERVOIR, COSTA RICA 19.27
The sediment discharge computed from water sampling was over 50 percent higher than
the erosion estimate of 350,000 to 400,000 tons computed from depth soundings before
and after the flushing event.
The highest sediment concentrations (exceeding 400 g/L during the 1988 flushing)
and most of the sediment discharge occurs at the end of the rapid drawdown and start of
the free-flow phase, when high velocities erode the material that has been transported
to and accumulated along the channel near the dam. The percentage of total sediment
outflow that occurred during the peak 4-hour period in the 1988, 1989, and 1990 flushing
events has been computed from these load graphs as 62, 51, and 44 percent
respectively.
Turbidimeter monitoring of sediment released during the 1990 flushing was
discontinuous because of clogging and other mechanical problems. However, sufficient
data were collected to reveal that the calibration curve of turbidity versus suspended
solids changed from the rapid drawdown to the free-flow period, apparently
because of the change in the grain size distribution of the transported sediments.
Sediment monitoring at the Angustura station, downstream of El Congo, also revealed
that sediment concentration tends to decrease downstream because of settling plus
dilution from tributaries.
19.6 SEDIMENT BUDGET
Reservoir sediment budgets were prepared for the studied flushing period
(September 16, 1989 to October 13, 1990) and for an average hydrologic year (Table
19.6), classifying the sediment inflow by source (Sundborg and Jansson, 1992).
TABLE 19.6 Sediment Inflow into Cachí Reservoir by Source
Sediment source 1989-1990, ton/yr Average year, ton/yr
Suspended load:
La Troya 265,000 326,000
Palomo 450,000 259,000
Ungaged area 110,000 162,000
El Llano dredging 28,000 —
Bed load:
All sources 66,000
60,000
Total Load 919,000 807,000
Note: Dredging at the small El Llano reservoir upstream contributed sediment during the intensive study
period. Source: Sundborg and Jansson (1992).
The fate of the sediment entering the reservoir during an average hydrologic year is
summarized in Table 19.7. Of the average inflow of 807,000 tons/year, 148,000 tons is
released through normal hydropower and gate operations for an average release
efficiency of only 18% (trap efficiency of 82%) in the absence of flushing. With
annual flushing operations the sediment release efficiency is increased to 73%. Most
of the inflowing fines are transported along and deposited within the flushing
channel by turbidity currents, and essentially all these in-channel deposits are
removed by flushing. Only the coarse bed material and the fines deposited on
terraces remain trapped.

CACHÍ HYDROPOWER RESERVOIR, COSTA RICA 19.28
TABLE 19.7 Sediment Loading and Release at Cachí Reservoir during an Average
Hydrologic Year
Sediment Distribution tons/year % of total
Throughflow 148,000 18
Deposited on terraces 167,000 21
Bed load trapped in reservoir 60,000 7
Turbidity current deposits removed by flushing 432,000
54
Total 807,000 100
Source: Sundborg and Jansson (1992).
19.7 CLOSURE
Studies at Cachí demonstrate the effectiveness of regular flushing for sediment removal.
They also demonstrate the difficulty of accurately measuring sediment yield in
small flashy streams, and provide an excellent example of use of turbidimeters under
difficult field conditions. Despite sophisticated methods used to determine the annual
sediment balance across the reservoir by bathymetric measurements, only 350,000
to 400,000 tons of sediment removal was computed in the bathymetric study, as
opposed to 652,000 tons based on suspended-sediment measurements downstream
of the dam. Sampling during the 1990 flushing event was carefully planned and
supervised by technical personnel from ICE and the Swedish team, and the suspended
sediment data at El Congo during flushing are felt to be the most accurate of all the
datasets. This underscores the problem of short-interval bathymetric comparisons
which attempt to measure small changes in sediment depth. Although better results
might be achieved in a reservoir with a more regular bottom, as opposed to the steep
terrace faces that occur in Cachí, the sources of error in bathymetric measurements are
such that they should be used with utmost caution in studies involving small
increments in deposition depth. While bathymetric studies continue to be the most
convenient and accurate method for determining long-term deposition patterns, and
represent the benchmark against which fluvial sediment studies should be
compared, they have important limitations for short-term studies.

CHAPTER 20
LOÍZA RESERVOIR CASE STUDY
The Loíza case study illustrates sediment management strategies developed at a
municipal reservoir based on a combination of sediment pass-through and dredging.
Sediment pass-through at this site requires real-time hydrograph prediction. The history
of this site also illustrates the consequences of failing to address sedimentation issues in a
timely fashion, a
problem that may become increasingly common as urban areas continue
to grow, reservoirs age, and sedimentation progresses. This case study has been compiled
from published documents and the first author's involvement with this site.
20.1 PROJECT HISTORY
The 8680-km
2
island of Puerto Rico lies approximately 1600 km southeast of Miami,
Florida. The island's topography is rugged, consisting mostly of hilly and mountainous
lands surrounded by a narrow coastal plain, and 55 percent of the island's land surface
has slopes exceeding 35 percent. The climate is tropical and moist, rainfall averages
about 1900 mm/yr, and the average temperature is 25°C. With a 1995 population of 3.7
million, the island wide population density was 426/km
2
. Most of the population is
located along the coastal plains, and about 1.5 million reside in the metropolitan area of
greater San Juan, the capital city.
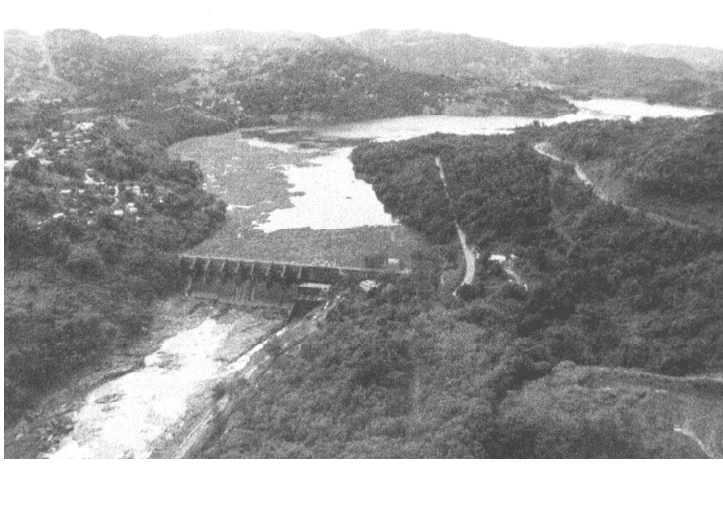
Loíza (Carraízo) Reservoir (Fig. 20.1), owned and operated by the Puerto Rico
Aqueduct and Sewer Authority (PRASA), produces about half of the total 7.4 m
3
/s (170 ×
10
6
gal/day) municipal water supply for the San Juan area. It had an original volume of
26.8 Mm
3
. Between closure in March 1953 and the most recent survey in November
1994, Loíza reservoir had lost 53 percent of its capacity because of sedimentation; its
total volume had been reduced to 14.2 Mm
3
(Webb and Soler-Lopez, 1997). Reservoir
sedimentation has long been recognized to be a problem in Puerto Rico. Bogart et al.
(1964) stated, "Loss of reservoir capacity is the major problem caused by sediment in
Puerto Rico. Several reservoirs are almost completely filled with sediment and some
larger reservoirs are losing capacity rapidly." Rapid sedimentation of Loíza Reservoir
was identified as a serious problem by Quinones (1980) and also by several engineering
studies during the 1970s and 1980s.
Drought and water rationing affected San Juan in 1964, 1967-1968, 1974, 1977, 1994,
and 1995. Fluvial sediment monitoring at U.S. Geological Survey (USGS) gage stations
upstream of Loíza Reservoir was initiated in 1984, but attention was not focused on the
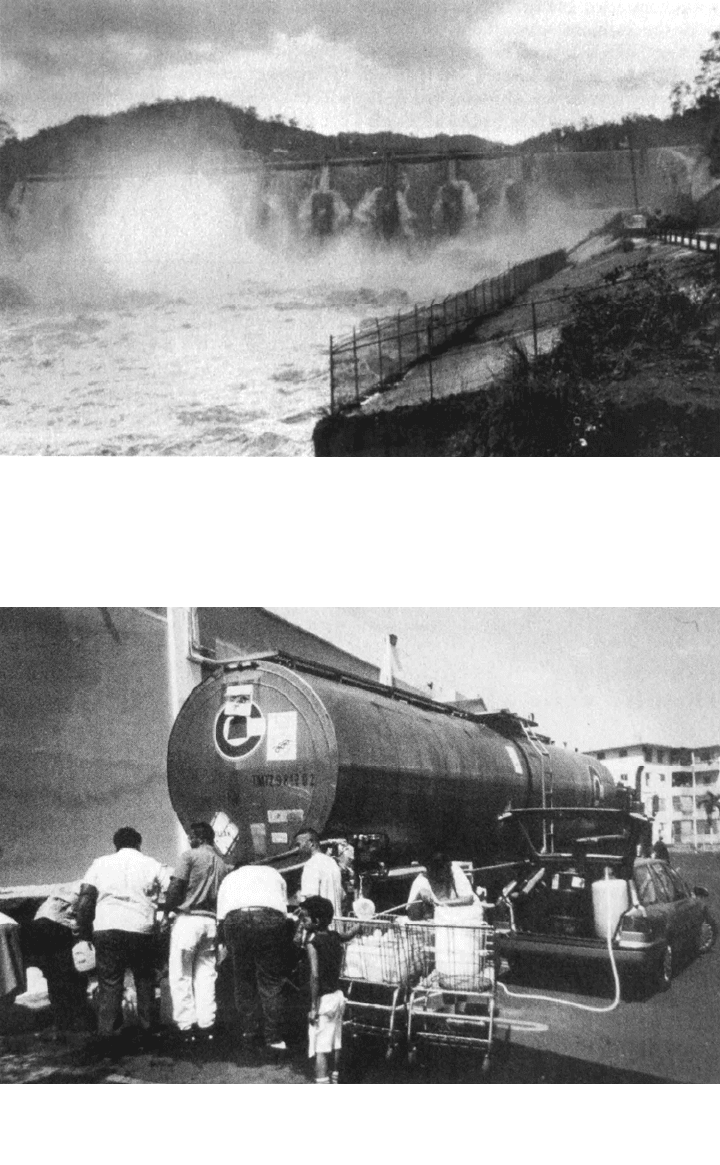
deteriorating conditions at the reservoir until 1989, when failure of both the primary and
backup electrical systems during hurricane Hugo resulted in overtopping of the dam
when the crest gates could not be opened (Fig. 20.2). Discharge over the non-overflow
portion of the dam flooded the 3.5-m
3
/s (80×10
6
gal/day) raw water pump station, leaving
LOÍZA RESERVOIR CASE STUDY 20.2
FIGURE 20.1 Loíza Reservoir, Puerto Rico. Much of the water surface near the dam is covered
with water hyacinth, Eichornia crassipes (G. Morris).
about 750,000 people in San Juan without water for 8 days (Morris and Krishna, 1991).
Sediment management activities were initiated soon thereafter with a reconnaissance
level analysis of both Loíza and La Plata reservoirs, the development of a sediment
routing procedure, and the initiation of planning and permitting procedures for a large-
scale (6-Mm
3
) dredging project. However, a change of administration in 1993 resulted in
temporary abandonment of all phases of this project.
A severe drought began in 1994 which affected all surface water sources supplying
San Juan, and more than 1.5 million persons were subjected to water rationing for a
period extending from May until September. Total municipal water production was less
than half of normal, and withdrawals from Loíza reservoir dropped to less than 40
percent of normal. The entire water distribution system was pressurized on a rotating
basis, each sector receiving water service for up to 8 hours every second day. Extensive
use was made of tank trucks to distribute water to hotels and to consumers (Fig. 20.3). As
water levels dropped, an emergency project was undertaken to dredge a channel through
the shallowest part of the reservoir, about 3 km above the dam, to prevent the pool from
becoming divided into two separate areas as water levels dropped. For lack of a suitable
disposal site in the mountainous area surrounding the lake, the dredged sediment was
placed below the normal pool level in a tributary arm of the lake. This hastily organized
work was not completed under the short timetable established in the contract and
terminated in litigation. A small amount of coarse sediment was subsequently removed
from a normally submerged sand bar by the National Guard with conventional
earthmoving equipment, but in general the deposits were too fine and weak to be worked
by land equipment.
In 1995, drought conditions and water rationing returned again, and it was decided to
reactivate the large-scale dredging plan and permitting process. In 1996, large-scale
dredging was contracted, but by 1997 sediment pass-through had not yet been
implemented.
LOÍZA RESERVOIR CASE STUDY 20.3
FIGURE 20.2 Overtopping of Loíza Dam during hurricane Hugo,1989 (G. Morris).
FIGURE 20.3 Use of tank trucks to distribute water in San Juan during 1994 drought (G. Morris).
LOÍZA RESERVOIR CASE STUDY 20.4
To provide the additional water supply needed to eliminate overdrafting at both Loíza
and La Plata Reservoirs, a contract for the design and construction of a 4.4 m
3
/s (100×10
6
gal/day) aqueduct to connect Dos Bocas and Caonillas hydropower reservoirs to the
metropolitan water supply system was also awarded in 1996. These existing reservoirs,
constructed in 1942 and 1948 respectively, had by 1996 lost 43 percent and 12 percent of
their capacity to sedimentation. With its heavy dependence on reservoirs, sediment
management is required for Puerto Rico to sustain long-term water supplies.
20.2 HYDROLOGY
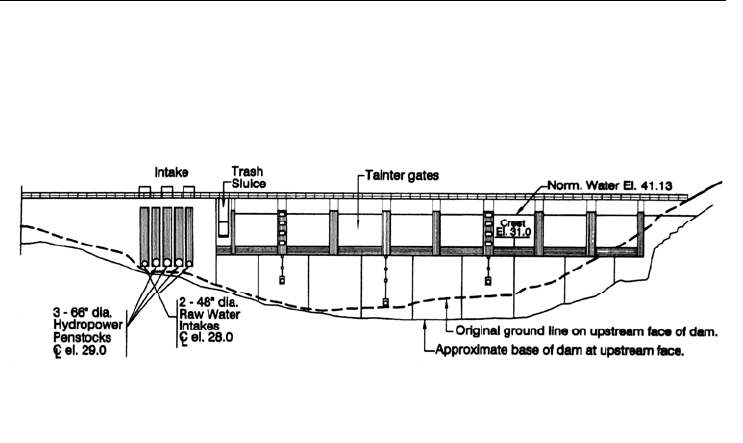
Loíza Dam is a concrete gravity structure 29 m tall with eight 10-m-tall radial crest gates
and a spillway design capacity of 8830 m
3
/s. There are three inoperative 1.1-m-diameter
(42-in) low-level drains and no bottom sluice (Fig. 20.4). Bogart et al. (1964) reported
that, during the initial years of impounding the 1.1-m-diameter outlets at the base of the
dam were opened during runoff events to vent turbidity currents. The effectiveness of this
measure in releasing sediment was never documented, but it was probably not large. Each
drain had only a single gate valve. Sediment releasing was discontinued after some years
for fear that submerged debris may become lodged in the valve, preventing closure and
draining the reservoir, a problem which actually occurred at the Guayabal irrigation
reservoir on the island's south coast.
FIGURE 20.4 Water face of Loíza Dam (P. R. Water Resources Authority, 1979).
The dam impounds 534 km
2
(71 percent) of the Loíza River watershed, the largest in
Puerto Rico (Fig. 20.5). Rainfall within the watershed averages 1900 mm/yr, of which
about 841 mm (44 percent) appears as runoff. As seen in Fig. 20.6a, runoff is usually
well-distributed throughout the year. The reservoir is hydrologically small, and the
original total storage volume of 26.8 Mm
3
equaled only 6 percent of mean annual runoff,
equivalent to a runoff depth of 50 mm, across the tributary watershed.
The storage-yield curve at Loíza dam (Fig. 20.6b) shows that a significant increase in
firm yield can be achieved from a relatively small increment in storage. This is
advantageous from the standpoint of sediment control, since substantial water supply
benefits can be achieved while maintaining a relatively small storage volume free of
sediment. Despite the limited storage capacity, this reservoir normally diverts to
municipal use a constant flow equal to 25 percent of the mean annual flow of the Loíza
River at the dam site, a withdrawal rate that exceeds the reservoir firm yield and which
leads to severe rationing during drought.