Morris & Fan. Reservoir Sedimentation Handbook
Подождите немного. Документ загружается.


LOÍZA RESERVOIR CASE STUDY 20.25
water column by filtering or other means (e.g., additional natural sedimentation within
the reservoir) would reduce potential water quality impacts to acceptable levels.
20.8 PROJECT COSTS AND IMPLEMENTATION
The total implementation cost of sediment routing at Loíza is less than $1 million. No
structural modifications are required at the dam. The cost of dredging 6 Mm
3
, including
construction and management of diked containment areas, received a low bid of $42
million in 1995. This does not include land acquisition costs, which may run $8 million.
Engineering, testing, and permitting are estimated to cost an additional $2 million. The
total dredging cost is anticipated at about $8.70/m
3
.
20.9 CLOSURE
The Loíza case study illustrates the application of real-time hydrologic modeling to
optimize sediment routing within a highly constrained operational environment, in
conjunction with reservoir dredging. It also illustrates that in some cases significant
sediment control benefits can be achieved without structural modification, and with
minimal environmental impact, by simply changing operating procedures during storm
events. Finally, this case history illustrates the consequences of failing to take timely
actions to solve sedimentation problems, and the potentially torturous path toward
implementation.
CHAPTER 21
GEBIDEM DAM AND RESERVOIR
The Gebidem hydroelectric reservoir in Switzerland is an example of one of
several sites in the Alps region where flushing for sediment control has been conducted
on a regular basis. This case study is based on annual operating reports of flushing
activities kindly provided by the owner, Electra Massa, and a site visit to observe the
empty reservoir and modifications to the outlet structure in the company of Gian
Rechsteiner, in addition to the cited literature and reports.
21.1 INTRODUCTION
The Gebidem arch dam began impounding in 1968 on the Massa River, a tributary to the
Rhone just upstream of Brig, Switzerland. Because of topographic limitations imposed by
the 5 percent stream slope and narrow gorge, the 120-m-tall arch dam with a 327 m crest
length impounds only 9×10
6
m
3
of water and the reservoir is only 1.5 km long. The
facility operates either in a daily peak load mode or continuously, depending on the
inflow. The power plant has a 340-MW nominal generating capacity at 55 m
3
/s and 743
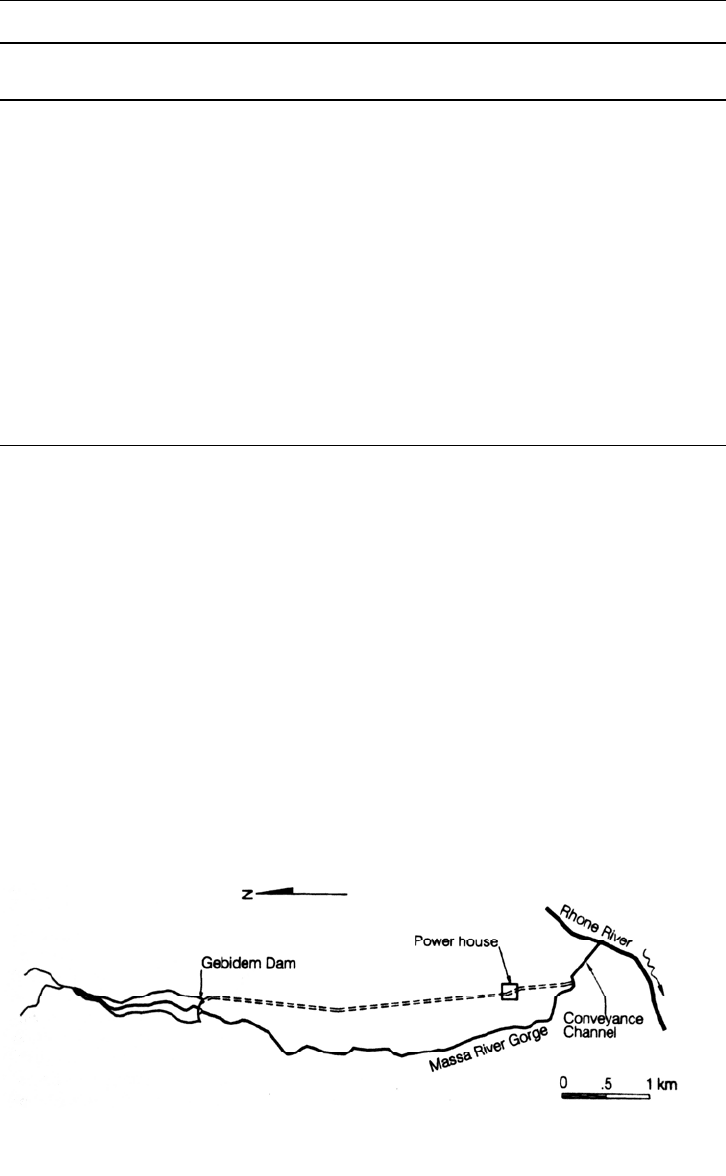
m head, and the tailrace discharges directly to the Rhone. A location map is shown in Fig.
21.1.
Sixty-five percent of the 200-km
2
watershed tributary to the dam is occupied by the
d'Aletsch Glacier, the largest in Europe. Glacial activity produces a sediment yield
equivalent to a denudation rate of 2.5 mm/yr averaged across the watershed, more than an
order of magnitude higher than is typical of unglaciated mountain areas in Switzerland.
The total sediment load entering the reservoir is about 400,000 m
3
/yr of cohesionless
material, mostly in sizes ranging from very fine sand through gravel, and about 20
percent of the total load is composed of sediments between 1 and 100 mm in diameter.
Because a conventionally operated reservoir at this site would fill with sediment in about
20 years, sediment management was incorporated from the initial design stage.
FIGURE 21.1 Location map of Gebidem darn.
GEBIDEM DAM AND RESERVOIR 21.2
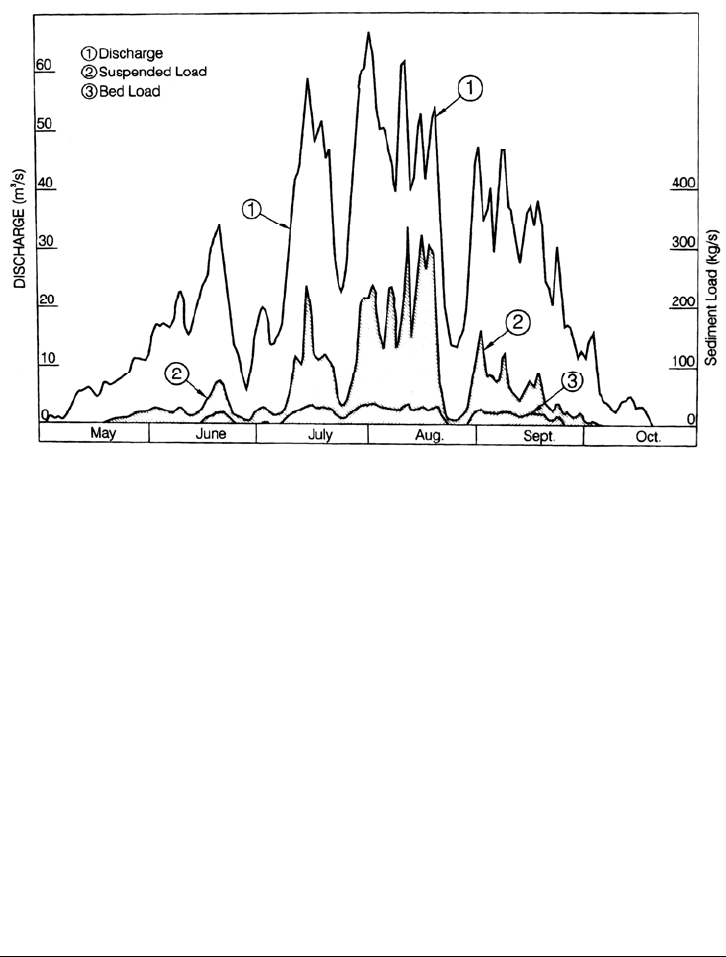
FIGURE 21.2 Discharge of water and solids in Massa River at Gebidem dam site, 1958 (afte
r
Oberle et al., 1967).
The Massa River between the glacier and the Rhone can be divided into three
reaches: a 5-km upper reach averaging 5.5 percent slope, a steep middle reach 1 km long
at 20 percent slope, and a lower reach 0.8 km long at 0.8 percent slope. The dam was
located in the middle of the upper reach. Because of its low slope, the reach of the Massa
River immediately upstream of its confluence with the Rhone was channelized by a
rectangular concrete section to facilitate sediment conveyance into the Rhone. A sand and
gravel operator subsequently constructed a small dam in the gorge immediately
upstream of the channel to capture part of the sediment for classification and sale as
commercial aggregate.
Typical of glacial-fed streams, discharge at the dam site is seasonal and is dominated
by snowmelt, glacial melt, and summer storms. Winter flows, from November through
April, are negligible. The hydrograph in Fig. 21.2 illustrates the pattern of both liquid and
solid discharge observed in 1958 during the six warm months when there was
appreciable flow.
21.2 ALTERNATIVES CONSIDERED
A variety of sediment management alternatives were initially considered, but based on a
screening analysis which eliminated a number of options, three alternatives were subject
to more detailed analysis at this site: (1) sediment bypass, (2) periodic dredging, and (3)
emptying and flushing. Under the sediment bypass alternative, the sediment-laden flows
would be discharged through a large-diameter free-flow tunnel exiting downstream of
the dam. The dredging alternative would involve use of a pumping suction dredge
discharging downstream through outlets located at various levels in the dam. Oberle et
al. (1967) noted that the venting of turbidity currents was among the alternatives
originally considered, but that the grain size of the inflowing sediment was considered to
be generally too large. Under the flushing alternative the sediment would be scoured out

GEBIDEM DAM AND RESERVOIR 21.3
TABLE 21.1 Cost and Water Use for Three Sediment Management Alternatives
Considered at Gebidem Dam
Alternative
Capital cost,
10
6
francs
Unit cost of
sediment
removal,francs/m3
Water use,
10
6
m
3
/yr
1. Sediment bypass 9 3.8 24
2. Dredging 3.7 2.0 10
3. Flushing Small 0.8 8
Source: Ullmann (1970).
through the low-level sluices designed for emptying the reservoir. Flushing was the least
costly alternative to implement because it would use planned engineering works (the
emptying outlet) and would require essentially no other structural work. This alternative also
used the least amount of water. The costs and water use associated with each alternative
are compared in Table 21.1.
Two physical models were constructed to test and aid in the design of the system. A
1:30 scale model of most of the reservoir area was used to examine sediment scour along
the entire length of the reservoir, and a 1:15 scale model of a single low-level sluice
examined the entrance shape and the placement of deflectors and water jet pipes for
disaggregating sediment that may accumulate in front of the outlet. Bed material up to
40 cm in diameter was simulated.
Two types of sediment flushing operations were considered and analyzed in the
modeling, pressure scour, and free-flow scour. Under the pressure scour option, the
reservoir is drawn down to the minimum operating level and then the bottom outlets are
opened to allow the development of a conical scour hole in front of the outlet while
maintaining the minimum operating level (Fig. 15.8). Sediments from the upper portion
of the reservoir are carried toward the dam during the drawdown, but the only sediments
evacuated are about 25,000 to 30,000 m
3
of material in the area of the semi-conical scour
hole in front of the outlets. While the scour hole can be evacuated in only 2 to 3 hours, it
takes 20 to 30 hours to refill the hole with sediment. To discharge the anticipated 400,000
to 500,000 m
3
/yr of sediment inflow, 10 to 15 drawdowns would be required annually.
The adopted flushing alternative was to completely empty the reservoir and allow free
flow through the bottom outlets for a period of 2 to 4 days. Water use during the flushing
was originally estimated at 6 to 8×10
6
m
3
, but in practice it has averaged less than 3×10
6
m
3
. Because of regular flushing, there has not been a problem of excessive sediment
accumulation in front of the bottom gates, and the water jet pipes provided for dislodging
sediment are not used.
21.3 CONFIGURATION OF LOW-LEVEL OUTLET
The dam was designed with two flushing tunnels located directly beneath the intake
structure and near the original streambed elevation (Fig. 21.3). This figure also shows the
new multiple-level intake tower that was retrofitted in 1995-1996. The low-level outlet
originally contained two gates: a downstream sector gate (radial gate) and an upstream
flap gate to serve as an emergency gate that can be closed for maintenance of the sector
gate and discharge tunnel. These gates were selected for their robust design and ability to
pass coarse sediment. Neither type of gate requires guide channels or mechanical surfaces
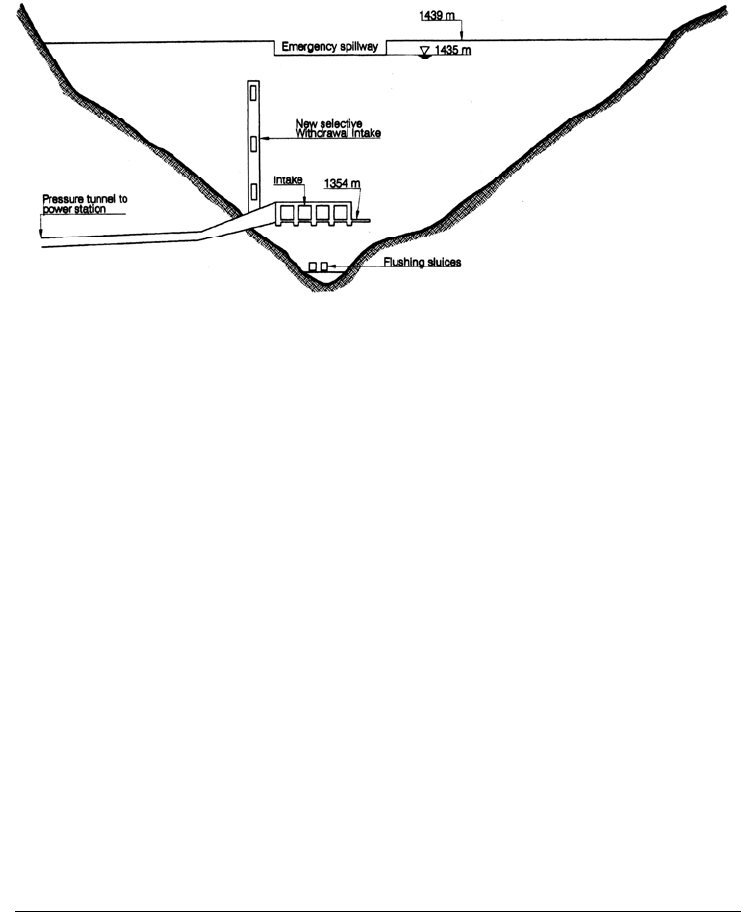
GEBIDEM DAM AND RESERVOIR 21.4
in the flushing channel, other than the flat surfaces for gate seals (Stutz, 1967). So that it
resists erosion, the entire perimeter of the flushing tunnel was lined with steel plate. The
hydropower intake was located above the flushing sluices so that sediment is removed
from the area beneath the intake during each flushing.
FIGURE 21.3 Water face of Gebidem dam showing location of flushing outlets in relation to
the intake structure.
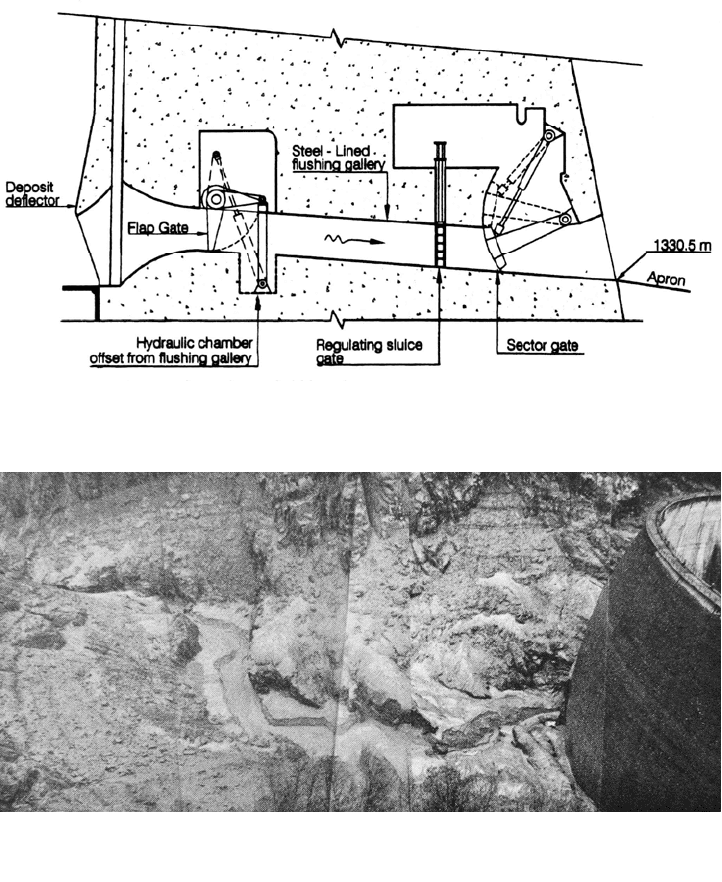
After 25 years of operation, erosion had become significant in the gate seal on the
bottom outlet. Suspended sands were able to enter the power intake, and fine sediment
that entered the power intake was causing excessive wear on turbine runners. In 1995-
1996 two construction modifications were performed to correct these problems. A third
gate was added to modulate discharge during flushing operations, allowing the two
original gates to be used only in fully open or fully closed mode. When these gates are
used in partially open mode to regulate flow, the sediment erodes their seals and
compromises their water tightness. Erosion of the seal at the modulating gate would not
be a problem because it would never be used as a watertight closure. The new regulating
gate is a vertical sluice installed immediately upstream of the sector gate, which was
relocated a short distance downstream to make space. The modified gate arrangement is
shown in Fig. 21.4. The second modification was to replace the existing fixed-level
intake with an intake tower having multiple ports to allow withdrawals from higher levels
in the water column where both the concentration and grain size of sediment will be
smaller.
21.4 FLUSHING OPERATIONS
The reservoir first impounded water during a partial filling in 1968. It was flushed in June
of that year and between May and July in every subsequent year. Flushing has maintained
the entire reservoir virtually free of sediment accumulation because of its narrow gorge-
type geometry (Fig. 21.5). Flushing is conducted during the late spring and early summer,
prior to late summer floods, when two conditions occur: (1) the flow of the Massa River
is relatively low (less than 20 m
3
/s) and dilution flow in the Rhone is relatively large
(more than 40 m
3
/s) but not near flood stage; and (2) the 0°C isotherm is located around
3000 m, which corresponds to stable meteorological conditions. The large flow in the
Rhone is required to dilute and transport the sediment delivered from the flushing. Ideally
GEBIDEM DAM AND RESERVOIR 21.5
FIGURE 21.4 Gate configuration at Gebidem dam.
FIGURE 21.5 General view of reservoir upstream of Gebidem dam in 1995, after 27 years of
operation with annual flushing (G. Morris).
th
e Rhone discharge would be 10 times the flow of the Massa, but this condition is rarely
met. Although the designated flushing period is the same every year, the exact date to
begin flushing is established only 1 day in advance, when the proper hydrologic and
meteorological conditions have coincided. Monetary penalties may be assessed for
downstream fish kills, and high suspended-sediment concentrations also interfere with
downstream municipal water intakes. Suspended-sediment concentrations in the Rhone
are monitored at several sites during each flushing event.
Prior to flushing, the reservoir is brought to its minimum operational level by
releasing water through the turbines. Flushing is initiated with the gradual opening of first
one gate, then the second, over a period of approximately 2 hours, increasing discharge
from an initial rate of about 10 m
3
/s to a final rate of about 60 m
3
/s. Between 3 and 6
hours after initiation of gate opening the reservoir has been completely emptied and free

GEBIDEM DAM AND RESERVOIR 21.6
flow flushing through the outlet begins, typically at discharges between 10 and 20 m
3
/s.
In some years the gates are closed for periods of about 20 minutes, then fully reopened;
the resulting rising and lowering water level facilitates flushing of deposits in the vicinity
of the dam. Some characteristics of flushing events are summarized in Table 21.2. The
column labeled "Gate operations" in the table refers to the number of times the bottom
gates were closed and reopened during the flushing event to facilitate sediment removal.
The amount of solids flushed from the reservoir are not monitored every year, but are
computed by assuming 6 percent solids concentration in the flushing discharge, a value
established by field sampling during early flushing events. Thus, the values for sediment
removed are, in many years, only rough estimates.
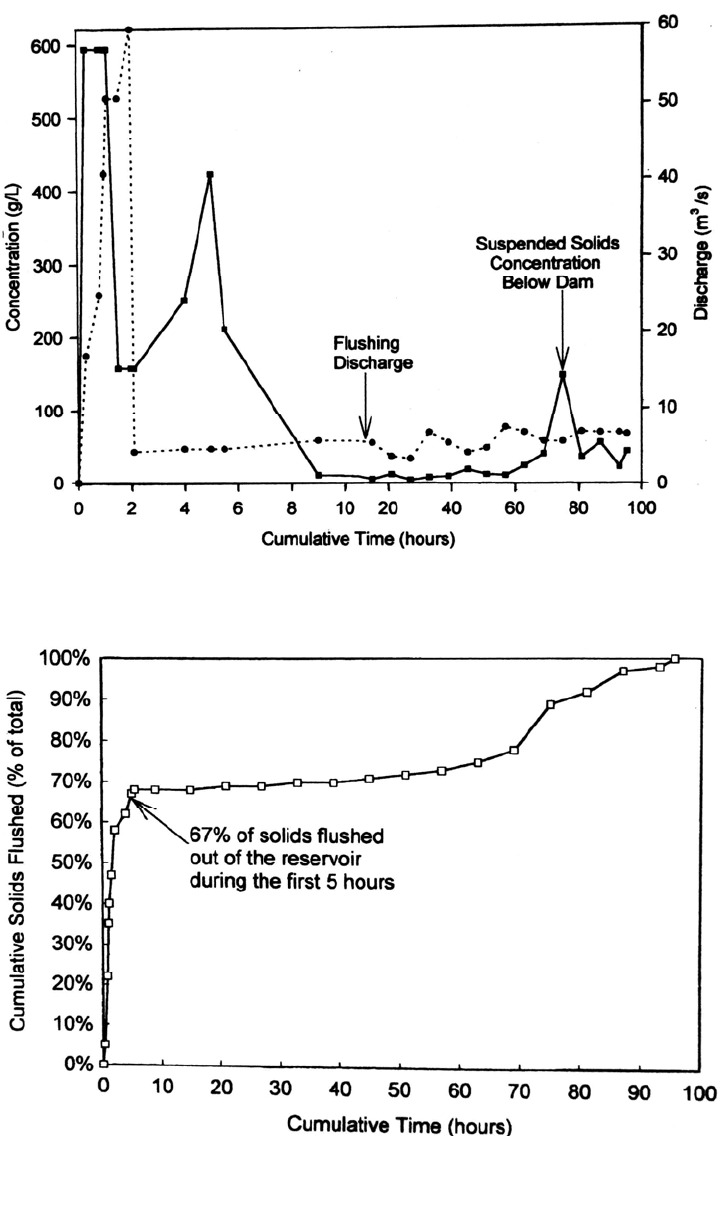
More detailed measurements were made during the 1991 flushing event to construct a
sediment budget. The original data for sediment concentration are reported in units of
milliliters per liter of settleable solids as measured in an Imhoff cone, and have been
adjusted to grams per liter by using the conversion factor of 1 mL/L = 1.32 g/L, measured
in the Rhone at Lonoza during the 1995 flushing. Discharge and concentration data at the
dam (Fig. 21.6) reflect the high initial sediment concentration characteristic of flushing
operations. Because of settling of sediments within the gorge, the maximum suspended
solids concentration measured at the channel in the flat downstream reach was 304 g/L,
only 51 percent of the maximum value registered at the dam. The highest suspended
solids concentration measured in the Rhone at the Brigerbad Bridge was 47 g/L,
compared to 2 g/L in the Rhone above the confluence with the Massa. Two-thirds of the
total sediment discharge occurred during the first 5 hours of this 95.5-hour event (Fig.
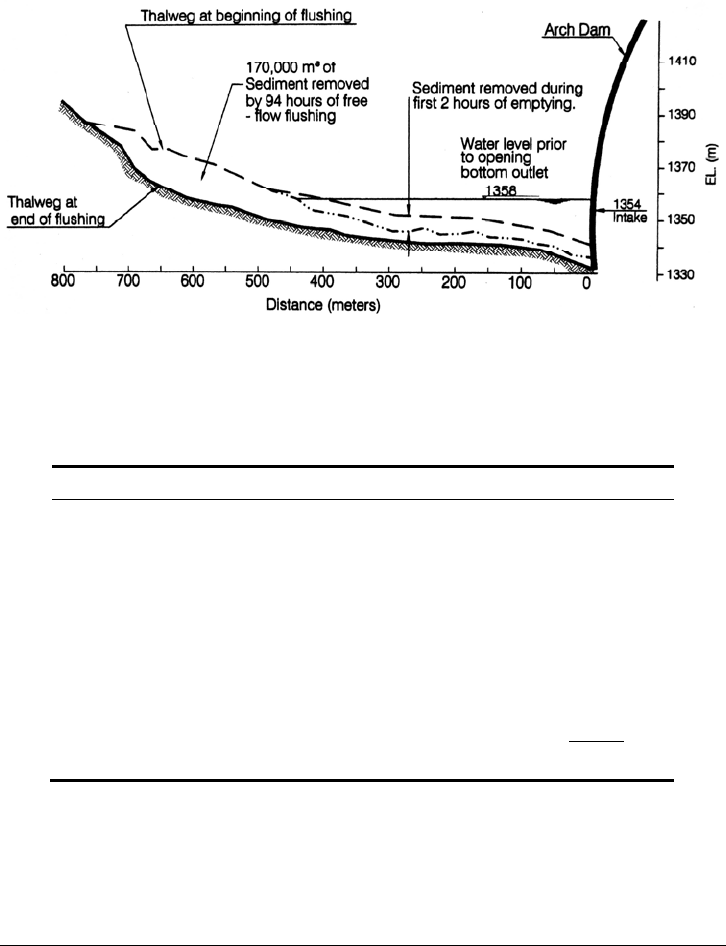
21.7). Different portions of the reservoir are eroded during the early and later parts of the
flushing, as illustrated in Fig. 21.8, which is based on photogrammetric surveys of the
reservoir during the flushing. A sediment balance based on monitoring at various points
is shown in Table 21.3, showing that much of the material flushed from the reservoir is
deposited in the gorge below the dam, and is not washed downstream until later in the
summer. A sand and gravel operator removes an unquantified volume of sediment from
the system for commercial use. The delta region of the reservoir may he experiencing the
gradual accumulation of material too large to be transported through the impounded reach
TABLE 21.2 Summary of Flushings at Gebidem Dam
Year
Water used,
10
6
m
3
Duration,
hours
Mean purge
flow, m
3
/s
Gate
operations
Solids removed,
10
6
m
3
Solids
concentration, %
1982 2.38 56 11.8 0 0.143 6.0
1983 3.38 48 19.6 2 0.175 5.2
1984 2.97 68 12.1 6 0.178 6.0
1985 2.50 49 14.2 0 0.150 6.0
1986 3.53 45 21.8 0 0.212 6.0
1987 3.20 45 19.8 13 0.192 6.0
1988 2.93 79 10.3 13 0.176 6.0
1989 2.49 49 14.1 1 0.150 6.0
1990 3.18 40 22.1 12 0.191 6.0
1991 2.35 96 6.8 0 0.270 11.5
1992 3.28 151 6.0 61 0.197 6.0
1993 2.48 101 6.8 ? 0.260 10.5
GEBIDEM DAM AND RESERVOIR 21.7
FIGURE 21.6 Discharge hydrograph and suspended sediment concentration at the outlet
from the dam during the 1991 flushing event (data from Electra Massa).
FIGURE 21.7 Cumulative sediment discharge from Gebidem dam during 1991 flushing even
t
(data from Electra Massa).
GEBIDEM DAM AND RESERVOIR 21.8
FIGURE 21.8 Thalweg profile upstream of Gebidem dam, 1991 flushing event, showing the
areas of sediment removal during different parts of the flushing period (data from Electra
M
assa).
TABLE 21.3 Sediment Balance, 1990-1991, Gebidem Darn
Parameter Volume, m
3
Annual sediment release, 1990-1991:
Sediment released by flushing (95.5 hours) 270,000
Sediment passing through turbines (12 months) 70,000
Fate of sediment flushed:
Deposited in gorge 81,000
Deposited in aggregate works 32,000
Delivered to Rhone 157,000
Delivered to Rhone by turbines (12 months) 70,000
Total 340,000
impounded reach by the low-discharge flushing flows. However, there are no data on the
long-term accumulation of coarse material in the delta area.
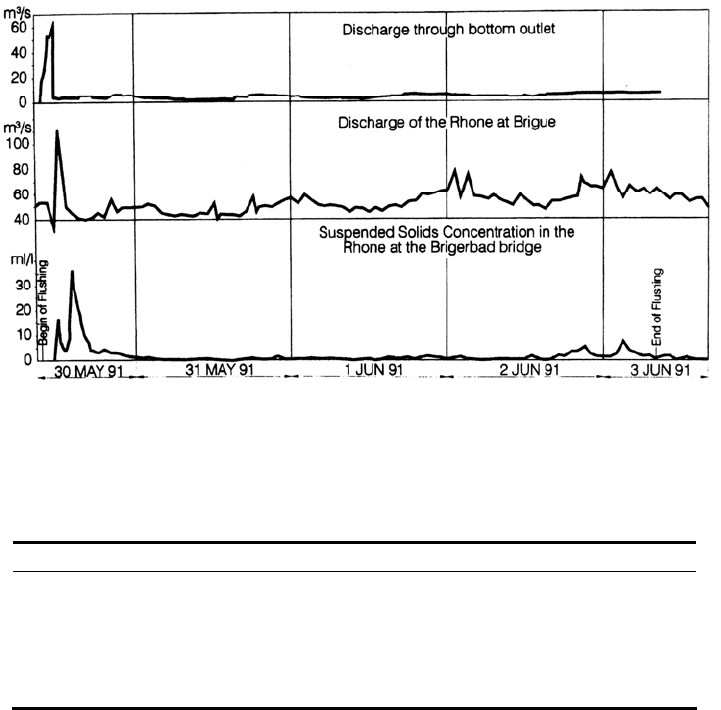
21.5 DOWNSTREAM IMPACTS
Discharge and suspended solids data from the Rhone River during the 1991 flushing
event are shown in Fig. 21.9. The same short-duration high-solids peak that occurs at the
dam is reflected in the Rhone data, but sediment concentrations are an order of magnitude
lower because of upstream deposition and dilution (Table 21.4). The peak sediment
concentration in the Rhone occurred during the initial flushing period, when the flushing
discharge of 60 m
3
/s exceeds the Rhone discharge of 50 m
3
/s. Thus, most of the reduction
in peak concentration is due to upstream sedimentation rather than dilution.
The combination of sediment release and reduced discharge due to diversion for
power production has heavily impacted the Massa gorge downstream of the dam. The
photograph of the gorge downstream of the dam in Fig. 21.10 shows both the constricted
GEBIDEM DAM AND RESERVOIR 21.9
FIGURE 21.9 Hydrographs and sediment concentration in the Rhone River during the 1991
flushing event (after Electra Massa 1992).
TABLE 21.4 Peak Downstream Sediment Concentrations during Flushing
Measurement point Time Concentration, g/L
Base of the dam 0915 450
Conveyance channel 1330 230
Rhone above Massa confluence 2
Rhone at Naters 1345 37
Rhone at Brigerbad bridge 1400 47
nature of the gorge reach and the deposition of fine sediment. After many years of opera-
tion without difficulty, during the 1990 flushing the conveyance channel became two-
thirds filled with coarse sediment, and during the 1992 flushing it became completely
filled. Seventy percent of the sediment deposited in the conveyance channel was sized
between 1 and 32 mm in diameter (Boillat, 1994), which is much coarser than the total
load of the Massa, of which only 20 percent consists of grains larger than 1 mm. The
massive deposition in the conveyance channel represents the coarsest part of the load.
which gradually accumulated along the length of the gorge over the years, and which also
probably deposited in the conveyance channel in smaller amounts during previous years
but went unnoticed. Massive deposition occurred once the gorge had reached a new
equilibrium condition with respect to the coarser sediment, and this coarse material was
exported in large quantities to the downstream conveyance channel.
According to Stutz (1967), physical modeling was used to design the conveyance
channel and analyze the effects of the localized sediment discharge on the Rhone. The
conveyance channel reportedly had adequate capacity and impacts on the Rhone were
insignificant. The volume of flushing flows used over the past decades have been as little
as half the volume considered for release under the original studies. Through both
physical and numerical modeling, Boillat (1994) concluded that the problem of
deposition could not be solved by modifying the channel, and recommended increasing
flows to increase transport capacity through the channel. Because of this problem the