Morris & Fan. Reservoir Sedimentation Handbook
Подождите немного. Документ загружается.

CACHÍ HYDROPOWER RESERVOIR, COSTA RICA 19.13
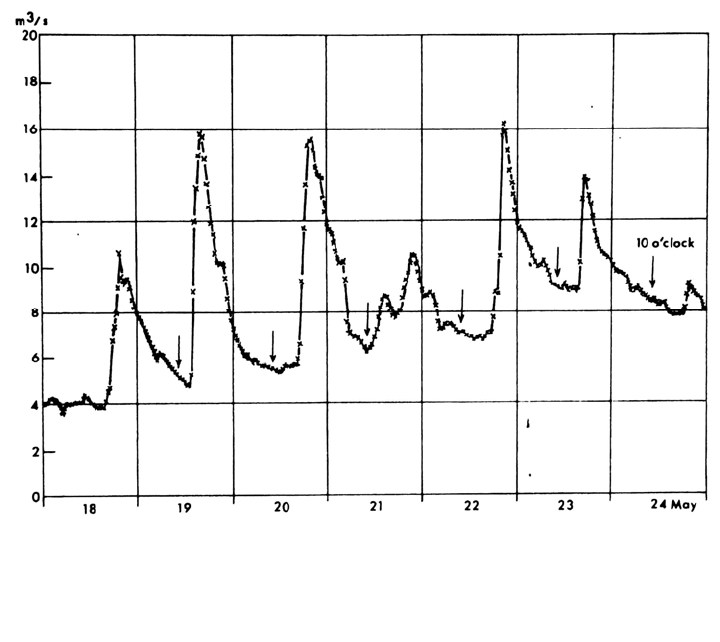
FIGURE 19.8 Discharge hydrograph at La Troya for 1 week. Peak discharges in this
watershed characteristically occur in the evening. Thus, suspended sediment samples collecte
d
around 10:00 each morning typically correspond to the falling limb of the hydrograph, when
sediment concentrations are lowest (Jansson, 1992a).
P
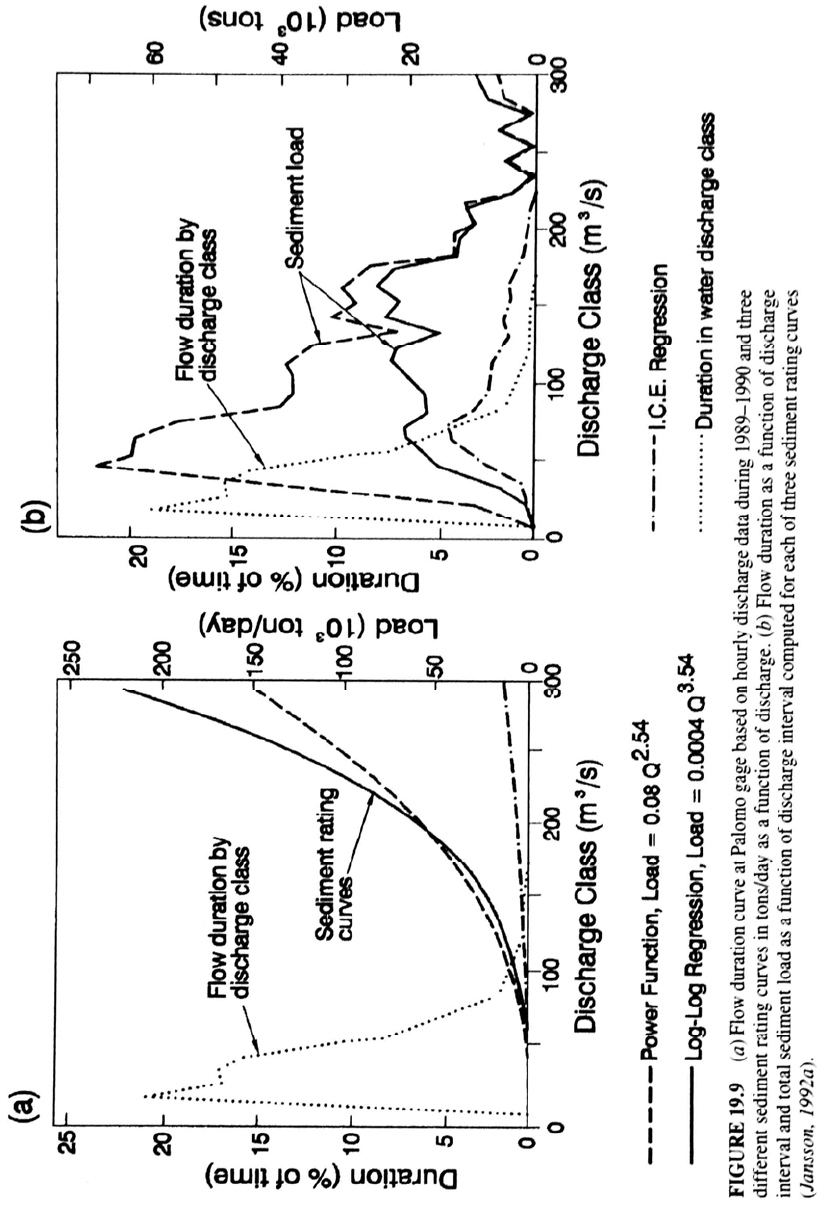
alomo gage as an example, hourly discharge data for 1989-1990 were divided into
10 m
3
/s discharge classes and analyzed to produce the flow-duration graph in Fig. 19.9.
The 10- to 20-m
3
/s discharge class was represented with the greatest frequency, but the 40-
to 50-m
3
/s class produced the greatest volume of water discharge.
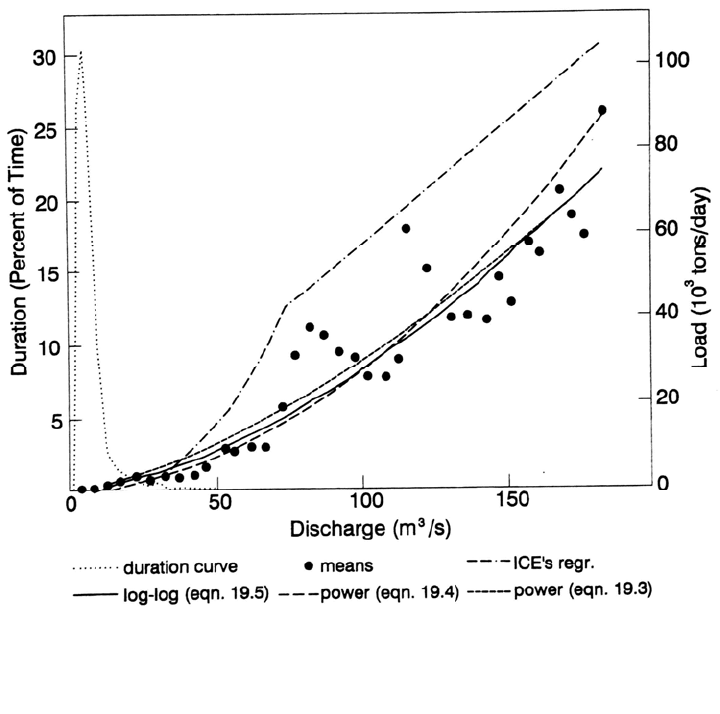
The three sediment rating curves shown in Fig. 19.9a were applied to the hourly
discharge data to estimate the relative importance of each discharge class with respect to
suspended sediment load, producing the values of sediment load in each class
summarized in Fig. 19.9b. Sediment loads were computed by applying the rating curve
to the mean discharge value within each water discharge class, and then multiplying by
the discharge duration for that class. Despite the large difference in sediment loads at peak
discharges given by the three rating curves, this has relatively little effect on the total
sediment load because the highest flows occur infrequently. Sediment load
computations at Palomo are most sensitive to discharges in the range of 30 to 200 m
3
/s, and
particular attention must be given to accurately fitting the sediment rating curve within
this range.
19.3.6 Turbidity Measurement
Intensive sampling was conducted during the 1989-1990 inter-flushing period to
generate a representative dataset for computing new sediment rating curves. Given the
difficulty of collecting representative suspended sediment data from small watersheds
CACHÍ HYDROPOWER RESERVOIR, COSTA RICA 19.14
CACHÍ HYDROPOWER RESERVOIR, COSTA RICA 19.15
with fast-rising peaks, turbidimeters were used to continuously record sediment
concentration. Two types of turbidimeters were used, the Hach Surface Scatter 6
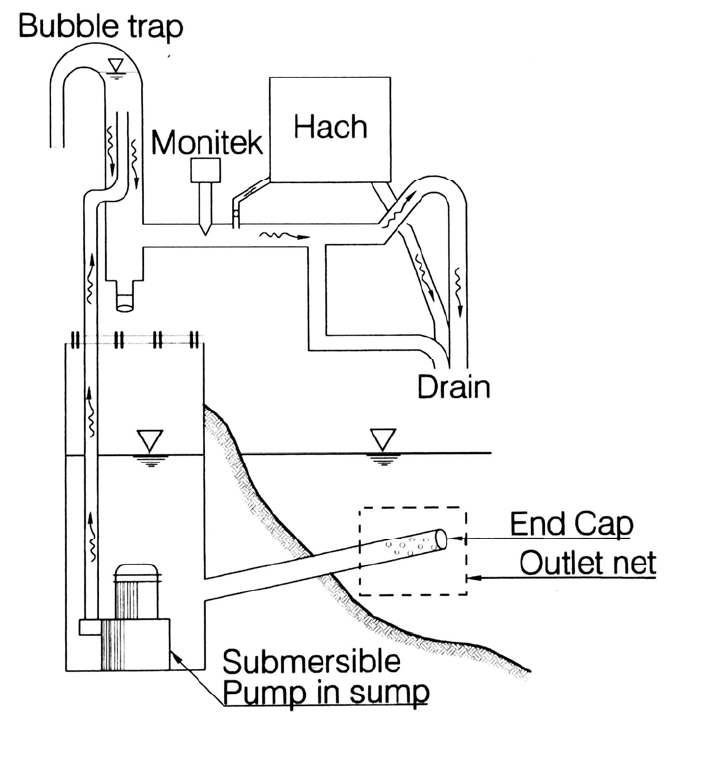
turbidimeter and the Monitek Clam 52 LE. Submersible pumps were used to deliver
water to the turbidimeters (Fig. 19.10). Data were collected by data loggers at
intervals of approximately 5 to 6 minutes and analyzed with an electronic
spreadsheet. Both types of turbidimeters experienced problems with clogging by
heavy sediment loads and debris, failure of pumps and transformers, and other
logistical problems. The Hach instrument, with its smaller water delivery tube, was
more prone to clogging by leaves and the husks of coffee beans discarded to the
river during coffee harvest season. The larger interior chamber in the Monitek
instrument was less prone to clogging, but produced low flow velocities that allowed
sediment to settle out at high concentrations (e.g., in measuring sediment concen-
trations downstream of the dam during flushing).
The turbidimeters were calibrated (NTU versus suspended solids) by using
suspended sediment data collected from the stream over a range of discharges while the
turbidimeters were operating. A power function regression was developed for the
Hach instrument having the form:
Concentration = 0.59 NTU
1.30
(19.1)
FIGURE 19.10 Sample collection arrangement for turbidity monitors (Jansson, 1992a).

CACHÍ HYDROPOWER RESERVOIR, COSTA RICA 19.16
The calibration curve for the Monitek instrument was of the form:
Concentration = 1.22 PPM + 71 (19.2)
where PPM is the Monitek instrument reading.
Because the instruments continuously report turbidity values, even though these
values may be spurious, it was necessary to scan the data for reasonableness to search for
periods of clogging. Sudden declines in turbidity, or periods when turbidity remained
essentially stable despite significant changes in discharge, were taken as signals of
clogging. For example, Fig. 19.11a shows a short-duration turbidity spike at Palomo
which produces an open discharge-concentration loop. This could be caused by high
sediment discharge from an area near the gage station (e.g., farms) with little sediment
contribution from the upper watershed. It could also be caused by clogging of the
turbidimeter intake during the event. Because these events with extremely short turbidity
peaks seemed to occur primarily during the coffee processing season, and were otherwise
atypical, it was thought to represent a period of spurious readings due to clogging of the
turbidimeter, and these data were discarded. Figure 19.11b shows a more typical event
at this same gage station.
At La Troya, the turbidity at low flows was affected by waste discharge from an
upstream factory and by in-stream mining, both of which caused turbidity spikes with no
increase in discharge. To avoid the irregular turbidity readings caused by waste
discharges and mining, the sediment rating curve at La Troya was constructed by using
data only from the rising and falling limbs of hydrographs when sediment concentrations
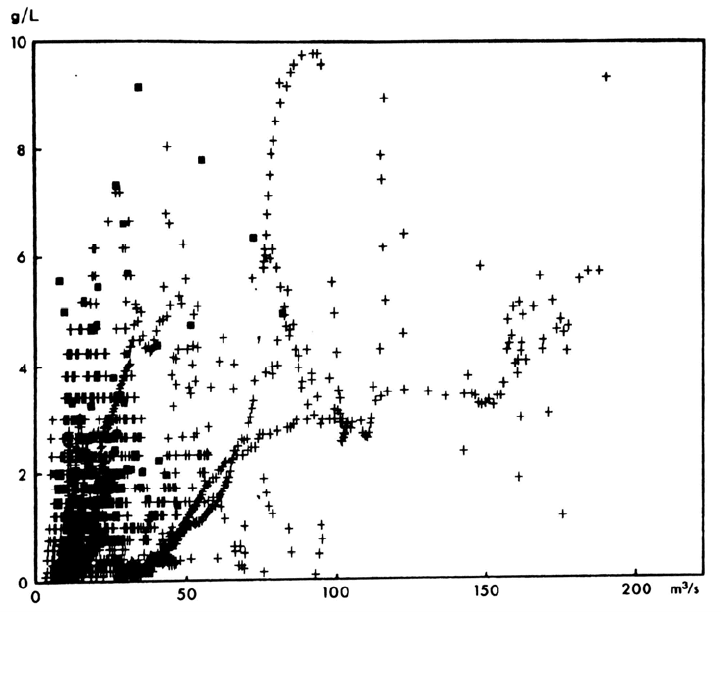
exceeded 1000 mg/L. The resulting dataset at La Troya contained 5763 data points at 6-
min intervals, representing 23 different runoff events between September 1989 and October
1990 (Fig. 19.12). At La Troya gage the discharge peaks typically preceded the turbidity
peak, generating a counter-clockwise loop and a high degree of scatter in the dataset At
Palomo the opposite pattern was observed; the highest turbidities occurred on the rising
limb creating a clockwise loop.
19.3.7 Interpretation of Turbidity Data
The correlation of turbidity data to suspended solids is problematic. The relationship
varies as a function of the monitoring site, stage, type of instrument, calibration, grain
FIGURE 19.11 (Left) Short-duration turbidity spike at Palomo gage station which creates an ope
n
discharge-concentration loop, probably caused by clogging of the turbidimeter during coffee
harvest season. (Right) More typical discharge-concentration relationship at Palomo outside
of coffee harvest season when clogging is not a problem (Jansson, 1992a).
CACHÍ HYDROPOWER RESERVOIR, COSTA RICA 19.17
FIGURE 19.12 Concentration versus discharge dataset at La Troya based on turbidimeter
measurements and used to construct sediment rating curves. In places the traces of rising or falling
ydrographs from individual events are discernible (Masson, 1992a). h
si
ze distribution, and other parameters. Furthermore, turbidimeters collect point samples
and the relative depth of the fixed measurement point will vary as a function of stage. It
was intended to continuously measure both streamflow and turbidity, and compute the
sediment load by using a correlation between suspended solids and turbidity. However,
numerous field problems intervened and the turbidity record was far from complete,
making it necessary to construct a rating curve from the turbidity data. Despite
problems and limitations, continuous turbidity measurements were obtained from both
the rising and falling limbs of several hydrographs, and these data provided a more
representative dataset than the water quality sampling program with its population of data
points taken mostly from the falling limb.
To evenly distribute the regression weighting factor across the full range of the
available data, the dataset was divided into 2-m
3
/s discharge intervals and the mean value
of the concentration data points falling within each discharge class was computed. Three
rating curves were computed from these means. A power regression on the mean values
gave:
(19.3)
91.1
10.4 QL
The ot
her two equations were developed after discarding the mean value for the highest
discharge class in the dataset, since it contained only one observation. After removing the
highest data point the power regression on the means became:
CACHÍ HYDROPOWER RESERVOIR, COSTA RICA 19.18
(19.4)
51.1
77.28 QL
A l
og transformation of the means, a log-log regression, gave:
(19.5)
645.1
18.14 QL
In
these equations L = sediment load in tons/day and Q = water discharge in m
3
/s.
The resulting sediment rating curves at La Troya are shown in Fig. 19.13, along with
the mean load values in each water discharge class. Table 19.5 compares the load
computed by each equation against the load computed using the 5763 points in the original
dataset, and also shows the total load for the 1980-1990 period computed by each
equation. This table illustrates the importance of equation-selection on the load
computations.
A similar procedure was followed to develop a rating curve at Palomo which had
6140 data points representing the rising and falling limbs of 22 distinct and significant
runoff events, plus several low-flow intervals between individual events. The longest
continuous record was a 10-day period in October. Data from this station were affected
by periodic releases from the El Macho upstream hydropower station, which increased
discharge with no corresponding increase in turbidity. Two sediment rating equations
were developed from the means, a power function and a log-log regression. The two
equations were first tested by comparing the total sediment load predicted by the
FIGURE 19.13 Sediment rating curves at La Troya based on turbidity data. Each circle is the mean
for a discharge interval (Masson, 1992a).

CACHÍ HYDROPOWER RESERVOIR, COSTA RICA 19.19
TABLE 19.5 Sediment Load Computed by Various Rating Curves Applied to Original
Dataset from which the Equations Were Derived, and for the 1989-1990 Period
Load computed for dataset
Power
[Eq. (19.3)]
Power
[Eq. (19.4)]
Log-log
[Eq. (19.5)]
ICE's
equation
Load for original dataset*:
Tons 47,846 69,132 57,243 78,612
% of ICE equation 61 188 73 100
Load for 1989-1990 inter-flushing period:
Tons 167,241 312,421 238,695 222,047
% of ICE equation 75 141 107 100
*The load computed from the dataset values was 57,667 tons.
equations against the measured load in the dataset. At this station there were some
manually collected water quality data at very high water discharges, which were much
lower than the sediment load values predicted by the rating curves. Therefore, these
additional data points were added to the record obtained by the turbidimeter to augment
the sparse record at high discharges and the regressions were recomputed. The log-log
regression fit the data very well, except that it appeared to overestimate values at higher
discharges. Therefore, an eye-fitted line was used for discharges over 206 m
3
/s.
19.3.8 Unsampled Area
The soils, drainage density, and land use indicated that the sediment yield from the
unsampled area near the reservoir would probably be similar to the yield from the
watershed tributary to the La Troya gage station. Therefore, the sediment discharge from
the ungaged area was based on the sediment yield at La Troya with a correction for
watershed area.
19.3.9 Conclusions Concerning Sediment Inflow
The original ICE equation provided a reasonable estimate of the sediment load at the La
Troya gage station. However, the load at the Palomo gage was seriously underestimated
at discharges over 100 m
3
/s, and this was the primary factor responsible for the large
discrepancy in the sediment balance across the reservoir. At Palomo the rating curve had
a clockwise loop, meaning that suspended sediment concentrations on the rising limb
were much higher than on the falling limb, which provided most of the data points for the
original rating curve. The original sediment rating curve had been derived from a
nonrepresentative dataset.
19.4 SEDIMENT DEPOSITION AND EROSION
Various procedures were used to quantify the amount and pattern of sediment deposition
and erosion within the reservoir.
CACHÍ HYDROPOWER RESERVOIR, COSTA RICA 19.20
19.4.1 Sedimentation Plates
In 1976, ICE set out five sedimentation plates in different parts of the reservoir and
returned in subsequent years to measure deposition depth over each plate. From this,
deposition was computed by apportioning the reservoir area among the plates with
Theissen polygons. In 1981, additional plates were set out, for a total of 39 measurement
points. However, as burial depth increased the plates became more difficult to find,
resulting in lost plates and incomplete data.
19.4.2 Topographic Survey
In June 1985, the reservoir was emptied for 15 days and a survey crew mapped the
topography of the flat terraces and measured total sediment depth. It was estimated that
1.03 Mm
3
of sediment had accumulated on 1.027 km
2
of terraces in 19 years of
impounding, for an average deposition depth of 1.0 m.
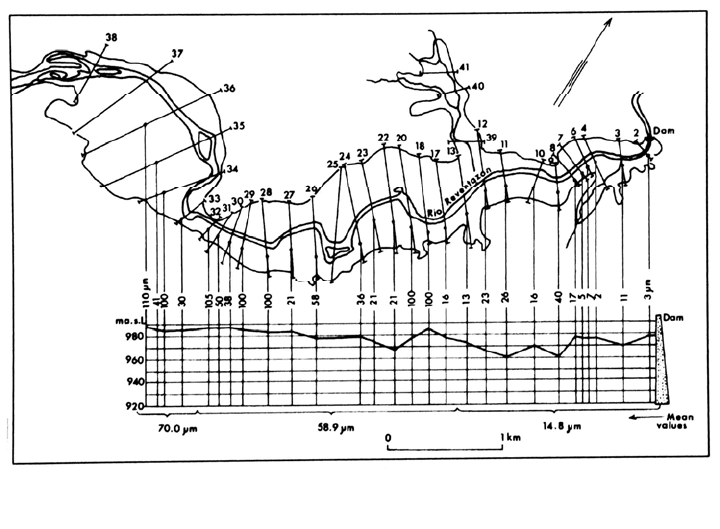
19.4.3 Grain Size Analysis
Twenty-eight samples of surface sediment were collected from the right-hand terraces
when the reservoir was emptied in 1983, and grain size was determined by the
densitometer method (ASTM-D422). The results, summarized in Fig. 19.14, show that
grain size on the terraces declined moving downstream, from an average of 0.70 mm in
the upper basin to less than 0.015 mm near the dam. The main channel was not sampled.
qq
FIGURE 19.14 Elevation and median grain size of sediments on the surface of right-hand terraces
(Ramírez et al., 1992).
CACHÍ HYDROPOWER RESERVOIR, COSTA RICA 19.21
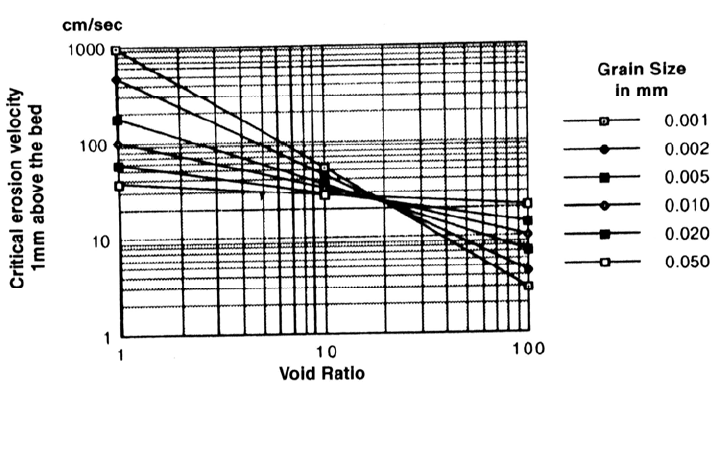
FIGURE 19.15 Preliminary calculated relationship between critical erosion velocity and voi
d
ratio as a function of grain size (Axelsson, 1992).
19.4.4 X-Ray Analysis
Reservoir sediments were analyzed by x-ray radiographic techniques (Axelsson, 1992)
using 15 shallow cores (0.2 to 0.5 m deep) collected with a valved gravity corer plus nine
surficial grab samples. Rectangular cores, 30 × 60 mm, were collected, since either square or
rectangular cores of uniform thickness are required for quantitative interpretation of
radiographic images. Unextruded cores with adjoining bottom water were transported, stored,
and then irradiated in the upright position at a laboratory in San José, Costa Rica. A
seven-step aluminum wedge was irradiated simultaneously with the cores for density
calibration.
The x-ray image density varies as a function of the density of the material in the core.
Flushing and air drying exposes the soft sediment to desiccation, creating an alternating
sequence of denser surface crusts sandwiched between softer subcrustal material. By
taking cores at intervals of months or years, and by correlating the sedimentary sequences
between cores, it is possible to determine contemporary rates of sedimentation. However,
only one set of cores was available at Cachí, and sediment accumulation rates could not be
determined by radiography because the sediment sequence could not be correlated over
time.
Air drying of the sediment and formation of a surface crust during drawdown sub-
stantially reduces the erodibility of the sediments. Axelsson developed from a variety
of sources a preliminary relationship between critical erosion velocity and void ratio in the
sediments, as related to grain size (Fig. 19.15). Void ratios in Cachí reservoir ranged from
20 in gas-rich organic layers to less than 2 in the hard crusts formed on exposure during
flushing. Newly deposited silt and clays at Cachí had void ratios often exceeding 5.
19.4.5 Side-Scan Sonar
Dual-frequency (104 and 435 kHz) side-scan sonar in conjunction with an electronic
positioning system were used to produce a side-scan sonar mosaic of the entire lower
portion of the reservoir (Erlingsson, 1992a). The survey was accomplished by making
three passes along the axis of the reservoir on three parallel tracks 150 m apart. The
strength of the reflected side-scan sonar signal causes gray-scale differences in the sonar-
CACHÍ HYDROPOWER RESERVOIR, COSTA RICA 19.22
graph images, and the resulting sonargraph is a 16 gray-scale map which reflects both
bottom topography and bottom material. Factors that influence signal strength include
angle of incidence, grain size of the bottom material, mineral composition,
porosity, gas bubbles in the sediment, and bottom flora and fauna. A single track in the
shallow water in the upper portion of the reservoir was made without the positioning
system, but the return signal strength was extremely weak because of the coarse-grain
material.
Hydrogen sulfide (H
2
S) gas bubbles are formed in the sediments by the
anaerobic decomposition of organic matter. Cachí sediments are relatively high in
organic material, with loss-on-ignition values averaging about 4 percent and reaching
10 percent in soft sediments. These organics are derived primarily from hyacinth and
lake plankton detritus. The warm temperatures in this tropical reservoir accelerate the
rate of organic decomposition and the formation of gas bubbles. The bubbles create
sharp density interfaces within the sediments, strongly scattering acoustic signals. Boat
traffic can also generate acoustic noise that interferes with sonar, and at Cachí (where
there was no boat traffic) the sonar sometimes picked up strong acoustical interference
from the hydropower plant.
The bottom characteristics at a number of locations were known from the sediment
cores, making it possible to correlate the following bottom conditions against gray-scale
units on the sonargraph: median grain size, wet bulk density (related to porosity), and
depth to visible gas in the x-ray films of the cores. Through a series of regression
correlations, it was determined that variation in grain size was the most important
gray-scale parameter, giving a correlation coefficient of R
2
= 0.71 for an exponential
regression. Finer sediments gave a stronger echo (darker image). Variations in wet
bulk density and gas content were poorly correlated to gray-scale value. Bottom flora
was absent in the reservoir (water hyacinths float on the surface) and tube worms were
present at very few locations, so biotic factors were ignored. Organic detritus caused
low wet bulk density values.
In the sonargraphs, it was found that the thalweg generally became darker in the
downstream direction, interpreted as a decrease in grain size and wet bulk density. The
sonargraph showed a dark gray meander along the thalweg, interpreted as a zone
of deeper sediment deposition by turbidity currents. Despite small grain size,
terraces showed lighter gray-scale values, interpreted as reflection from gas within 15
cm of the sediment-water interface and signal attenuation by deposits overlying the
gas layer.
19.4.6 Subbottom Profiler
The higher frequency sonar is reflected strongly in the immediate vicinity of the water-
sediment interface, thereby registering the bottom of the reservoir. The lower-
frequency (14 kHz) subbottom profiler signal penetrates farther and is reflected
from boundaries within the sediment deposit, plus backscatter within the sediments.
When a subbottom profiler is used in a reservoir, the three principal boundaries of
interest are (1) the sediment-water interface, (2) the boundary between the surface crust
formed by desiccation during the most recent drawdown (flushing) and the overlying
recently deposited material, and (3) the boundary between the original bottom and
the material deposited since impoundment. Deposition depth is determined as the
difference between these boundaries. Because of the presence of gas, the acoustic
signals penetrated to only about 10 cm, even in the thalweg where deposition depth
was known to be much deeper. This abundance of gas made it impossible to obtain
usable readings of deposition depth by acoustic methods.