Morris & Fan. Reservoir Sedimentation Handbook
Подождите немного. Документ загружается.

CACHÍ HYDROPOWER RESERVOIR, COSTA RICA 19.3
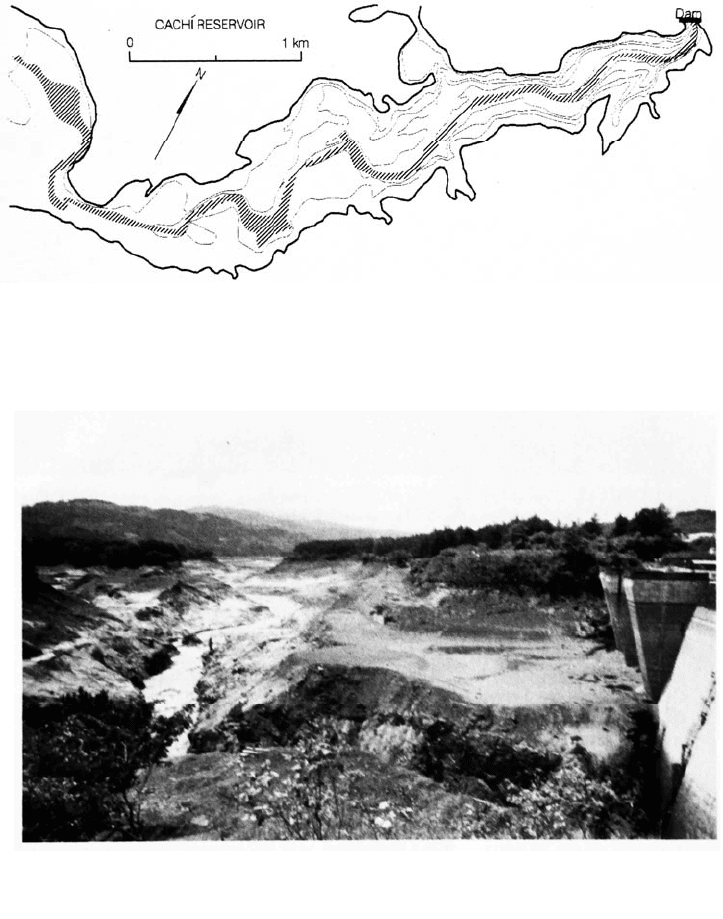
FIGURE 19.2 Bathymetric map of Cachí reservoir lower basin with contour lines on 10-
m
intervals (Erlingsson, 1992b).
FIGURE 19.3 Photograph of empty Cachí reservoir during flushing looking upstream from the
dam, showing channel and river terrace near the dam (G. Morris).
s
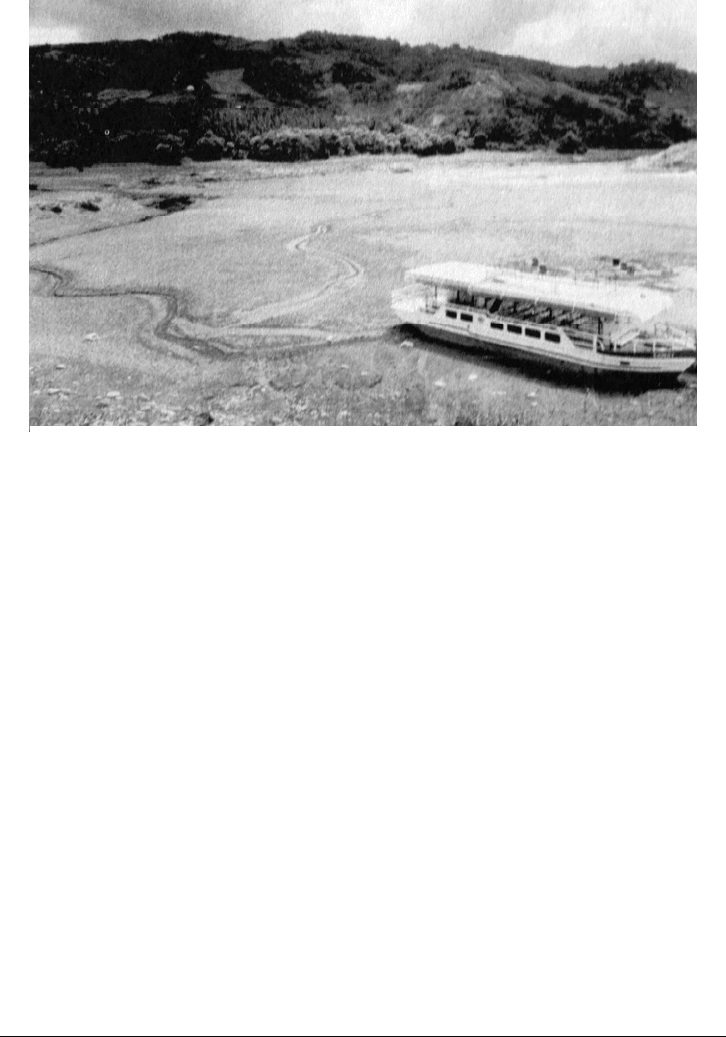
ide. Figure 19.4, a photograph of the lower portion of the pool looking upstream from the
reservoir’s right-hand bank, illustrates the configuration of the broad flat terrace that is
normally submerged.
The reservoir has an extensive growth of water hyacinths (Eichornia crassipes), a
floating macrophyte that can exceed 0.5 m in height and forms a dense floating mat
across the water surface. ICE personnel indicated that prevailing winds usually
pushed the hyacinths into the lake's upper basin, and, during the 1990 flushing most of
the upper basin surface outside the active channel was covered with hyacinths trapped there
by the falling water level. Hyacinths were largely absent from the main (lower) basin.
CACHÍ HYDROPOWER RESERVOIR, COSTA RICA 19.4
FIGURE 19.4 Photograph of left side of Cachí reservoir during flushing showing
broad flat terrace. The main flushing channel is in the background at a lower level and is
barely discernible (G. Morris).
19.1.2 Hydrology
The dam controls 785 km
2
of the upper Río Reventazón watershed. The watershed is
mountainous and rainfall varies from 1500 to 7000 mm/yr, generally increasing with
elevation. Precipitation is well-distributed throughout the year, with September
and October being the wettest months. At the Cachí station the diurnal temperature
ranges typically from 14 to 27°C with about a 3° variation in the average monthly
temperature between the coldest and hottest month. Watershed soils are derived
primarily from volcanic ash, with sedimentary deposits found on valley floors. As a
result of humid conditions the watershed is heavily vegetated. About 55 percent
of the watershed is forested, primarily at higher (more moist) elevations and on
steep slopes. Another 43 percent is divided about evenly between pasture and crops.
The principal crop is coffee, covering almost 10 percent of the watershed, with
sugar cane and vegetables covering most of the remaining crop acreage. Urban uses
account for 1.3 percent of total land use.
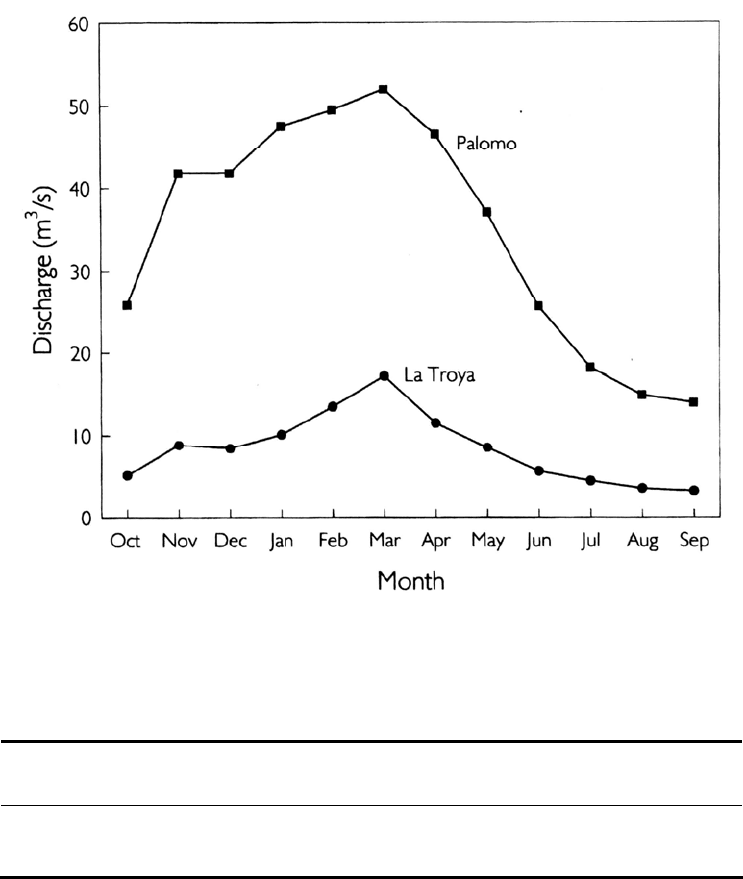
Two hydrologic stations, La Troya and Palomo on the Río Navarro and Río
Reventazón respectively, gage 82 percent of the watershed tributary to the dam. Runoff
station data are summarized in Fig. 19.5 and Table 19.1.
19.2 FLUSHING
19.2.1 Operational Procedures
The power intake at Cachí Dam is located near the original riverbed elevation. A portion
of the suspended load entering the reservoir is transported by turbidity currents to
the area of the dam, and within several years of construction, sediments accumulating
CACHÍ HYDROPOWER RESERVOIR, COSTA RICA 19.5
FIGURE 19.5 Mean annual runoff at the two streamgage stations tributary to Cachí reservoir.
Period of record is August 1971 through August 1990 (after Ramírez et al., 1992).
TABLE 19
.1 Summary Characteristics of Streamgage Stations
Station
Drainage
Area
Km
2
Mean
annual runoff
M
3
/3
Mean
Runoff Depth
mm/yr
Peak
Discharge
M
3
/3
Min
Discharge
M
3
/3
La Troya
274.6 8.5 976 340 1.6
Palomo
371.1 34.4 2920 593 5.4
near the dam began to be drawn into the turbines and interfere with hydropower
production.
The reservoir was emptied for the first time in October 1973 to flush the accumulated
sediments through the bottom gate, which was located immediately adjacent to the
intake screen (Fig. 19.6). Because of the success of the first flushing operation, it was
decided to repeat this operation every year during the wet season when the reservoir
could be refilled quickly, and from 1973 to 1990 the reservoir was flushed 14 times.
Flushing occurs in three stages: slow drawdown, rapid drawdown, and free flow.
During the slow drawdown period the reservoir level is lowered from 990 m to 965 m
at the rate of 1 m/day, with turbines operating at full capacity. If inflow is too large to
achieve the drawdown schedule by turbine flow alone, the discharge is augmented by
CACHÍ HYDROPOWER RESERVOIR, COSTA RICA 19.6
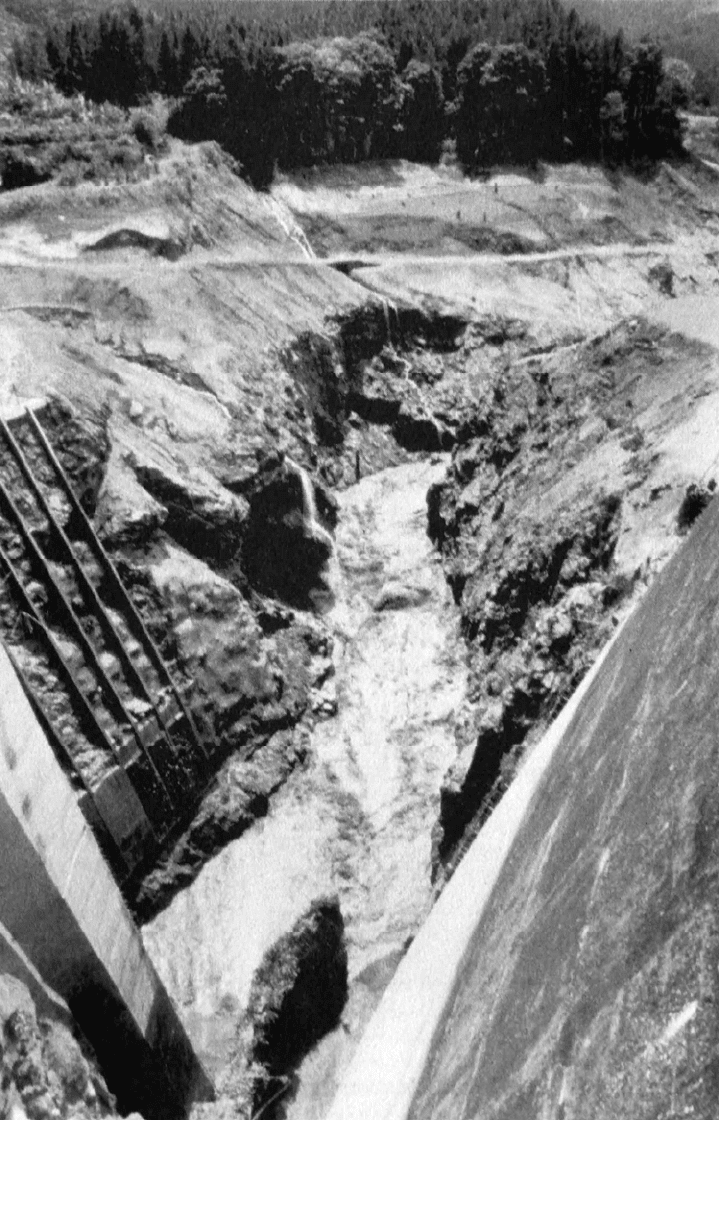
FIGURE 19.6 View from the darn during flushing looking down on the flushing channel
and power intake at Cachí reservoir. The intake is located adjacent to the thalweg in an area
affected by turbidity currents. This location facilitates sediment removal from in front o
f
the intake during flushing, as shown (G. Morris).

CACHÍ HYDROPOWER RESERVOIR, COSTA RICA 19.7
opening the crest gates when water levels are above the spillway crest, or opening the
bottom outlet at lower water levels.
When the water level reaches 965 m, the turbines are stopped and the bottom gate is
opened to initiate the rapid drawdown phase and evacuate the remaining water from the
reservoir, a process which may require 5 to 10 hours. This is followed by the free-flow
phase, which occurs when the pool has been completely drawn down and the river flows
freely along the original river channel and through the bottom outlet. Free flow typically
lasts 2 to 3 days, and during this period inspection and maintenance is performed on the
power tunnel and other facilities. The bottom gate is then closed and the reservoir is
refilled to the 990 level, which requires 16 to 21 days depending on inflow and power
generation requirements.
The amount of sediment released in each stage of flushing varies widely from one
event to another (Table 19.2), reflecting year-to-year variation in sediment inflow and
accumulation along the flushing channel, different periods between flushing events,
flushing duration (as long as 15 days in one year because of maintenance requirements),
and operation of the bottom gate during drawdown. The power intake is at a higher
elevation than the bottom outlet, and when drawdown occurs through the turbines
relatively little sediment is evacuated during the drawdown phase. However, when high
inflow requires the use of the bottom outlet to maintain the drawdown schedule, more
sediment is released during drawdown. Thus, use of the bottom outlet during drawdown
increases sediment release during this phase.
During the drawdown period, sediment deposits in the upper portion of the reservoir
are scoured and transported downstream, where they become redeposited within the still-
submerged portion of the river channel. As water levels continue to decline, this
material is again exposed to scour and is transported closer to the dam. During a
flushing event, an individual particle may be scoured and redeposited several times
before reaching the dam.
TABLE 19.2 Tons of Sediment Released by 14 Flushing Events at Cachí Reservoir, by
Flushing Stage
Date
Slow
drawdown
Rapid
drawdown
Free flow Total flushing
October 1973 nd nd nd nd
August 1974 186,200 225,200 nd (411,400)
October 1975 nd nd nd nd
October 1977 nd 40,700 44,000 (84,700)
May 1980 nd 19,500 5,000 (24,500)
October 1981 14,600 348,900 113,400 476,900
October 1982 5,800 111,600 250,900 386,300
September 1983 28,700 402,400 114,300 545,400
October 1984 23,300 604,600 32,600 665,500
June 1985 nd nd nd nd
July 1987 nd nd nd nd
September 1988 61,600 627,000 577,100 1,265,700
September 1989 42,400 144,300 295,500 482,200
October 1990 27,200 278,700 347,100 653,000
nd = no data. The data in parentheses are estimates.
Source: Ramírez and Rodríguez (1992).
CACHÍ HYDROPOWER RESERVOIR, COSTA RICA 19.8
Scouring of sediment from the upper reaches of the reservoir and redeposition within
the submerged river channel near the dam during the slow drawdown period creates a
large supply of relatively fine sediment that is released as a slug of highly concentrated
flow when the reservoir is fully emptied by opening the bottom gate for rapid draw-
down. Peak sediment concentrations exceeding 400 mg/L have been measured down-
stream of the dam, occurring at the end of rapid drawdown and the beginning of the free
flow phase, when riverine flow scours deposits near the dam. Extremely high suspended
sediment concentration also makes this the period of maximum sediment evacuation.
Even though rapid drawdown and free flow typically last more than 48 hours, about half
the sediment release occurs in only 4 hours.
The suspended sediments released from the dam continue downstream and into the
Caribbean Sea, forming a plume of turbid fresh water overlying the seawater. No studies
have been undertaken on the effect of the sediment on downstream biology, but anecdotal
information from Costa Rican observers indicates that the concentrated sediment release
causes extreme mortality to all types of river biota.
19.2.2 Sedimentation Studies at the Reservoir
To construct a sediment budget for the reservoir, suspended-sediment data have been
collected since 1972 by ICE at both the La Troya and Palomo gage stations upstream of
the reservoir, and during flushing events intensive sampling was made at the El Congo
station several kilometers downstream of the dam. The river passes through a steep
narrow gorge between the dam and El Congo and there is little opportunity for either
gain or loss of suspended sediment along this reach. Thus, the suspended-sediment data at
El Congo is considered representative of the material released from the dam.
The ICE manual sampling program was based on depth-integrated water samples
collected from verticals at each of the three stations using a USD 49 sampler operated
from a funicular carriage. The samples were analyzed separately by drying at 110°C on
24-mm glass fiber filters in perforated porcelain crucibles, and the mean sediment
concentration was computed. Sediment release during flushing was computed from
suspended sediment measurements taken at intervals of 1 hour or less at the El Congo
gage. At all gage stations, the bed material consisted of cobbles and bed load was not
measured at any station.
Suspended sediment samples at the two upstream gages were collected frequently
soon after the gage station was installed, but afterward sampling frequency declined to
once or twice a month. More important, there were few data from high-inflow events.
Sediment samples at the two inflow stations were used to develop sediment rating
curves, the mean sediment concentration being converted into tons per day of sediment
load according to the instantaneous discharge. The sediment load was plotted against
instantaneous discharge on log-log paper and a straight line was fitted by eye. The
annual load was computed by applying this rating curve to the series of mean daily
discharges at each station. However, when the sediment inflow measured at the two
upstream gage stations was compared against the sediment discharged during flushing at
the downstream El Congo station, it was found that sediment discharged by flushing was
typically 3 to 4 times larger than the estimated long-term sediment inflow, clearly an
impossibility. Measurements at the El Congo station downstream of the dam were
essentially continuous during flushing events and were considered accurate. Because
flushing events lasted only a few days and were adequately sampled, the problem
appeared to lie with underestimation of the inflowing load.
The problem with the sediment balance, coupled with ICE's interest in developing
more detailed information on the sediment dynamics of the system and the possibility of

CACHÍ HYDROPOWER RESERVOIR, COSTA RICA 19.9
improving management of the reservoir flushing, led to the collaborative research effort
between ICE and the University of Uppsala. Several types of studies were
undertaken.
1. Sediment inflow. Historical suspended sediment data were analyzed to
determine the accuracy of the sediment rating curves. During 1989-1990, an
intensive data collection program was undertaken, including the use of recording
turbidimeters, to improve the database for estimating the inflowing sediment
load.
2. Deposition and erosion patterns. Patterns of sediment deposition in the
reservoir were analyzed from air photos, historical measurements of
sedimentation plates, x- ray radiographic analysis of sediment cores, side-scan
sonar, subbottom profiling, and repeated depth soundings.
3. Sediment flushing. The October 1990 flushing event was observed and
sediment release was measured by water sampling and turbidimeters.
4. Sediment budget. Data collected during 1989-90 were used to construct a
detailed sediment budget across the reservoir for a one-year period.
5. Synthesis. A generalized theoretical and mathematical model for
sedimentation processes in reservoirs was presented (Sundborg, 1992b),
illustrated by data from Cachí.
19.3 SEDIMENT INFLOW
Historical data were reanalyzed and additional data collection was undertaken to better
define the inflowing sediment concentration, as reported by Jansson (1992a).
19.3.1 Rating Curve Analysis
Several types of problems could be responsible for underestimating the inflowing load
into Cachí Reservoir. One possible problem was that sediment rating curves fitted
by eye did not correctly represent the gage station dataset. The existing datasets
from each of the two inflow gage stations were analyzed by fitting the following
types of least squares regressions:
Regression on the logs of all individual values.
Regression of logged means. The mean sediment load was determined for
discharge intervals and a regression was run on the logs of these means. The ICE
samples were collected at regular timewise intervals, resulting in numerous
sediment samples at low flows and very few at high flows. The data were
also highly scattered. Replacement of multiple datapoints within each
discharge interval by a single mean value reduced the apparent scatter in the
dataset, and also eliminated the influence of the numerous low-flow data points
on the shape of the overall regression curve, since numerous low-flow datapoints
were replaced by a single value for the mean in each discharge class.
Two regressions, on either individual values or means. Because the
relationship between discharge and sediment load appeared discontinuous, two
separate regression equations were developed for low and high discharge
CACHÍ HYDROPOWER RESERVOIR, COSTA RICA 19.10
values to improve the fit to the data. The transition point from one equation to
another was selected by eye.
Power function regression on all values.
Power function regression on means.
Two power function regressions on either individual values or means.
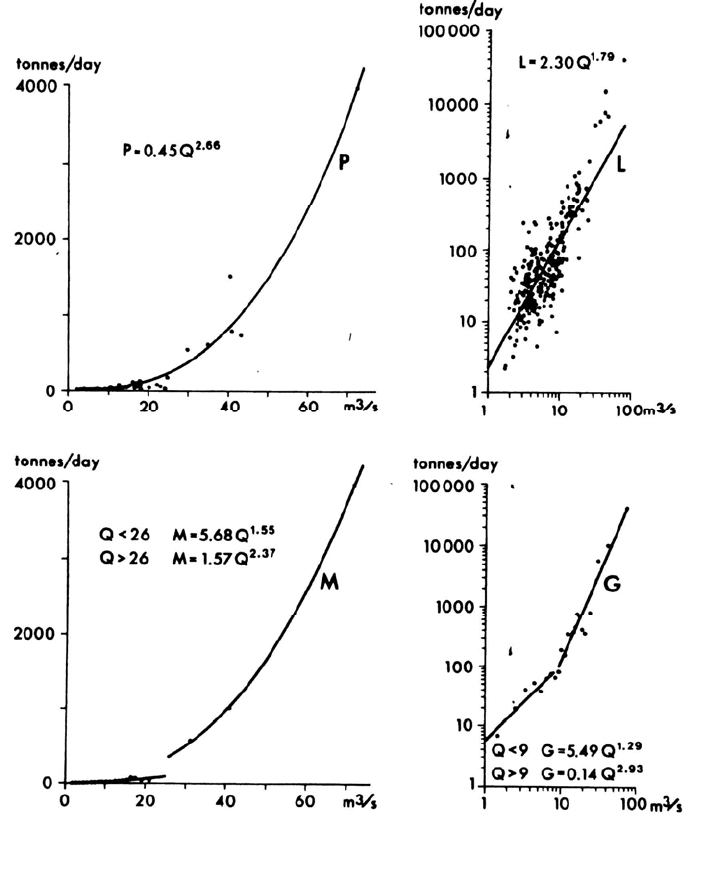
Some of the resulting curves are illustrated in Fig. 19.7.
The goodness of fit for these datasets cannot be determined by the regression
coefficient. First. a regression coefficient on the logged variables says little about the
correlation for the unlogged variables. Furthermore, in a sediment rating curve,
the data points at higher discharges are more important (and typically less
numerous) than the data points at low discharge values. The more numerous data points
FIGURE 19.7 Several types of sediment rating curve equations derived at the La Troya statio
n
on Río Navarro (Jansson, 1992a).

CACHÍ HYDROPOWER RESERVOIR, COSTA RICA 19.11
at low discharge can weight the least square regression so it does not adequately represent
the higher discharge values.
To determine the goodness of fit, the total load was computed by assigning a 24-hour
duration for each sample data point and computing the total load in tons for the sample
dataset as the sum of the loads on the sampled days. When the fitted rating curve is
applied to all the individual discharge values in the dataset, it should produce a total load
value very close to the computed sum of loads from the original dataset. The results,
summarized in Table 19.3, show that although the visually fitted curve somewhat
overestimated sediment load, it was considerably more accurate in describing the dataset
than several of the mathematically fitted equations. This exercise showed that the
problem with the sediment balance across the reservoir could not be attributed to an error
in curve fitting.
19.3.2 Analysis of Computational Increment
The sediment rating curve had been developed from instantaneous values of
concentration and discharge, but the load computations were made by applying the rating
curve to the record of average daily (not instantaneous) discharges. Hydrographs on
small, steep streams rise and fall rapidly, and mean daily discharge values reflect actual
discharges only approximately. Since sediment load increases as a power function of
discharge, applying an instantaneous-value rating curve to average daily flows will
underestimate sediment load.
To determine the severity of this error, the load was recomputed with hourly and
half-hourly discharge data from the arbitrarily selected inter-flushing period
of 1982-1983, using several different rating equations. The results for La Troya (Table
19.4) showed that the use of average daily discharges underestimated sediment load
by about 25 to 30 percent compared to computations with hourly data. There was
little difference between the total load computed for hourly versus half-hourly data. A
similar result was obtained using the Palorno data.
TABLE 19.3 Percentage of Sampled Sediment Load Explained by Different Sediment
Rating Equation
% of measured load at inflow gage
Type of Equation
La Troya Palomo
ICE visual curve 109 115
Regression on all logged values 33 50
Two regressions on all logged values — 83
Regression on logged means 61 102
Two regressions on logged means 89 108
Two regressions on logged means 101 —
Power function regression on all values 107 113
Two power function regressions on all values — 113
Power function regression on means 113 —
Two power function regressions on means 106 133
Note: At La Troya, two regressions on logged means were developed for two different transition
points. The La Troya data covered discharges only up to 72 m
3
/s because of lack of data (a single
point) at higher discharges.

CACHÍ HYDROPOWER RESERVOIR, COSTA RICA 19.12
TABLE 19.4 Variation in Sediment Load Estimates for Rio Navarro at La Troya. as a
Function of Discharge Interval Used in Load Computations
Sediment load, tons
Type of model
Daily
water
discharge
Hourly
water
discharge
Half
hour
discharge
Regression on all logged values 28,753 36,015 35,814
Two regressions on logged means 46,037 63,520 64,725
Two regressions, logged means 53,065 73,815 75,229
Power function regression on all values 59,072 78,046 79,272
ICE visual fitted equation 61,493 80,380 81,674
Note. Data corresponds to the period October 11, 1982 through September 18, 1983. For
discharges in excess of 72 m
3
/s, the equation load = 273Q
1.16
was used, representing a line through
the two available data points at 72 and 458 m
3
/s, respectively.
19.3.3 Field Data Collection Program
The combination of improved rating equations and the use of hourly instead of daily
discharge data produced a relatively small (about 30 percent) improvement in the
estimate of the inflowing load, leaving a discrepancy on the order of 250 percent
between the inflowing sediment load and flushing release. This indicated that the
available dataset did not accurately reflect the sediment transport process in the
river system. Even though the dataset extended back to 1971, an apparently
significant record length, there were two important deficiencies in the dataset: (1)
because of regular diurnal variations in discharge the sediment data were mostly
collected from the recession limb of hydrographs, and there were few data points
from the rising limb; and (2) the data did not adequately characterize high-
discharge events responsible for most sediment delivery.
19.3.4 Diurnal Variation in Discharge
Suspended sediment samples were normally collected around 10:00 A.M. However,
the hydrograph record (Fig. 19.8) revealed the importance of regular afternoon
rainstorms which caused discharge to increase quickly in the late afternoon and
recede at night. Water quality sampling at 10:00 A.M. coincided with the end of
the receding hydrograph, a period of minimum sediment discharge.
19.3.5 Critical Discharge Classes
Streamflow varies over a wide range, and a flow-duration analysis will reveal that some
discharge intervals are much more important than others in terms of both water and
sediment discharge. It is essential that a sediment rating curve properly reflect
sediment loads over the range of discharges responsible for most of the sediment
transport, which is characteristically not the most frequent discharge class. With the