Morris & Fan. Reservoir Sedimentation Handbook
Подождите немного. Документ загружается.


CHAPTER 7
SEDIMENT YIELD FROM
WATERSHEDS
Sediment yield refers to the amount of sediment exported by a watershed basin over a
period of time, which is also the amount which will enter a reservoir located at the
downstream limit of its tributary watershed. The specific sediment yield is the yield per unit
of land area. The correlation of sediment yield to erosion is complicated by the problem
of determining the sediment delivery ratio, which makes it difficult to estimate the
sediment load entering a reservoir on the basis of the erosion rate within the watershed.
This underscores the need to monitor sediment yield with fluvial gage stations and
sediment surveys in reservoirs.
Estimates of long-term sediment yield have been used for many decades to size the
sediment storage pool and estimate reservoir life. However, these estimates are often
inaccurate, and many reservoirs have accumulated sediment more rapidly than origi-
nally planned. Most sediment is exported from watersheds during relatively short peri-
ods of flood discharge, and these events must be accurately monitored to provide
information on the long-term yield as well as the timewise variation in load needed to
evaluate sediment routing strategies. Knowledge of the spatial variation in yield is
required to focus yield reduction efforts on the landscape units that deliver most sedi-
ment to the reservoir. Long-term trends in sediment yield occurring over a period of
decades may also influence sediment management in reservoirs.
This chapter describes fundamental concepts of sediment yield, emphasizing the
variable nature of yield over both time and space and monitoring strategies which are
useful to document both the variability and long-term magnitude of the sediment load
entering a reservoir. Sediment sampling techniques are discussed in Chap. 8, and meth-
ods for reducing sediment yield are presented in Chap. 12.
7.1 SPATIAL VARIABILITY IN SEDIMENT YIELD
The process of erosion and the delivery of sediment to the exit of a basin is never a spa-
ally uniform process. When virtually any landscape unit is examined, at any scale, there
will typically be large variations in the specific sediment yields. The large variability in
specific sediment yield worldwide was summarized by Jansson (1988) in an analysis of
suspended sediment data from 1358 gaging stations with tributary watersheds between
350 and 10,000 km
2
, and totaling 16 × 106 km
2
of land area. Stations were divided in six
yield classes (Table 7.1). The highest yield class, with specific sediment yields exceeding
1000 t/km
2
/yr, represented only 8.8 percent of the total land area in the global dataset but
contributed 69 percent of the total sediment load. In contrast, basins with specific yields
less than 50 t/km
2
/yr constitute nearly half the total land area but contributed only 2.1
percent of the total sediment yield.

SEDIMENT YIELD FROM WATERSHEDS 7.2
TABLE 7.1 Worldwide Sediment Yield
Yield class, t/km
2
/yr
Number of gage
stations
Percent of gaged
land area
Percent of total
gaged load
0-10
230
21.3
0.3
11-50
285
25.6
1.8
51-100
172
11.9
2.1
101-500
426
25.6
14.7
501-1000
145
6.9
21.0
>1000
179
8.8
69.1
Source:
Jansson (1988)
Extremely high sediment yields, in the range of 10,000 to 50,000 t/km
2
/yr, have been
reported at some stations in China, Java, Kenya, New Guinea, and New Zealand
(Walling, 1994). Taiwan discharges more sediment to the ocean per unit of land area
than any area of the world. Streams draining the Central Range of Taiwan produced
average suspended-sediment yields of 13,760 t/km
2
/yr, and one small basin exported
31,700 t/km
2
/yr of suspended sediment (Li, 1976). Taiwan's total sediment discharge to
the ocean is nearly 5 times larger than the sediment discharge from the entire continent
of Australia, although the area of Australia is 210 times larger. Australian discharge is
low because it is mostly desert which does not discharge to the ocean. Extremely high
sediment yields in Taiwan, Philippines, Indonesia, New Guinea, and New Zealand
reflect active tectonism and volcanism, steep slopes, heavy rainfall, and soil disturbance
by agriculture and logging (Milliman and Meade, 1983). In contrast, extremely low
long-term (e.g., 1000-year) sediment yields of 2 t/km
2
/yr have been documented in
small undisturbed alpine catchments with erosion-resistant granitic parent material
(Owens and Slaymaker, 1994).
The world's largest rivers in terms of sediment discharge are summarized in Table
7.2. The high-yielding Yellow River in China drains extremely erosive loess soils, and
the Ganges/ Brahamaputra drains the tectonically active and glaciated Himalayas. Human
disturbance is also important in both basins. Areas with extremely low sediment yield
TABLE 7.2 Ranking of the World Rivers by Sediment Load Discharged to the Ocean
River and country Average sediment discharge, 10
6
t/yr
1. Ganges/Brahamaputra, India 1670
2. Yellow, China 1080
3. Amazon, Brazil 900
4. Yangtze, China 478
5. Irrawaddy, Burma 285
6. Magdalena, Colombia 220
7. Mississippi, United States 210
8. Orinoco, Venezuela 210
9. Hungho (Red), Vietnam 160
10. Mekong, Thailand 160
SEDIMENT YIELD FROM WATERSHEDS 7.3
include streams draining flat areas, arid areas with inadequate streamflow to transport
large sediment volumes, and arctic regions which usually have low relief, little
precipitation, and low human impact. Sediment trapping by dams can have a large impact
on sediment discharge, even in large rivers. The pre-impoundment Colorado River
transported 135×10
6
t/yr through the Grand Canyon, and the pre-impoundment Nile
discharged 100×10
6
t/yr, but because of sediment trapping at upstream dams both rivers
now discharge negligible amounts of sediment (Milliman and Meade, 1983). Both the
Nile and the Mississippi River deltas are now being eroded because of sediment trap-
ping by upstream dams.
Geology, slope, climate, drainage density, and patterns of human disturbance all
affect sediment yield, and no single parameter or simple combination of parameters
explains the wide variability in global yields. Using data from 61 gage stations in
southern Kenya, Dunne (1979) demonstrated that land use is a dominant factor
explaining variability in sediment yield. Several researchers have correlated sediment
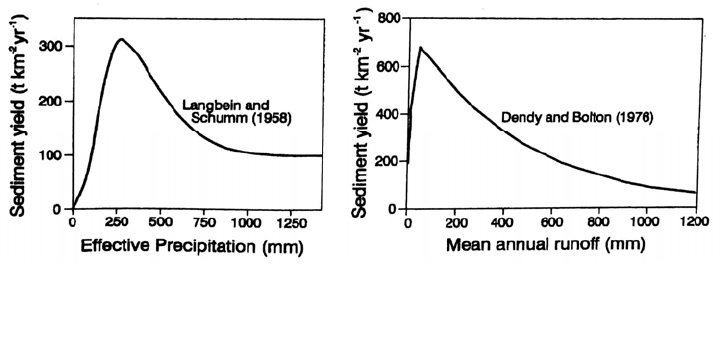
yield to precipitation, and a sample of these relationships is summarized in Fig. 7.1.
General relationships can be observed within some specific geographic regions, such as
the relationships for the conterminous United States developed by Langbein and Schumm
(1958) from gage station data, and by Dendy and Bolton (1976) based on resurvey data in
800 reservoirs. Within the 48 states, yield from drier areas tends to be limited because of
low runoff and yield in wetter areas is limited by the protective soil cover and reduced
erodibility of humid zone soils. However, such relationships are highly generalized and
do not reflect the wide scatter in the underlying data, and they cannot be extended to
other geographic areas. For instance, the Langbein-Schumm relationship breaks down if
extended to include all of North America, since the low-precipitation areas of tundra in
northern Canada and Alaska have extremely low sediment yields. On a global basis, there
is no apparent relationship between precipitation and specific sediment yield. However,
sediment concentrations in arid zone rivers tend to exceed concentrations in humid zones.
That this does not cause an increase in sediment yield from arid regions is attributed to
the reduced discharge volume.
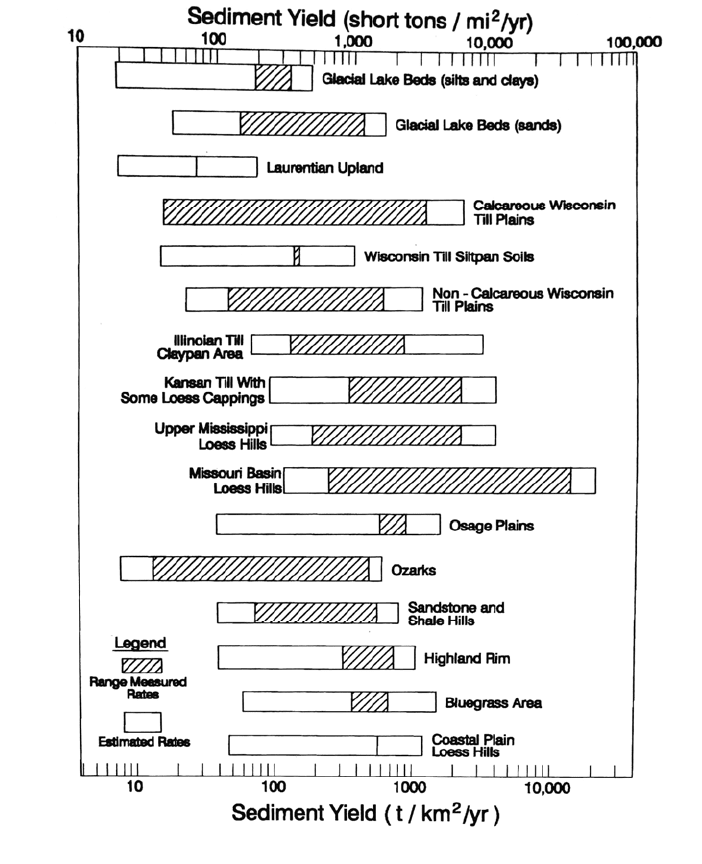
The wide variation in specific sediment yield in the global dataset is also reflected at
all levels of analysis: national, regional, and within-watershed. Regional comparisons of
specific sediment yields using gaged watersheds showed that yields varied by a factor of
500 in Thailand (Jantawat, 1985), 800 in South Africa (Rooseboom, 1992), 400 in Kenya
(Dunne, 1979), and 70 in Zimbabwe (Van Den Wall Bake, 1986). Sediment yields for
selected physiographic regions in the United States (Fig. 7.2) illustrate both the variation
between regions as well as the wide variation of measured rates within regions.
FIGURE 7.1 Relationships between sediment yield and rainfall development for the
conterminous United States.
SEDIMENT YIELD FROM WATERSHEDS 7.4
FIGURE 7.2 Comparative sediment yields in selected areas of the United States (Vanoni,1975).
Within a single watershed only a small fraction of the landscape is usually responsible
for a large percentage of the sediment yield. Dividing total sediment discharge by total
basin area to determine the average yield can be grossly misleading because it masks the
underlying variability in sediment yield from individual sub-watersheds or land parcels
(Campbell, 1985). Dramatic variations in sediment yield can occur even within small
watersheds, especially when subject to disturbance, as illustrated in a 4.0 ha mountain
watershed in Idaho studied by Megahan (1975). Logging increased sediment yield from
the watershed by a factor of 150 compared to undisturbed conditions. However, erosion
rates were accelerated by a factor of 550 on logging roads affected by mass wasting and
only 1.6 on forest soils with disturbance limited to tree falling and skidding (Table 7.3).
The increase in sediment yield from the watershed reflected the presence of limited land
areas with a high sediment yield rather than a general increase in sediment yield across
the entire landscape. To be effective, control efforts must be focused on the high-yield
areas.

SEDIMENT YIELD FROM WATERSHEDS 7.5
TABLE 7.3 Mean 6-Year Sediment Production from Surface and Mass Erosion Caused
by Logging
Type of disturbance Sediment yield, m
3
/km
2
/yr Ratio to undisturbed land
Undisturbed land 42 1
Average for disturbed watershed 6,325 155
Sub-watershed by type of disturbance:
Tree felling and log skidding only 65 1.6
Roads (surface erosion) 8,966 220
Roads (mass erosion) 22,417 550
Source: Megahan (1975)
7.2 TEMPORAL VARIABILITY IN SEDIMENT YIELD
7.2.1 Temporal Focusing of Sediment Yield
Being the product of discharge and solids concentration, sediment yield exhibits greater
variability and is more focused in time than streamflow. For example, a stream draining
disturbed hilly lands may experience a thousand-fold increase in both sediment
concentration and liquid discharge between minimum and peak flow. This will cause a
million-fold increase in the instantaneous rate of sediment discharge if both concentration
and discharge peak simultaneously. Under these conditions the sediment load during 15
minutes of peak discharge will equal the sediment load during 28 years of low flow.
Extreme variability in sediment yield has been reported by a number of workers.
Milliman and Meade (1983) cited the case of the 4100-km
2
Santa Clara River basin in
Southern California which discharged 50×10
6
t of sediment during a single flood event in
1969, more than 700 times the measured average annual load of 69×10
3
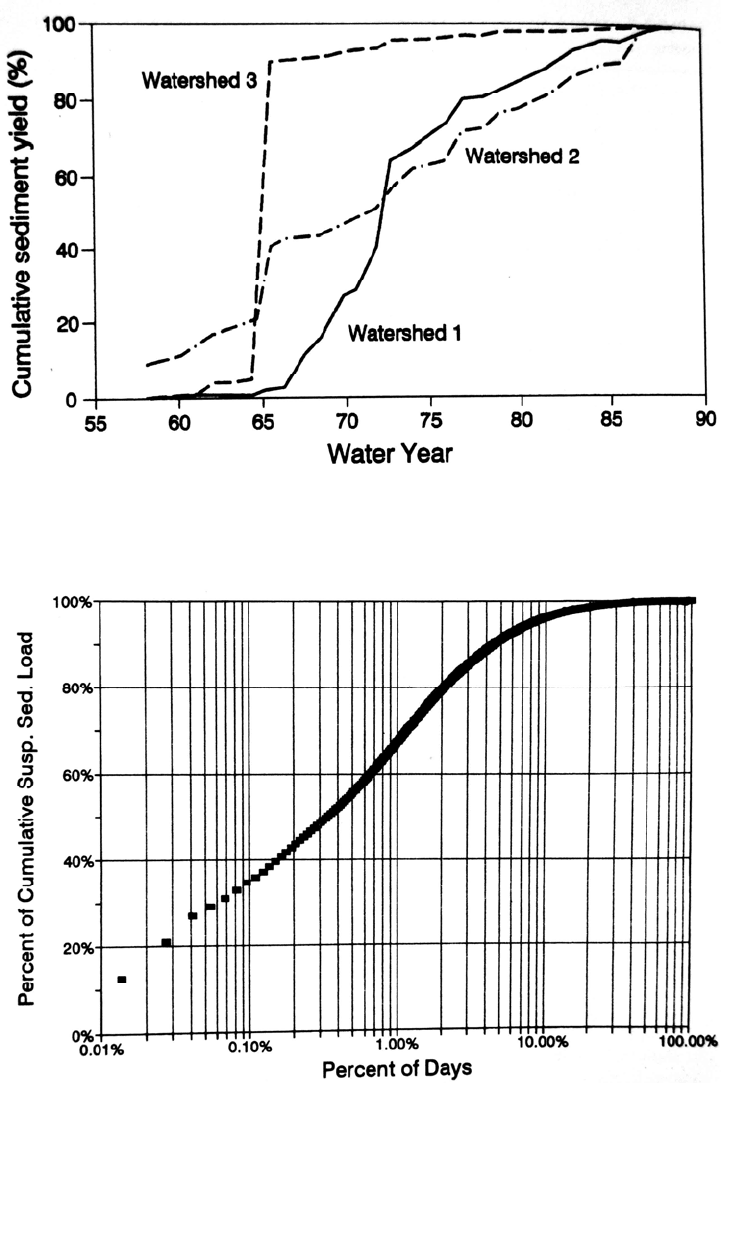
t/yr. Grant and
Wolff (1991) reported on a 30-year study in three experimental forest watersheds totaling
4.3 km
2
in the Cascade Mountains of Oregon, selected for their proximity and similarities
in size, aspect, and topography. The forest receives about 2300 mm/yr of precipitation
and was dominated by old-growth Douglas fir. Watersheds 1 and 3 were logged between
1962 and 1966, and watershed 2 was a control. Cumulative sediment yield as a function
of time is shown in Fig. 7.3, illustrating the effect that a large storm can have on the
pattern of long-term yield. Slope failures in watershed 3 resulted in the delivery of 88
percent of the 30-year sediment yield during a single event, probably within only a few
hours. About 90 percent of this material originated from logging roads.
High temporal variability in sediment transport is a general feature of river systems
worldwide. For rivers in the United States, Meade and Parker (1984) have shown that 50
percent of the annual sediment load is discharged in only 1 percent of the time, and 90
percent of the load is discharged in only 10 percent of the time. A similar concentration
in time was reported by Walling and Webb (1981) on the basis of continuous
measurements in River Creedy near Devon, United Kingdom, and by Summer et al.
(1994) for the Danube River in Austria. The cumulative sediment load ranked as a
function of either time or discharge can be represented on a semilog plot similar to Fig.
7.4.
7.2.2 Within-Storm Variation in Suspended Load
Suspended solids concentration will usually vary widely over the duration of a runoff
event. The timewise variation in suspended sediment concentration and discharge during
SEDIMENT YIELD FROM WATERSHEDS 7.6
FIGURE 7.3 Cumulative sediment yield with time three small forest watersheds, showing the
dramatic impact of slope failures and debris flows in watershed 3 caused by a single stor
m
during the 30 year period (after Grant and Wolff, 1991).
FIGURE 7.4 Ranked cumulative sediment yield from Río Tanamá, Puerto Rico, as a functio
n
of time, illustrating the timewise focusing of sediment discharge. Only 1 percent of the days
account for 67 percent of the sediment discharge over the 21-year sediment discharge record.
Sediment discharge would have been even more tightly focused in time had hourly rather tha
n
daily data been available for preparation of this plot (prepared from USGS daily data).
SEDIMENT YIELD FROM WATERSHEDS 7.7
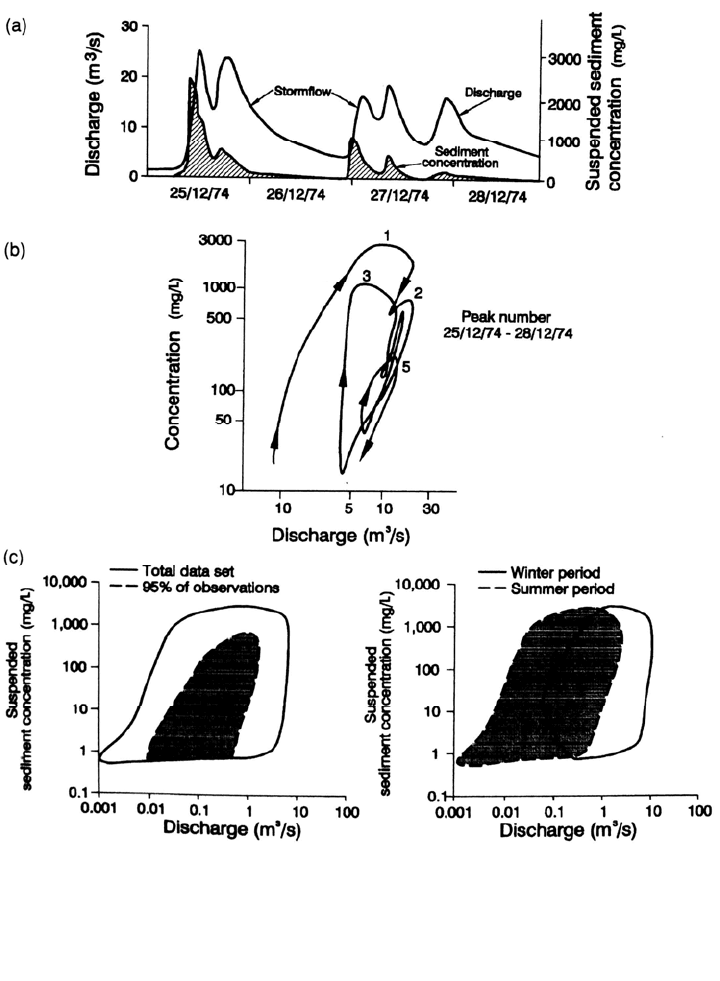
a multiple-peak event is illustrated in Fig. 7.5a, showing the reduction in concentration
during subsequent peaks due to exhaustion of sediment supply. The concentration C and
discharge Q data pairs from this event are plotted in Fig. 7 .5b in the form of an event C-
Q graph with a clockwise loop. When concentration and discharge data pairs from many
events are superimposed they create a scatter plot (Fig. 7.5c) of the type commonly used
to construct sediment rating curves. Note that a better fit is obtained when the period-of-
record C-Q data are subdivided into seasonal datasets. The degree of scatter illustrated in
the rating curve is typical of conditions in many streams.
FIGURE 7.5 Suspended sediment and discharge relationships for River Dart, United Kingdom
(after Walling and Webb, 1988). (a) Timewise variation in discharge and concentration showing
sediment exhaustion over this multiple peak storm. (b) Multiple clockwise loops in the C-Q graph
resulting from sediment exhaustion. (c) General shape of C-Q relationship incorporating
instantaneous data from multi
p
le storms.

SEDIMENT YIELD FROM WATERSHEDS 7.8
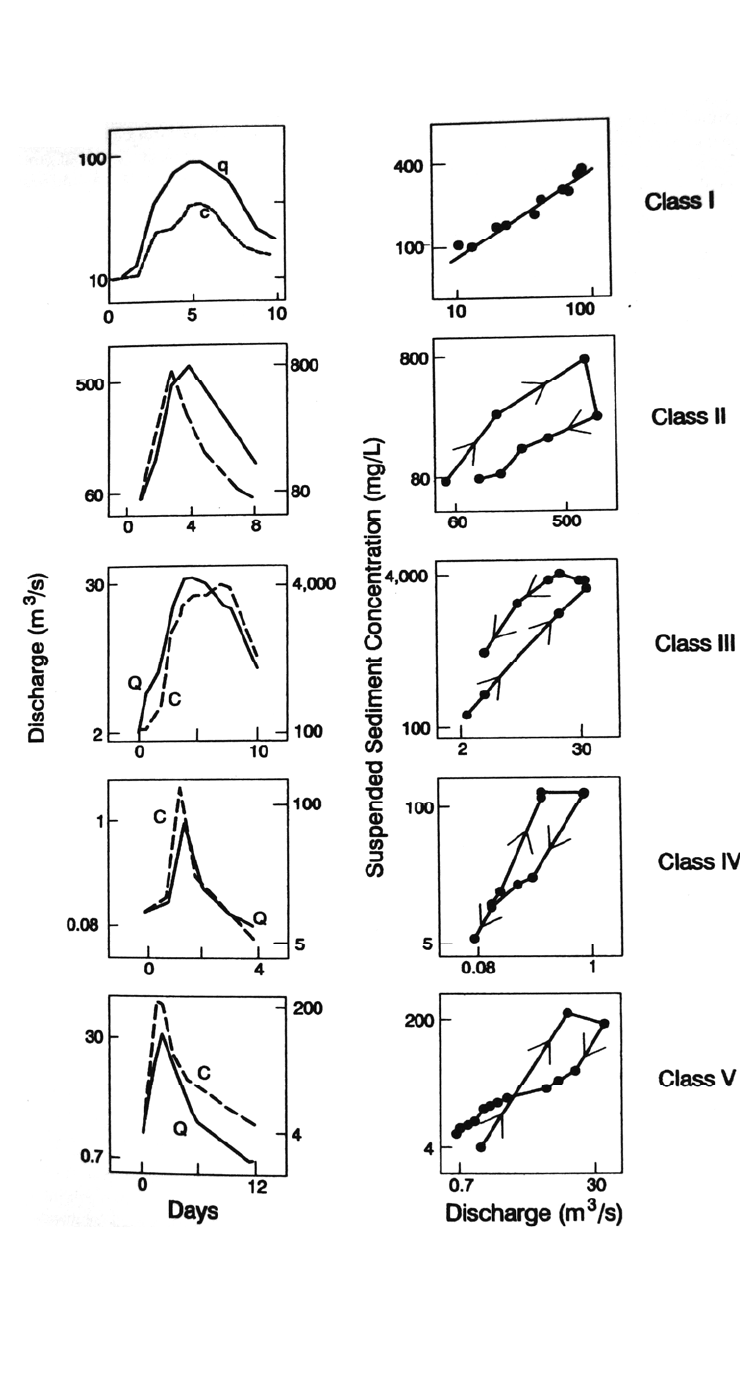
Williams (1989) has classified single event C-Q graphs into five categories:
Name Characteristic Occurrence
Class I Single-value line Rare
Class II Clockwise loop Common
Class III Counterclockwise loop Common
Class IV Single line plus loop Rare
Class V Figure Eight ?
The form of each class is illustrated in Fig. 7.6, showing the basic relationship between
the timewise variation in discharge and sediment concentration, and the resulting single-
event C-Q graph configuration.
If sediment concentration varies directly as a function of discharge, then it will be
possible to construct a single-value relationship relating sediment concentration (and
sediment load) to water discharge. This condition is represented by the Class I curve in
which discharge and concentration rise and fall simultaneously, and, when skewed, both
discharge and concentration are symmetric. The Class I curve implies uninterrupted
sediment supply through the flood, and sediment concentration should be directly related
to hydraulic factors alone. This condition is not typical; the temporal graphs of water and
sediment discharge in most field data are not symmetric. However, most sediment rating
curves are constructed by using one or several single-value functions.
The Class II, or clockwise hysteresis loop, is well-known and occurs commonly. This
pattern usually occurs when sediment concentration peaks before discharge, but under
certain conditions a clockwise loop can occur when the concentration and discharge
peaks occur simultaneously. Clockwise C-Q loops may be attributed to three causes: (1)
The readily erodible material in the watershed or the sediment accumulated in the
channel since the previous flood is washed out prior to the storm peak, and sediment load
becomes increasingly supply limited over the duration of the event. (2) Sediment supply
available from the bed may become limited prior to the peak discharge because of the
development of an armor layer. (3) Variations in rainfall and erodibility across the
watershed can concentrate sediment discharge from areas of high sediment production
near the basin outlet during the rising limb of the hydrograph. Some methods of routing
sediment through reservoirs take advantage of clockwise loops, passing, sediment-laden
water through the impoundment during the rising limb of the hydrograph, and storing the
clearer water from the falling limb. In urban water-quality detention basins, the opposite
effect is desired: sediment-laden first-flush water from the rising limb is captured while
cleaner water from the remainder of the storm is discharged to the environment.
Class III C-Q relationships, counterclockwise loops, may also be attributed to three
causes. (1) In longer rivers the change in discharge tends to increase as a function of
wave velocity, which is generally faster than the mean flow velocity of the stream (which
is also the transport velocity of the sediment), causing sediment to lag increaingly behind
the discharge peak as the flood wave moves downstream. This difference is magnified
when floods pass through lakes or other detention areas which can have high wave
velocities but slow sediment movement. (2) High soil erodibility in conjuncion with
prolonged erosion during the flood, including gully erosion, have been reported to cause
counterclockwise loops in erodible loessal soils. (3) Variability in rainfall and erodibility
across the watershed can cause high sediment discharge from distant portions of the
watershed to arrive during the declining limb of the hydrograph. The complex Class IV
pattern combines causal factors associated with Classes I and either II or III.
SEDIMENT YIELD FROM WATERSHEDS 7.9
FIGURE 7.6 Concentration-discharge (C-Q) graphs (after Williams,1989) illustrating relationships
between discharge and concentration observed in storm hydrographs. The temporal graphs are
arithmetic plots and the C-Q relationships are log-log plots.
SEDIMENT YIELD FROM WATERSHEDS 7.10
Class V, a figure-eight loop, combines features of both clockwise and counter-
clockwise loops, with the key feature being that relatively high sediment concentrations
must be sustained while discharge drops. Under some conditions, a sediment peak
preceding the discharge peak can produce a figure-eight pattern.
The C-Q relationship for a particular stream is not a fixed parameter of the watershed
but can exhibit considerable variation from one storm to another depending on factors
including the intensity and areal distribution of the rainfall, and changes in the supply of
readily erodible sediments. When discharge-concentration data pairs from many events
are combined, the resulting scatter may be large and preclude the development of a
consistent rating relationship.
7.2.3 Seasonal Variability in Sediment Yield
Suspended sediment yield can exhibit a regular seasonal variation due to processes within
the watershed. At the onset of a rainy season there may be a large supply of readily
erodible sediment, and the protective vegetative cover may be largely eliminated by
cultivation and overgrazing, producing early season runoff having a higher sediment
concentration than late season runoff. Seasonal variation of erodibility in Nepal was
illustrated in Fig. 6.3. In some areas wind plays an important intermediary role,
transporting fine sediments from ridges into depressions where it becomes available for
fluvial transport at the onset of rains (Rooseboom, 1992). In large basins, such as the
Nile, subregions having different erosional characteristics may contribute runoff at
different times of year, creating strong seasonal variations in sediment load.
Seasonal variations in sediment load can be important for reservoir sediment
management. If reservoir emptying for sediment flushing is scheduled to coincide with
the season of highest sediment load, the large sediment load that enters during this period
can be routed through the reservoir without deposition. This routing strategy was used at
the Old Aswan Dam on the Nile, which was equipped with 180 bottom sluices for
sediment release. The Nile at Aswan has two main tributaries, the White Nile and the
Blue Nile. The White Nile originates in the area of Lake Victoria and is characterized by
relatively small changes in discharge between flood and nonflood season, and low
sediment yield. However, floods in the Blue Nile and Atbara Rivers originate in the
erosive Ethiopian highlands and contribute most of the sediment load, producing highly
seasonal variations in both discharge and sediment concentration (Fig. 7.7). During the
early part of the Nile flood, the bottom sluices were opened to pass this runoff and its
associated sediment through the reservoir, minimizing sediment deposition. Today's
Aswan High Dam controls 100 percent of the Nile runoff, and sediment release is no
longer practiced. Seasonal flushing at numerous reservoirs in China is also scheduled to
coincide with periods of high sediment discharge.
7.2.4 Interannual Variability in Sediment Load
Large year-to-year variations in annual sediment discharge is characteristic of streams in
both wet and dry areas. Walling and Kleo (1979) graphed the coefficient of variation in
annual sediment discharge for 256 stations worldwide having a minimum of 7 years of
data and found no significant difference in annual sediment yield variability between wet
and dry climates.
7.2.5 Long-Term Changes in Sediment Yield Due to Disturbances
Changes in sediment yield over periods of thousands of years due to postglacial climate
changes have been deduced from sediment deposits in natural lakes (Owens and