Potter T.D., Colman B.R. (co-chief editors). The handbook of weather, climate, and water: dynamics, climate physical meteorology, weather systems, and measurements
Подождите немного. Документ загружается.

We now define the dry and moist static energies to be
h
m
c
pd
T gdzþ lr
v
and
h c
pd
T gdz;
respectively. Notice that the dry static energy is closely related to y and the moist
static energy is closely related to y
e
. The three energy storage terms involved are the
sensible heat (c
pd
T), the geopotential energy (gz), and the latent heat (L
vl
r
v
). It is
now convenient to study the total energy budget of a large-scale atmospheric system
to and assess conversions between kinetic energy and static energy.
REFERENCES
Dutton, J. (1976). The Ceaseless Wind, McGraw-Hill.
Emanuel, K. A. (1994). Atmospheric Convection, Oxford University Press.
Hess, S. L. (1959). Introduction to Theoretical Meteorology, Holt, Reinhardt, and Winston.
Iribarne, J. V., and W. L. Godson (1973). Atmospheric Thermodynamics, D. Reidel Publishing
Co.
Sears, F. W. (1953). Thermodynamics, Addison-Wesley.
Wallace, J. M., and P. V. Hobbs, (1977). Atmospheric Science: An Introductory Survey,
Academic Press.
236
MOIST THERMODYNAMICS

CHAPTER 17
THERMODYNAMIC ANALYSIS IN
THE ATMOSPHERE
AMANDA S. ADAMS
1 ATMOSPHERIC THERMODYNAMIC DIAGRAMS
Before compu tations were made on computers, atmospheric scientists regularly
employed graphical techniques for evaluating atmospheric processes of all kinds
including radiation processes, dynamical processes, and thermodynamic processes.
Over the last few decades, the use of graphical techniques has almost completely
disappeared with the exception of thermodynamic diagrams and conserved variable
thermodynamic diagrams.
Classical Thermodynamic Diagrams
The thermodynamic diag ram is used to graphically display thermodynamic
processes that occur in the atmosphere. The diagram’s abscissa and ordinate are
designed to represent two of the three state variables, usually a pressure function
on one and a thermodynamic function on another. Any dry atmospheric state may be
plotted. Unfortunately, any moist state cannot be plotted as a unique point since that
must depend on the values of r
v
, r
l
, and r
i
. However, vapor content can be inferred
by plotting dewpoint temperature, and moist processes can be accounted for by
assuming certain characteristics of the moist process such as if the process is
pseudo-adiabatic.
Handbook of Weather, Climate, and Water: Dynamics, Climate, Physical Meteorology, Weather Systems,
and Measurements, Edited by Thomas D. Potter and Bradley R. Colman.
ISBN 0-471-21490-6 # 2003 John Wiley & Sons, Inc.
237

There are three characteristics of a thermodynamic diagram that are of paramount
importance. They are:
1. Area is proportional to the energy of a process or the work done by the
process. An important function of a thermodynamic diagram is to find the
energy involved in a process. If the diagram is constructed properly, the energy
can be implied, by the area under a curve or the area between two curves
representing a process.
2. Fundamental lines are straight. Keeping the fundamental lines straight aids in
use of the thermodynamic diagram.
3. Angle between isotherms (T) and isentropes (y) are to be as large as possible.
One of the major functions of the thermodynamic diagram is to plot an
observed environmental sounding and then compare its lapse rate to the dry
adiabatic lapse rate. Since small differences are important, the larger the angle
between an isotherm and an isentrope, the more these small differences
stand out.
Over the years there have been several different thermodynamic diagrams
designed. While they all have the same basic function of representing thermody-
namic processes, they have a few fundamental differences. Before these differences
can be discussed, it is important to have an understanding of the variables and lines
found on a thermodyn amic diagram.
Dry Adiabatic Lapse Rate and Dry Adiabats
One of the lines on a thermodynamic diagram, known as the dry adiabat, is repre-
sentative of a constant potential temperature (y). Following along a dry adiabat the
potential temperature will remain constant, while the temperature will cool at the dry
adiabatic lapse rate. The dry adiabatic lapse rate represents the rate at which an
unsaturated parcel will cool as it rises in the atmosphere, assuming the parcel does
not exchange heat or mass with the air around it, hence behaving adiabatically.
The dry adiabatic lapse rate can be derived from a combination of the first law
of thermodynamics, the ideal gas law, and the hydrostatic approximation
(see chapters 15 and 16), given by:
dT
dz
¼
g
cp
Thus the dry adiaba tic lapse rate for an ascending parcel is simply g=c
p
and is
approximately equal to 9.8
C=km or 9.8 K=km. The dry adiabat lines on a thermo-
dynamic diagram are beneficial in that the user may ascend an unsaturated parcel
along the dry adiabats and simply read off the new temperature.
238 THERMODYNAMIC ANALYSIS IN THE ATMOSPHERE

Moist Adiabatic Lapse Rat e and Pseudo-Adiabats
When a parcel is saturated, it does not suffice to use the dry adiabatic lapse rate. A
parcel that is saturated will experience condensation of the water vapor in the parcel.
As water vapor condenses the process releases latent heat. This release of latent heat
keeps the parcel from cooling at the dry adiabatic lapse rate. The parcel cools at a
slower rate, which is dependent on temperature. This reduced rate of temperature
decrease has a slope approximately parallel to the moist adiabat and exactly parallel
to a line of constant equivalent potential temperature. The term pseudo-adiabat is
often used to describe the moi st adiabat on a thermodynamic diagram. The moist
adiabat on a thermodynamic diagram ignores the contribution by ice, which is more
difficult to represent because freezing and melting do not typically occur in equili-
brium as does condensation. In a pseudo-adiabatic process the liquid water that
condenses is assumed to be immediately removed by idealized instantaneous preci-
pitation. Thus the word pseudo-adiabat is used since the line on a thermodynamic
diagram is not truly moist adiabatic. If ice is neglected, an expression for the moist
adiabatic lapse rate can be derived in a manner similar to the dry adiabatic lapse rate,
by using the first law for moist adiabatic hydrostatic ascent. The moist adiabatic
lapse rate can never be greater than the dry adiabatic lapse rate. At very cold
temperatures, around 40
C, the moist adiabatic lapse rate will approach the dry
adiabatic lapse rate. In the lower troposphere the moist adiabatic lapse rate may be as
small as 5.5
C=km. The equation for the moist adiabatic lapse rate is given as:
dT
dz
¼
g
cp
1 þ
L
vl
R
d
r
sl
T
1 þ
L
vl
R
d
r
sl
T
eL
vl
c
p
T
2
6
6
4
3
7
7
5
Types of Thermodynami c Diagrams
There are several different thermodynamic diag rams. All the diagrams serve the
same basic function; however, there are differences among these diagrams that
should be understood before choosing a diagram. The emagram was named by
Refsdal as an abbreviation for ‘‘energy per unit mass diagram’’ (Hess, 1959). The
emagram uses temperat ure along the abscissa and the log of press ure along the
ordinate. The isobars (lines of constant pressure) and the isotherms (lines of
constant temperature) are straight and at a right angle to each other. With pres-
sure plotted on a logarithmic scale, the diagram is terminated at 400 mb, well
before the tropopause.
On the tephigram one coordinate is the natural log of potential temperature (y)
and the other is temperature. Thus, on a tephigram an isobar is a logarithmic curve
sloping upward to the right. The slope decreases with increasing temperature. In the
range of meteorological observations, the isobars are only gently sloped. When using
the tephigram, the diagram is usually rotated so that the isobars are horizontal with
decreasing pressure upward. The pseudo-adiaba ts are quite curved, but lines of
1 ATMOSPHERIC THERMODYNAMIC DIAGRAMS 239

constant saturation mixing ratio tend to be straight. The angle between the isotherms
and isent ropes is 90
, making this type of thermodynamic diagram particularly good
for looking at variations in stability of an environmental sounding.
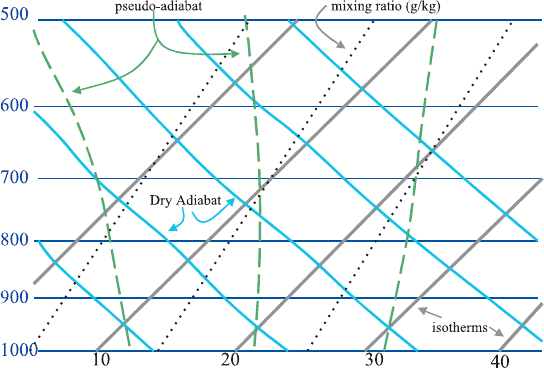
The skew T–log P diagram is now the most commonly used thermodynamic
diagram in the meteorological community (Fig. 1). This diagram first suggested by
Herlofson in 1947 was intended as a way to increase the angle between the
isotherms and isentropes on an emagram (Hess, 1959). The isobars are plotted
on a log scale, similar to the emagram. The isotherms slope upward to the right at
45
to the isobars. This angle of the isotherms is what gives this diagram its name,
since the temperature is skewed to the right. The isentropes are skewed to the left,
at approximately a 45
angle to the isobars. However, the isentropes are not
perfectly straight, although they remain nearly straight in the meteorological
range typically used. With both the isotherms and isentropes (dry adiabats) at
approximately 45
to the isobars, the angle between the isotherms and isentropes
is close to 90
. The pseudo-adiabats are distinctly curved on this diagram. In order
for the pseudo-adiabats to be straight, the energy–area proportionality of the
diagram would need to be sacrificed.
The Stu
¨
ve diagram is another type of thermodynamic diagram. The Stu
¨
ve
diagram has pressure in mb along the x axis and temperature along the y axis.
This coordinate system allows the dry adiabats (ise ntropes) to be straight lines.
However, this diagram does not have area proportional to energy. The uses of the
Stu
¨
ve diagram are limited when compared to the uses of energy conservation ther-
modynamic diagrams. This diagram is still occasionally used in the meteorological
community, but because of familiarity rather than usefulness.
The characteristics of the thermodynamic diagrams discussed is summarized in
the following table:
Figure 1 Skew T–log P diagram. See ftp site for color image.
240
THERMODYNAMIC ANALYSIS IN THE ATMOSPHERE

Attribute Emagram Tephigram Skew T–log P Stu¨ve
Area a energy Yes Yes Yes No
T vs. y angle 45
90
Almost 90
45
p Straight Gently curved Straight Straight
T Straight Straight Straight Straight
y Gently curved Straight Gently curved Straight
y
ep
Curved Curved Curved Curved
r
s
Gently curved Straight Straight Straight
With multiple thermodynamic diagrams available it may seem overwhelming to a
new user to determine the appropriate diagram for the task. The skew T–log P
diagram and tephigram are the most commonly used thermodynamic diagrams.
Their strength lies in the angle between the isentropes and isotherms. The tephigram
is most widely used by tropical meteorologists because of the ability of the tephi-
gram to show small changes in stability. In the tropics convective potential may be
modified by only small changes in the vertical stability of the environment, and the
tephigram best captures small changes in the environmental lapse rate. The skew T–
log P diagram is the most commonly used thermodynamic diagram in the midlati-
tudes. The straight isobars and the straight up verti cal temperature profile make the
diagram intuitively easy to comprehend. The ultimate decision of which diagram to
use relies on the familiarity of the diagram to the user. While a summer air mass in
the middle latitudes may best show instability on a tephigram, a meteorologist may
prefer to use the familiar skew T–log P diagram.
2 ATMOSPHERIC STATIC STABILITY AND APPLICATIONS OF
THERMODYNAMIC DIAGRAMS TO THE ATMOSPHERE
Early atmospher ic scientists sent up kites with thermometers attached to acquire an
understanding of the vertical profile (atmospheric sounding) of the atmosphere.
Today, atmospheric scientists use balloons rather than kites and radiosondes rather
than thermometers in an effort to understand the vertical structure of the atmosphere.
Radiosondes collect temperature, moisture, wind speed, and wind direction at
various pressure levels in the atmosphere. The data gained from radiosondes,
when displayed on a thermodynamic diagram, provide forecasters and scientific
investigators with infor mation that can be used to diagno se not only the current
state of the atmosphere but also the recent history of the local atmospher e and the
likelihood of future evolution. An air mass originating over a land mass wi ll have
inherently different characteristics to its ther modynamic profile than an air mass
originating over the oceans. An air mass influenced by motions associated with an
approaching weather system will acquire characteristics associated with those circu-
lations. A trained meteorologist can read an atmospheric sounding plotted on a
thermodynamic diagram like a book, revealing the detailed recent history of the
air mass.
2 ATMOSPHERIC STATIC STABILITY 241
Radiosondes are launched twice daily around the world, at 0000 Universal Time,
Coordinated (UTC), also known as Greenwich Mean Time (GMT) or Zulu time (Z),
and 1200 UTC. While the data from radiosondes are available only twice daily, when
the data is plotted on a thermodynamic diagram, they can be used to study potential
changes in the atmosphere. Thermodynamic diagrams can be used to examine the
potential warmth of the atmosphere near the surface during the day, the potential
cooling of temperature at night, and the potential for fog. The potential for cloudiness
can be found due to the movements induced by approaching or withdrawing weather
systems or by the development of unstable rising air parcels. When the vertical
thermodynamic structure is combined with the vertical wind stru cture, information
on the structure, and severity of possible cumulus clouds can be ascertained. The
sounding can also describe the potential for local circulations such as sea breezes,
lake effect snow, downslope windstorms, and upslope clouds and precipitation.
An atmospheric sounding plotted on a thermodynamic diagram is one of the most
powerful diagnostic tools available to meteorologists. The applications of the ther-
modynamic diagrams are far too many to be adequately c overed in this discussion.
This discussion will focus on some of the basic interpretive concepts that can be
applied generally to atmospheric soundings plotted on thermodynamic diagrams.
Environmental Structure of the Atmosphere
The sounding plotted on a thermodynamic diagram represents a particular atmo-
spheric state. The state may be observed by radiosonde, satellite derived, or fore-
casted by a computer atmospheric numerical model. The data plotted on the diagram
represent the temperature and dew-point temperature at various pressure levels
throughout the atmosphere. Individual observations are plotted, and then the
points are connected forming the dew point and temperature curves. The dew-
point temperature is always less than or equal to the temperature for any given
pressure level. The plotted curves represent the environmental temperature and
dew-point temperature, as a function of pressure.
The environmental temperature and dew-point temperature curves will divulge
much information to a well-trained observer who can deduce where the sounding is
from, as well as identify air masses and the processes involved in their formation.
Air masses originate from specific source regions and carry the characteristics of that
source region.
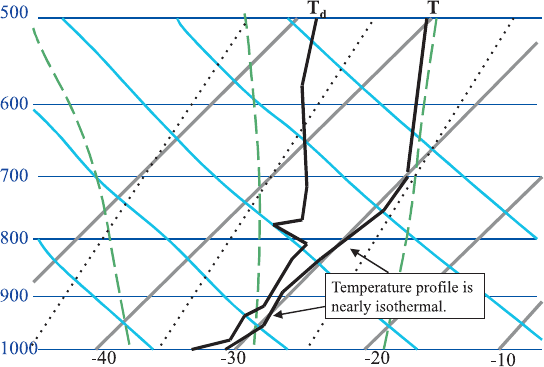
Arctic Air Mass Air masses that originate near one of the poles have a nearly
isothermal temperature profile. In the polar regions, the main process driving the
temperature profile is radiational cooling. Light winds allow very little vertical
mixing of the air. When coupled with the lack of solar radiation for much of the
year, radiational cooling of the surface is the remaining process. Initially the air near
Earth’s surface cools faster. The rate at which energy is emitted is dependent on
temperature to the fourth power (Stefan–Boltzmann equation), and therefore the
warmer air above will then cool faster than the colder air at the surface. This results
in the atmosphere moving toward a constant temperature, and this result is
242 THERMODYNAMIC ANALYSIS IN THE ATMOSPHERE

observable on a skew-T diagram by the isothermal profile that begins at the surface
(Fig. 2). The tropopause is found at a much lower height near the poles. An arctic
sounding will illustrate the low tropopause. Both maritime and continental arctic air
masses will have an isothermal temperature profile; the difference is found in the
degree of saturation of the air.
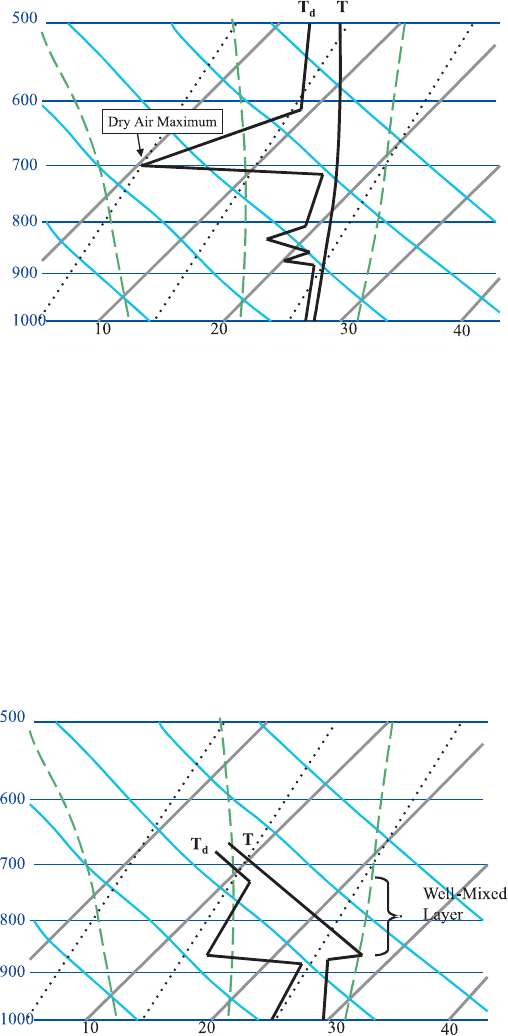
Marine Tropical Air Mass In a marine tropical environment (Fig. 3) the
temperature profile is nearly moist adiabatic (parallels the pseudo-adiabats).
The air in this region is close to saturation near the surface and thus very humid.
Above the planetary boundary layer, the air is dominated by sinking motion between
cumulus clouds and will tend to be dry except for some moisture mixed from the
cumulus clouds. Since saturated air parcels in cumulus updrafts force much of the
sinking motion outside clouds, the temperature profile closely parallels the pseudo-
adiabat. A dry air maximum resulting from the sinking around 700 mb characterizes
the dew-point profile of a marine tropical environment. Below 700 mb surface
moisture mixes upward driven by solar heating and solar-powered surface evapora-
tion. The dry air maximum is the feature that truly distinguishes the maritime
tropical air mass from other air masses.
Well-Mixed Air Mass Perhaps one of the easiest air masses to identify is one
that is well mixed (Fig. 4). If a layer of the atmosphere has sufficient turbulence, the
layer wi ll become well mixed with the moisture and potential temperature evenly
distributed.
The temperature profile will take on the slope of the adiabatic lapse rate and the
dew-point temperature will follow a constant mixing ratio value. Mixing ratio is a
measure of the actual amount of water vapor in the air, and in an environment with a
Figure 2 Characteristic arctic air mass. See ftp site for color image.
2 ATMOSPHERIC STATIC STABILITY 243

lot of turbulent mixing the water vapor will become evenly distributed. Well-mixed
layers generally form in a capped boundary layer. However, a well-mixed layer may
form in the boundary layer of one region and then be advected into another region.
If the region that the well-mixed layer is advected into is at a lower elevation, the
well-mixed layer may ride over the existing boundary layer, resulting in an elevated
mixed layer. This is commonly observed in the Great Plains of the United States,
where a well-mixed layer is advected off the Mexican Plateau or Rocky Mountains,
over the boundary layer of the Plains, which is very moist due to flow from the Gulf
of Mexico.
Figure 3 Marine tropical air mass. See ftp site for color image.
Figure 4 Well-mixed layer in the atmosphere. See ftp site for color image.
244
THERMODYNAMIC ANALYSIS IN THE ATMOSPHERE

Deep Convection Layers of the atmosphere that include clouds are identifiable
because the temperature and dew-point temperatures will be close together indicat-
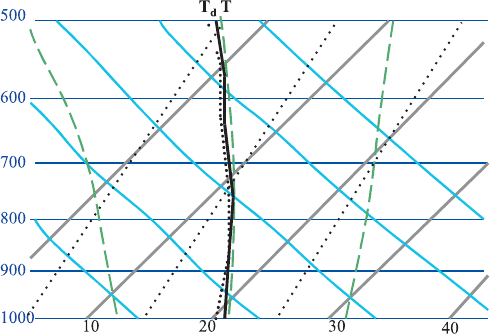
ing the air is saturated. In the case of deep convection (Fig. 5), the dew-point
temperature and temperature, within the updraft, are so close together that they
are almost indisti nguishable from each other. They are close together throughout a
deep layer of the atmosphere, typically the surface up to the tropopause. The
temperature profile of the environment will closely parallel the moist adiabat in
the case of deep convection. In deep convection, where the atmosphere is basically
saturated throughout, all rising parcels will cool at the moist adiabatic lapse rate.
Critical Levels on a Thermodynamic Diagram
The information on a thermodynamic diag ram may be used not only to determine
where air masses originated from but to also determine what processes the atmo-
sphere may undergo. There are many different critical levels that can be diagnosed
from a sounding plotted on a thermodynamic diagram. A thermodynamic diagram
may be used to determine where a parcel will become either saturated and=or buoy-
ant. The level at which the parcel becomes saturated depends on not only the
moisture content but the processes the atmosphere is u ndergoing, for this reason
there are multiple condens ation levels dependent on the process occurring.
Lifting Condensation Level (LCL) This is the pressure level at which a parcel
lifted dry adiabatically will become saturated. This level is impor tant for two
reasons. First, since the parcel becomes saturated at this point, it represents the
height of cloud base. Second, since the parcel is saturated, if it continues to rise
above this level, the parcel will cool at the moist adiabatic lapse rate. In a condi-
tionally unstable atmosphere, a parcel is unstable only if saturated. A conditionally
Figure 5 Deep convection. See ftp site for color image.
2 ATMOSPHERIC STATIC STABILITY 245
