Higgins R.A. Engineering Metallurgy: Applied Physical Metallurgy
Подождите немного. Документ загружается.

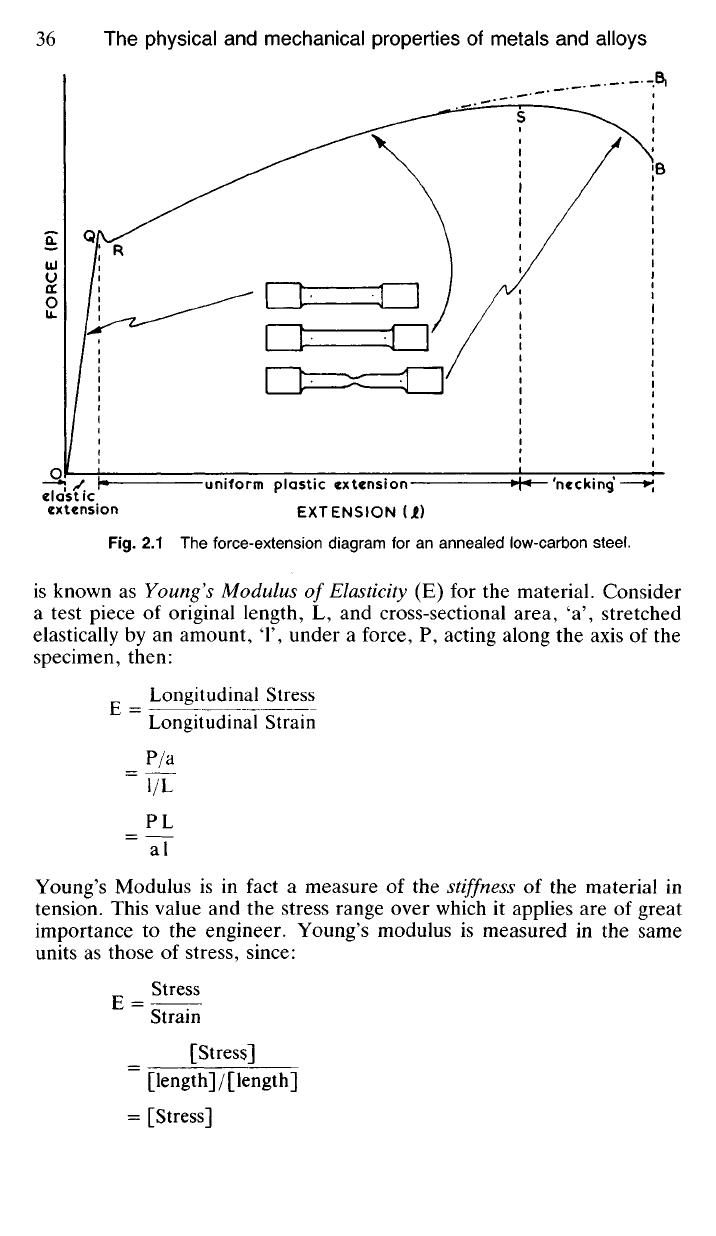
Fig.
2.1 The force-extension diagram for an annealed low-carbon steel.
is known as Young's Modulus of
Elasticity
(E) for the material. Consider
a test piece of original length, L, and cross-sectional area, 'a', stretched
elastically by an amount, T, under a force, P, acting along the axis of the
specimen, then:
Longitudinal Stress
Longitudinal Strain
=
P/a
l/L
_PL
~~aT
Young's Modulus is in fact a measure of the stiffness of the material in
tension. This value and the stress range over which it applies are of great
importance to the engineer. Young's modulus is measured in the same
units as those of stress, since:
_ Stress
E = —
Strain
[Stress]
~ [length]/[length]
= [Stress]
FORCE (P)
elastic
extension
uniform plastic extension
EXTENSION [Jt)
'necking
If at any point on the part of the curve under consideration the force is
relaxed then the test piece will return to its original length, extension so
far being entirely elastic.
2.31 If the test piece is stressed beyond the point O the curve deviates
from its straight-line characteristics. Q is therefore known as the elastic
limit or limit of proportionality and if the force is increased beyond this
point a stage is reached where a sudden extension takes place for no
increase in the applied force (assuming that we are testing a specimen of
annealed low-carbon steel as indicated in Fig. 2.1). An explanation of this
phenomenon, known as the yield point, R, will be given later (8.61). If
the force is now removed the elastic extension will disappear but a small
permanent plastic extension or permanent set will remain.
As the force is increased beyond the point R the test piece stretches
rapidly—first uniformly along its entire length and then locally to form a
'neck'. This 'necking' occurs just after the maximum force value has been
reached at S, and since the cross-section decreases rapidly at the neck, the
force at B required to break the test piece is less than the maximum force
applied at S.
This might be an appropriate moment at which to mention the difference
between a 'force/extension' diagram and a 'stress/strain' diagram since
these terms are often loosely used by both metallurgists and engineers.
Fig. 2.1 clearly represents a force/extension diagram since total force is
plotted against total extension, and, as the force decreases past the point
S, for reasons just mentioned, the decrease is indicated on the diagram.
Stress however is measured as force per unit area of cross-section of the
test-piece and if we wished to plot this we would need to measure the
minimum diameter of the test piece at each increment of applied force.
This would be particularly important for values of force after the point S,
since from S onwards the effective cross-section is decreasing rapidly due
to the formation of the neck. The test piece is only as strong as the force
its minimum diameter will support.
If stress were calculated on this decreasing cross-section the resulting
stress/strain diagram would follow a path indicated by the broken line to
Bi from S onwards. In practice, however, a nominal value of the tensile
strength of a material is calculated using the maximum force (at S) and the
original cross-sectional area of the test piece. Therefore:
Maximum force used
Tensile strength = _ . .—
:
—
Original area or cross-section
In this connection the term 'engineering stress' is often used; it implies the
force at any stage of the loading cycle divided by the original area of
cross-section of the material.
Although tensile strength is a useful guide to the mechanical properties
of a material it is not of paramount importance in engineering design.
After all, the engineer is not particularly interested in a material once it
begins to stretch plastically—unless of course he is a production engineer
engaged in deep-drawing or some other metal-forming process. In the case
of structural or constructional engineering, the elastic limit, Q, will be of
far greater significance than tensile strength.
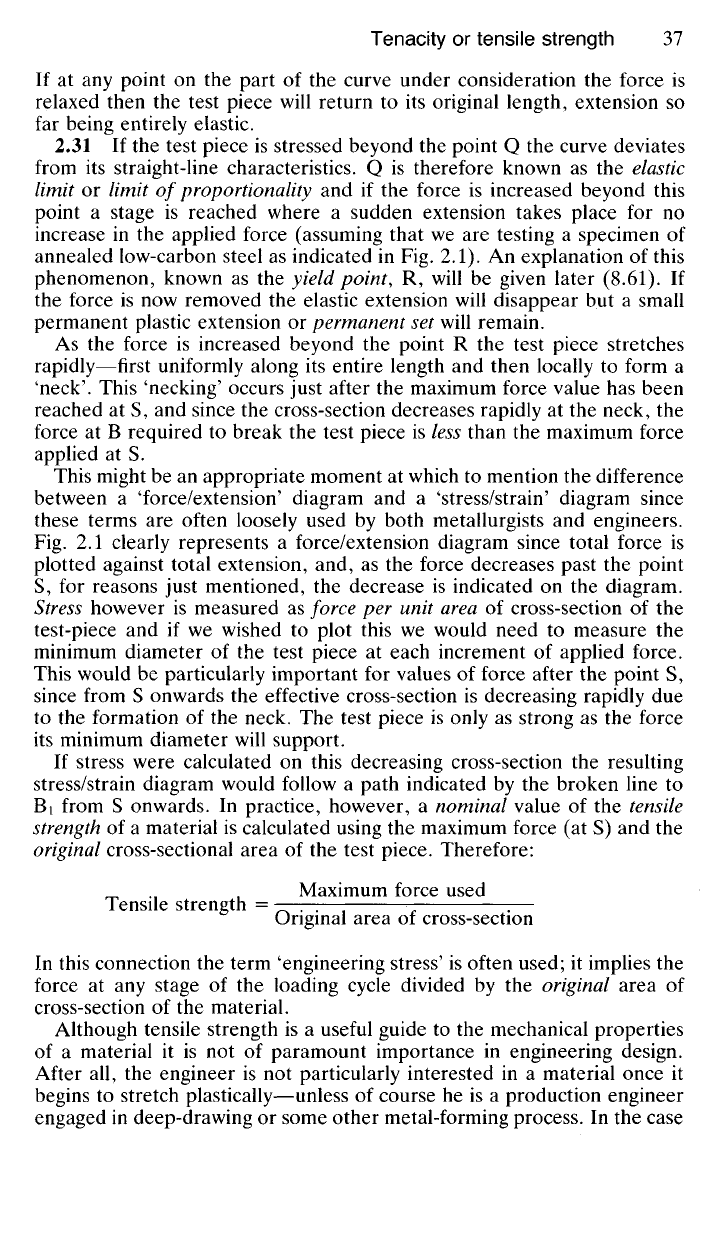
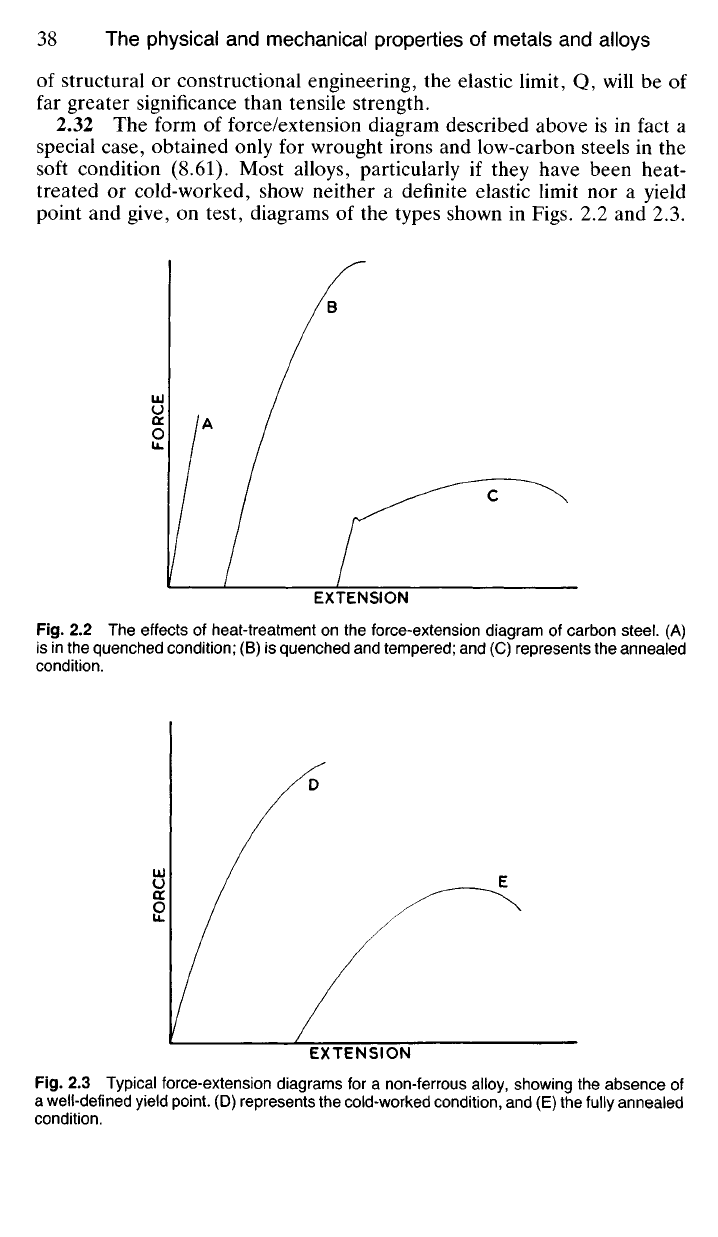
2.32 The form of force/extension diagram described above is in fact a
special case, obtained only for wrought irons and low-carbon steels in the
soft condition (8.61). Most alloys, particularly if they have been heat-
treated or cold-worked, show neither a definite elastic limit nor a yield
point and give, on test, diagrams of the types shown in Figs. 2.2 and 2.3.
FORCE
FORCE
EXTENSION
Fig.
2.2 The effects of heat-treatment on the force-extension diagram of carbon steel. (A)
is in the quenched condition; (B) is quenched and tempered; and (C) represents the annealed
condition.
EXTENSION
Fig.
2.3 Typical force-extension diagrams for a non-ferrous alloy, showing the absence of
a well-defined yield point. (D) represents the cold-worked condition, and (E) the fully annealed
condition.
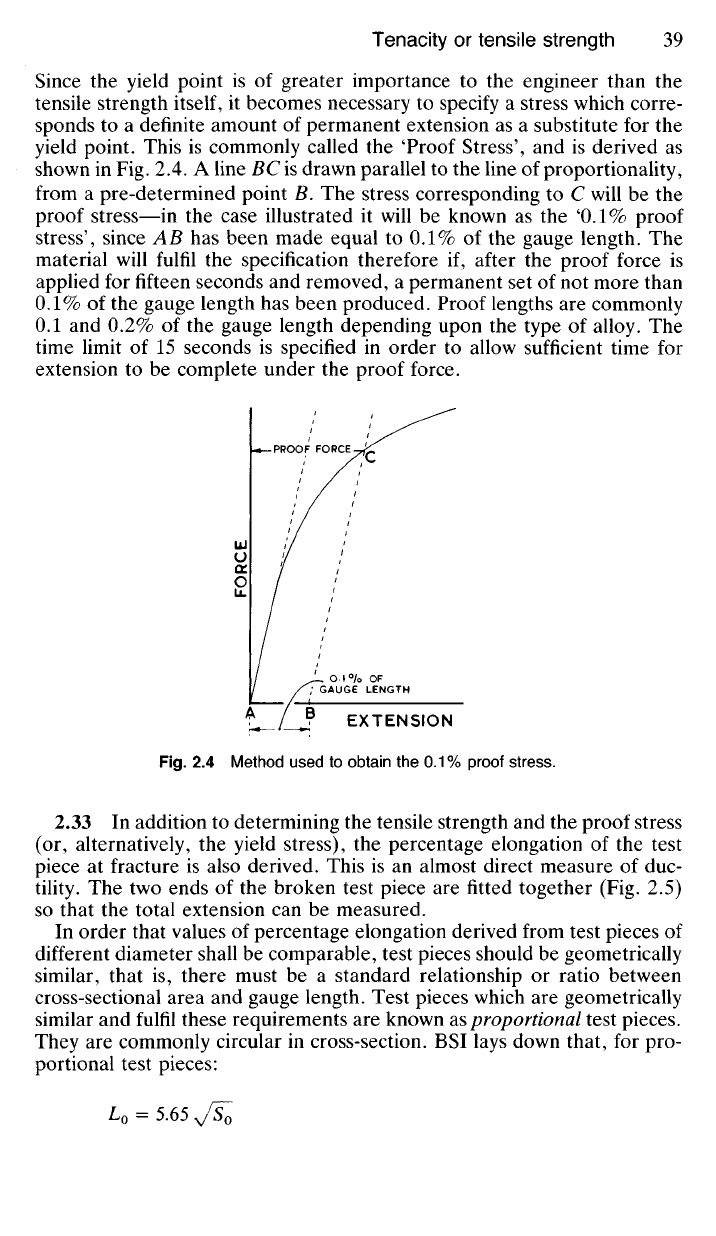
Since the yield point is of greater importance to the engineer than the
tensile strength
itself,
it becomes necessary to specify a stress which corre-
sponds to a definite amount of permanent extension as a substitute for the
yield point. This is commonly called the 'Proof Stress', and is derived as
shown in Fig. 2.4. A line BC is drawn parallel to the line of proportionality,
from a pre-determined point B. The stress corresponding to C will be the
proof stress—in the case illustrated it will be known as the '0.1% proof
stress',
since AB has been made equal to 0.1% of the gauge length. The
material will fulfil the specification therefore if, after the proof force is
applied for fifteen seconds and removed, a permanent set of not more than
0.1%
of the gauge length has been produced. Proof lengths are commonly
0.1 and 0.2% of the gauge length depending upon the type of alloy. The
time limit of 15 seconds is specified in order to allow sufficient time for
extension to be complete under the proof force.
Fig.
2.4 Method used to obtain the 0.1 % proof stress.
2.33 In addition to determining the tensile strength and the proof stress
(or, alternatively, the yield stress), the percentage elongation of the test
piece at fracture is also derived. This is an almost direct measure of duc-
tility. The two ends of the broken test piece are fitted together (Fig. 2.5)
so that the total extension can be measured.
In order that values of percentage elongation derived from test pieces of
different diameter shall be comparable, test pieces should be geometrically
similar, that is, there must be a standard relationship or ratio between
cross-sectional area and gauge length. Test pieces which are geometrically
similar and fulfil these requirements are known as proportional test pieces.
They are commonly circular in cross-section. BSI lays down that, for pro-
portional test pieces:
FORCE
PROOF FORCE
O l°/o OF
GAUGE LENGTH
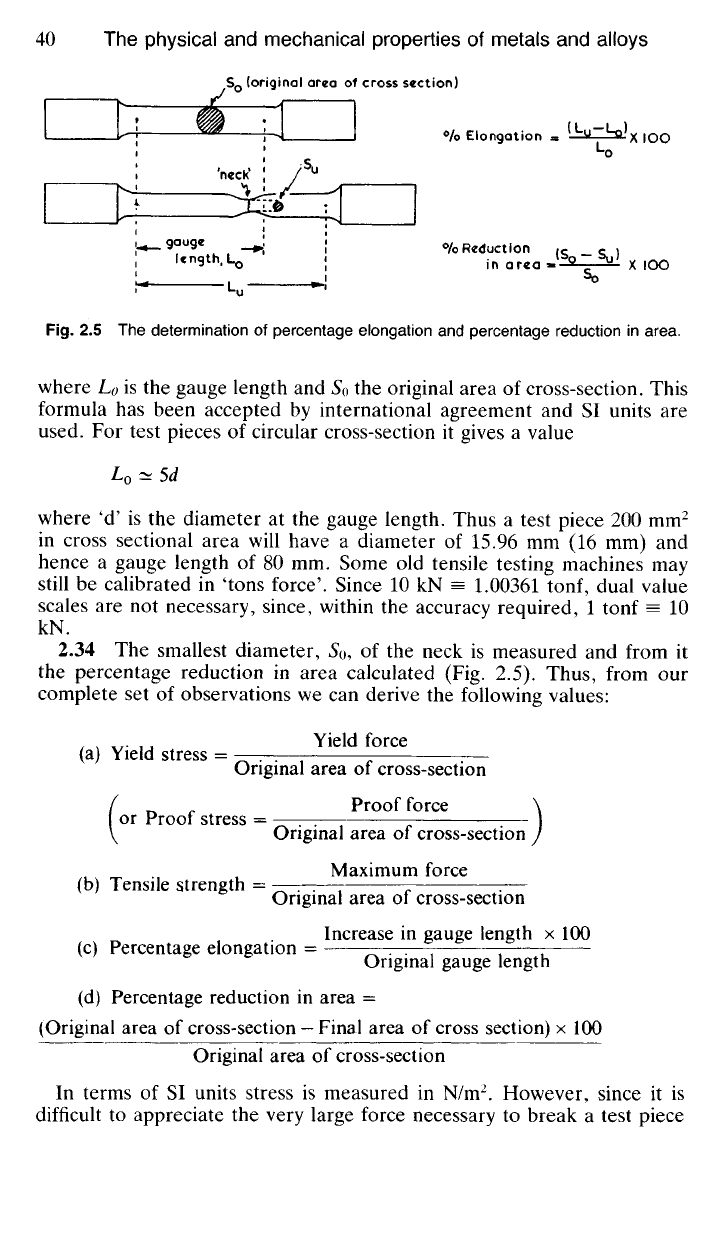
Fig.
2.5 The
determination
of
percentage elongation
and
percentage reduction
in
area.
where L
0
is the gauge length and So the original area of cross-section. This
formula has been accepted by international agreement and SI units are
used. For test pieces of circular cross-section it gives a value
L
0
^ 5d
where 'd' is the diameter at the gauge length. Thus a test piece 200 mm
2
in cross sectional area will have a diameter of 15.96 mm (16 mm) and
hence a gauge length of 80 mm. Some old tensile testing machines may
still be calibrated in 'tons force'. Since 10 kN =
1.00361
tonf,
dual value
scales are not necessary, since, within the accuracy required, 1 tonf = 10
kN.
2.34 The smallest diameter, S
0
, of the neck is measured and from it
the percentage reduction in area calculated (Fig. 2.5). Thus, from our
complete set of observations we can derive the following values:
,,,.,.,.
Yield force
(a) Yield stress = . .
:
—
Original area of cross-section
/
Proof force \
or Proof stress =
:
\
Original area of cross-section J
Maximum force
(b) Tensile strength = ——— -
c
:—
Original area of cross-section
Increase in gauge length x 100
(c) Percentage elongation =
—
——
Original gauge length
(d) Percentage reduction in area =
(Original area of cross-section
—
Final area of cross section) x 100
Original area of cross-section
In terms of SI units stress is measured in N/m
2
. However, since it is
difficult to appreciate the very large force necessary to break a test piece
S
0
(original area
of
cross section)
'neck'
gauge
length,
L
0
°/o
Elongation
°/o
Reduction
in area
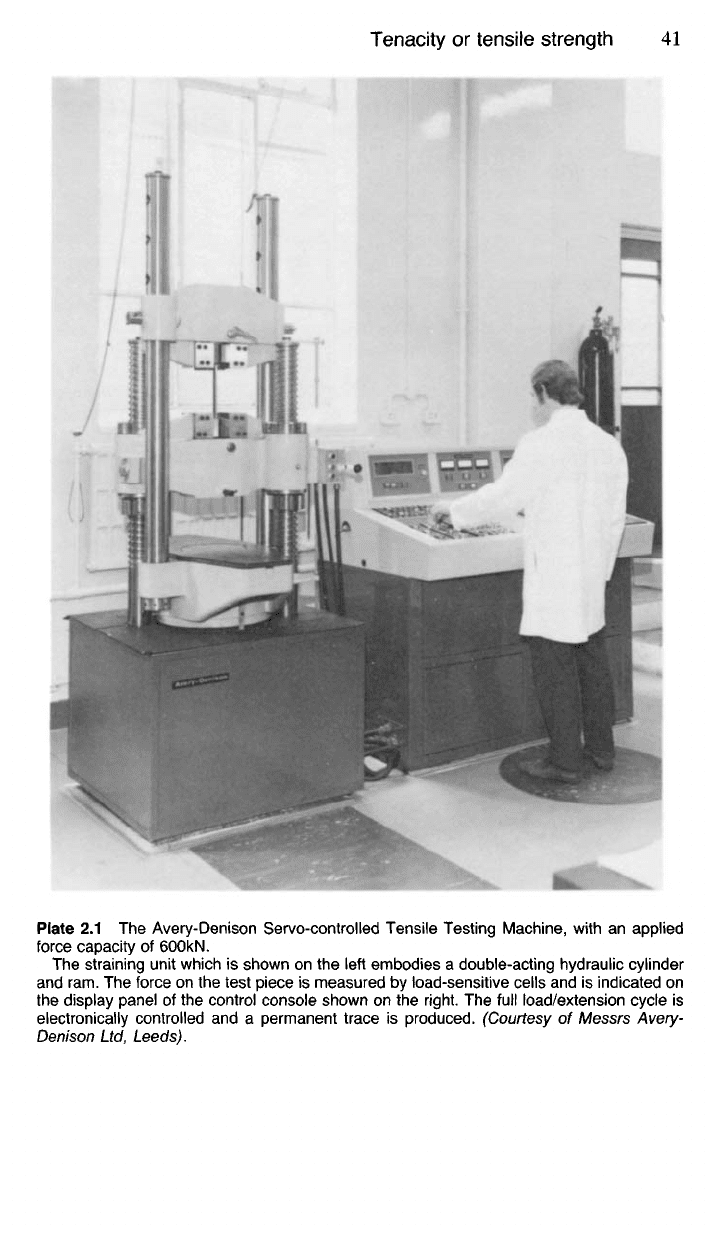
Plate 2.1 The Avery-Denison Servo-controlled Tensile Testing Machine, with an applied
force capacity of 60OkN.
The straining unit which is shown on the left embodies a double-acting hydraulic cylinder
and ram. The force on the test piece is measured by load-sensitive cells and is indicated on
the display panel of the control console shown on the right. The full load/extension cycle is
electronically controlled and a permanent trace is produced. (Courtesy of Messrs Avery-
Denison Ltd, Leeds).
of one square metre in cross-section, most bodies, including BSI, quote
tensile stress in metals in N/mm
2
. This at least enables the student to relate
the tensile strength of a steel to the force necessary to break in tension
one of the thicker steel strings on his guitar.
2.35 Early tensile-testing machines were of the simple beam type in
which the applied force was magnified by using a first-order lever system.
With such machines an accurate evaluation of extension was possible up to
the elastic limit by using a sensitive extensometer but beyond the maximum
force, determinations of force/extension characteristics were impossible
because the test piece fractured quickly as soon as necking began, there
being no means of relaxing the applied force rapidly enough. Modern
machines however are usually servo-hydraulically loaded (Plate 2.1) so that
a complete force/extension relationship can be obtained. Since advanced
computer control technology is now employed automatic calculation of
proof stress, yield stress, ultimate tensile stress and percentage elongation
are carried out; whilst software is available for cycling and data storage.
Software programs can be written to meet other specific requirements.
These machines can also be used for compression and transverse testing,
and vary in size between large machines with a capacity of 1300 kN and
small bench models having a capacity of only 20 kN.
2.36. In situations where a large amount of energy is being expended
against gravity as in various types of aero-space travel—or even driving
the humble 'tin Lizzie' up a hill—it becomes necessary to relate the tensile
properties of a material to its relative density. Thus, what used to be called
the 'strength-to-weight ratio' became important in the design of both land
and air transport vehicles. In modern terminology this became 'specific
strength'. Thus:
.„ , Tensile strength of material
Specific strength = —
Relative density of material
When stiffness is the prime consideration, however, Young's Modulus of
Elasticity is a more appropriate guide to the required properties and a
value termed specific modulus is now generally accepted as being relevant,
ie—
Young's modulus of elasticity
Specific modulus of elasticity =
iTTT-—"A
%
Relative density
Hardness Tests
2.40 Classically, hardness could be defined as the resistance of a surface
to abrasion, and early attempts to measure surface hardness were based
on this concept. Thus in the Turner Sclerometer a loaded diamond point
was drawn across the surface of the test piece and the load increased until
a visible scratch was produced. In Moh's Scale—still used to evaluate the
hardness of minerals—substances were arranged in order of hardness such
that any material in the scale would scratch any material listed below it.
Thus diamond (with a hardness index of 10) heads the list whilst talc (with
an index of 1) is at the foot of the scale.
Whilst such methods undoubtedly reflect a true concept of the funda-
mental meaning of hardness, they have been abandoned in favour of
methods which are capable of greater accuracy but in which the resistance
of the surface layers to plastic deformation under static pressure is
measured rather than true hardness. In most of these methods the static
force used is divided by the numerical value of the surface area of the
resulting impression to give the hardness index.
2.41 The Brinell Test, probably the best known of the hardness tests,
was devised by a Swede, Dr. Johan August Brinell in 1900. In this test a
hardened steel ball is pressed into the surface of the test piece using the
appropriate specified force. The diameter of the impression so produced
is then measured and the Brinell Hardness Number, H
By
derived from:
Force, P
B
Surface area of impression
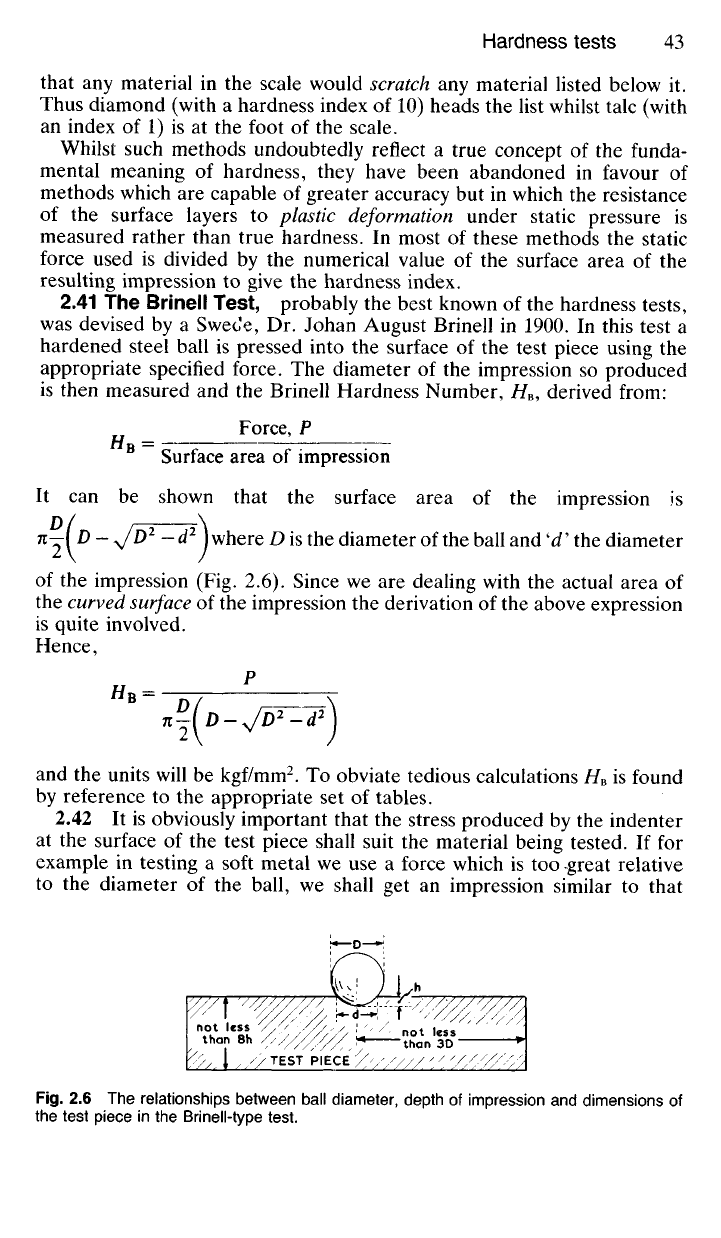
It can be shown that the surface area of the impression is
n—l D - yJD
2
- d
2
j where D is the diameter of the ball and 'd' the diameter
of the impression (Fig. 2.6). Since we are dealing with the actual area of
the curved surface of the impression the derivation of the above expression
is quite involved.
Hence,
and the units will be kgf/mm
2
. To obviate tedious calculations H
B
is found
by reference to the appropriate set of tables.
2.42 It is obviously important that the stress produced by the indenter
at the surface of the test piece shall suit the material being tested. If for
example in testing a soft metal we use a force which is too great relative
to the diameter of the ball, we shall get an impression similar to that
Fig.
2.6 The relationships between ball diameter, depth of impression and dimensions of
the test piece in the Brinell-type test.
not less
than 8h
TEST PIECE
not less
than 3D
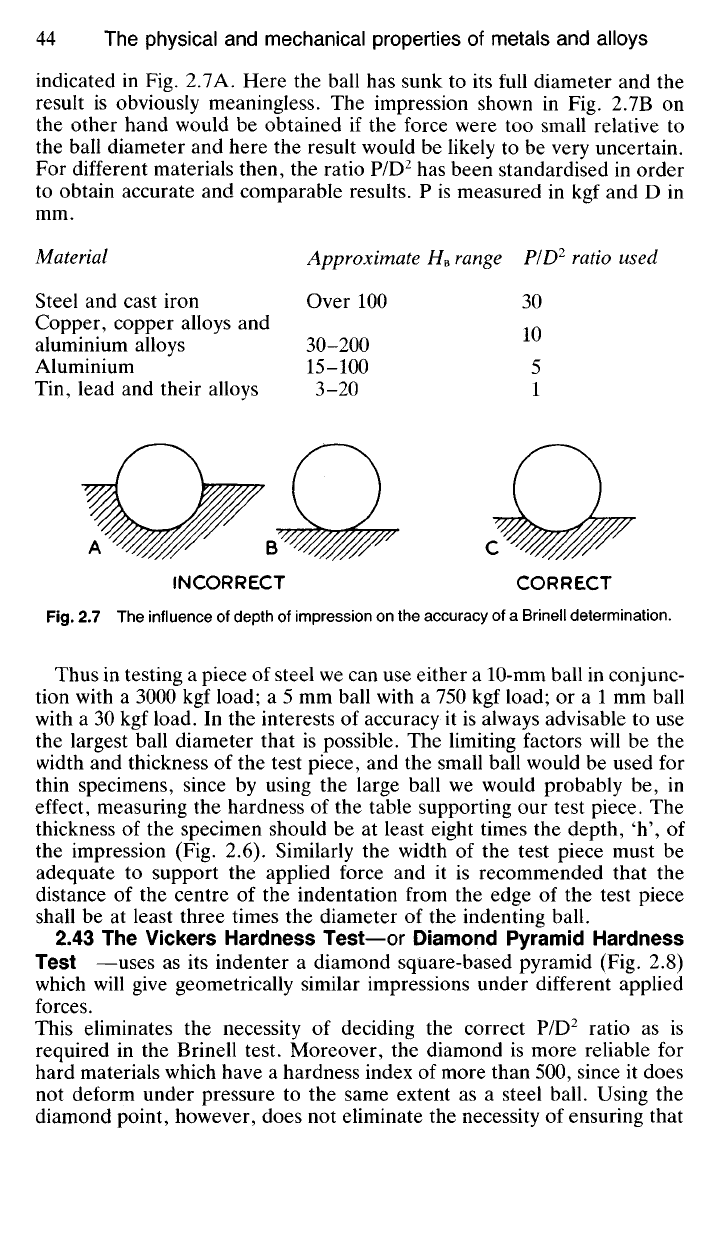
indicated in Fig. 2.7A. Here the ball has sunk to its full diameter and the
result is obviously meaningless. The impression shown in Fig. 2.7B on
the other hand would be obtained if the force were too small relative to
the ball diameter and here the result would be likely to be very uncertain.
For different materials then, the ratio P/D
2
has been standardised in order
to obtain accurate and comparable results. P is measured in kgf and D in
mm.
Material Approximate H
B
range PID
2
ratio used
Steel and cast iron Over 100 30
Copper, copper alloys and .~
aluminium alloys 30-200
Aluminium 15-100 5
Tin, lead and their alloys 3-20 1
INCORRECT CORRECT
Fig.
2.7 The influence of depth of impression on the accuracy of a Brinell determination.
Thus in testing a piece of steel we can use either a 10-mm ball in conjunc-
tion with a 3000 kgf load; a 5 mm ball with a 750 kgf load; or a 1 mm ball
with a 30 kgf load. In the interests of accuracy it is always advisable to use
the largest ball diameter that is possible. The limiting factors will be the
width and thickness of the test piece, and the small ball would be used for
thin specimens, since by using the large ball we would probably be, in
effect, measuring the hardness of the table supporting our test piece. The
thickness of the specimen should be at least eight times the depth, 'h', of
the impression (Fig. 2.6). Similarly the width of the test piece must be
adequate to support the applied force and it is recommended that the
distance of the centre of the indentation from the edge of the test piece
shall be at least three times the diameter of the indenting ball.
2.43 The Vickers Hardness Test—or Diamond Pyramid Hardness
Test —uses as its indenter a diamond square-based pyramid (Fig. 2.8)
which will give geometrically similar impressions under different applied
forces.
This eliminates the necessity of deciding the correct P/D
2
ratio as is
required in the Brinell test. Moreover, the diamond is more reliable for
hard materials which have a hardness index of more than 500, since it does
not deform under pressure to the same extent as a steel ball. Using the
diamond point, however, does not eliminate the necessity of ensuring that
A
B C
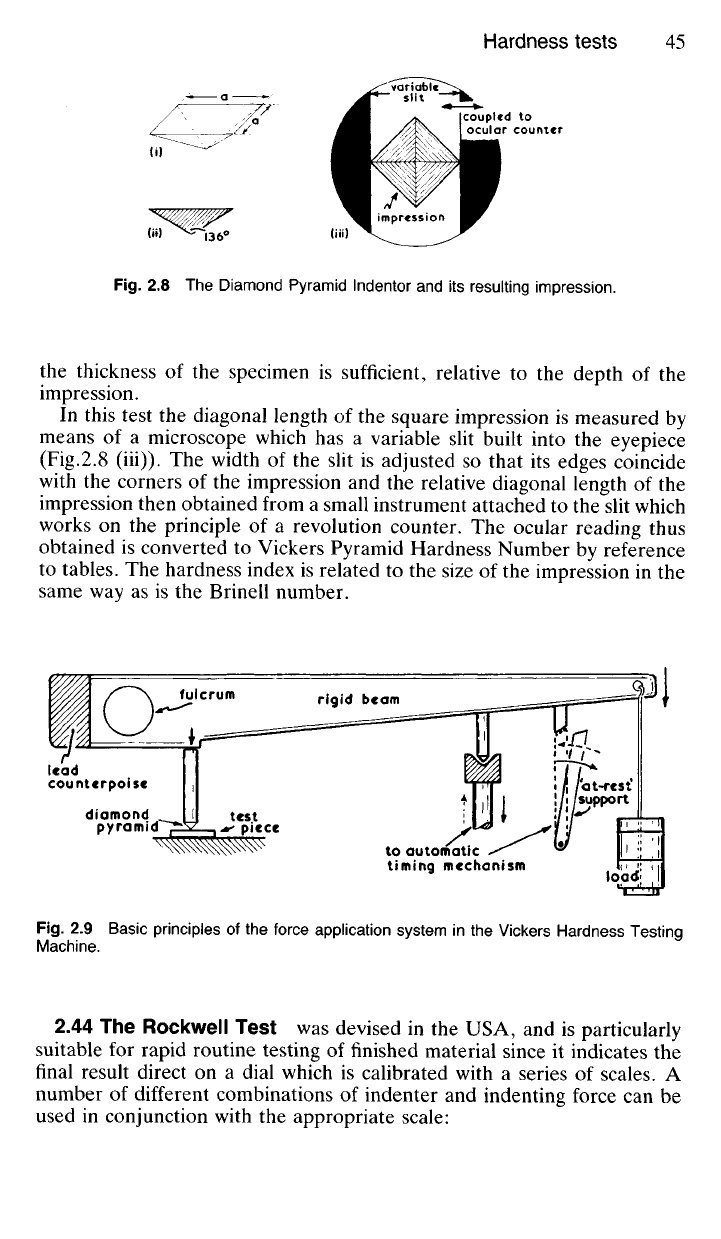
Fig.
2.8 The Diamond Pyramid lndentor and its resulting impression.
the thickness of the specimen is sufficient, relative to the depth of the
impression.
In this test the diagonal length of the square impression is measured by
means of a microscope which has a variable slit built into the eyepiece
(Fig.2.8 (iii)). The width of the slit is adjusted so that its edges coincide
with the corners of the impression and the relative diagonal length of the
impression then obtained from a small instrument attached to the slit which
works on the principle of a revolution counter. The ocular reading thus
obtained is converted to Vickers Pyramid Hardness Number by reference
to tables. The hardness index is related to the size of the impression in the
same way as is the Brinell number.
Fig.
2.9 Basic principles of the force application system in the Vickers Hardness Testing
Machine.
2.44 The Rockwell Test was devised in the USA, and is particularly
suitable for rapid routine testing of finished material since it indicates the
final result direct on a dial which is calibrated with a series of scales. A
number of different combinations of indenter and indenting force can be
used in conjunction with the appropriate scale:
fulcrum
rigid beam
lead
counterpoise
diamond .
pyramid
test
piece
to automatic
timing mechanism
at-rest'
support
load
variable
slit
coupled
to
ocular counter
impression
(iii)
(i)
(i»)