Hawkes P.W., Spence J.C.H. (Eds.) Science of Microscopy. V.1 and 2
Подождите немного. Документ загружается.

Chapter 3 Scanning Electron Microscopy 205
In life sciences, application of SEM mainly for morphological studies
is also widespread and started when commercial SEMs became avail-
able in the late 1960s (see, e.g., Pfefferkorn and Pfautsch, 1971). However,
in life sciences SEM is used less than TEM. Table 3–8 provides a survey
of the specimens and information that can be obtained by SEM. Engi-
neered biomaterials and tissues are becoming increasingly important
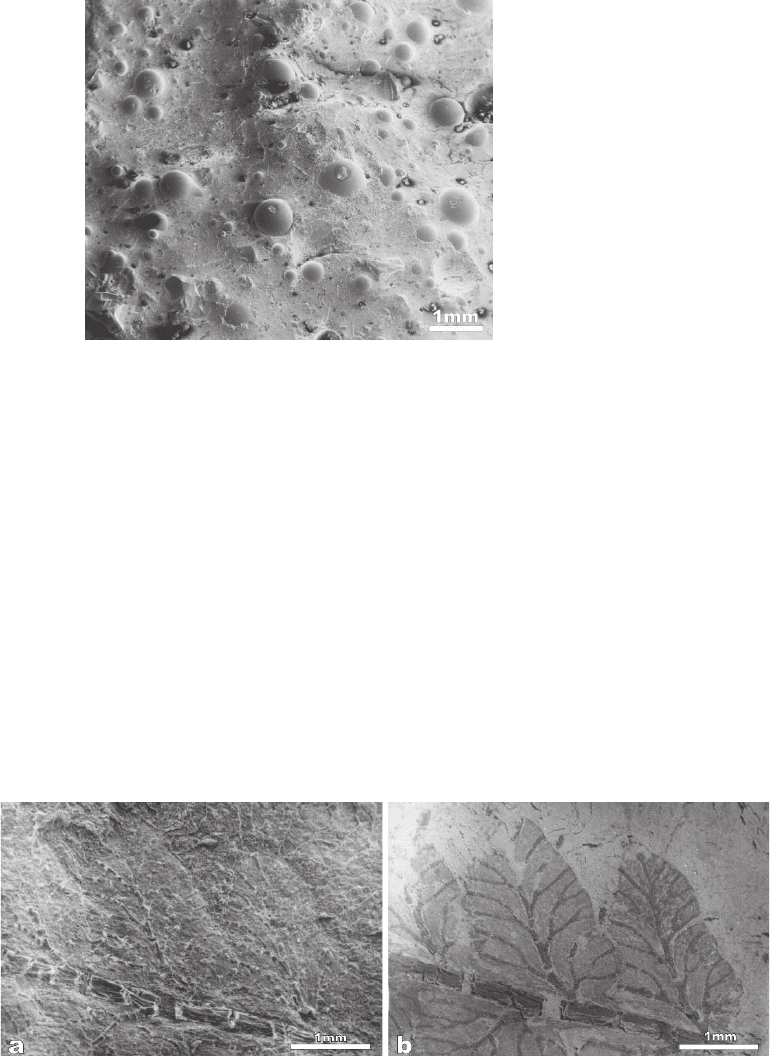
Figure 3–33. Secondary electron micrograph of the material of white lines,
dividing the opposite lanes on roads, used to refl ect the light from the head-
lights of cars. Some of the light-refl ecting glass spheres are damaged or
snatched off (their original positions can be recognized by sphere-like inden-
tations). For safety reasons protruding sharp-edged particles are embedded
in the material (e.g., at the bottom left corner) to generate a high friction
between the tire and the white line. The sample is sputter coated with gold.
(Micrograph kindly provided by Rudolf Göcke, Institut für Medizinische
Physik und Biophysik, Münster, Germany.)
Figure 3–34. Secondary electron (a) and backscattered electron (b) micrograph of carbonized fossil
remains of a fern bot embedded in clay. The sample is coated with a very thin carbon fi lm. The contrast
in the SE image is caused by the topography, whereas the BSE image shows a distinct atomic number
contrast. The carbonized fossil remains appear dark due to the lower mean atomic number surrounded
by bright areas of clay. (Micrographs kindly provided by Rudolf Göcke, Institut für Medizinische
Physik and Biophysik, Münster, Germany.)

206 R. Reichelt
in biomedical practice and it has become clear that cellular responses
to materials depend on structural properties of the material at both the
micrometer and nanometer scale. SEM is one of several methods for
controlling material properties on both of these scales and thus it is
increasingly used to study those materials.
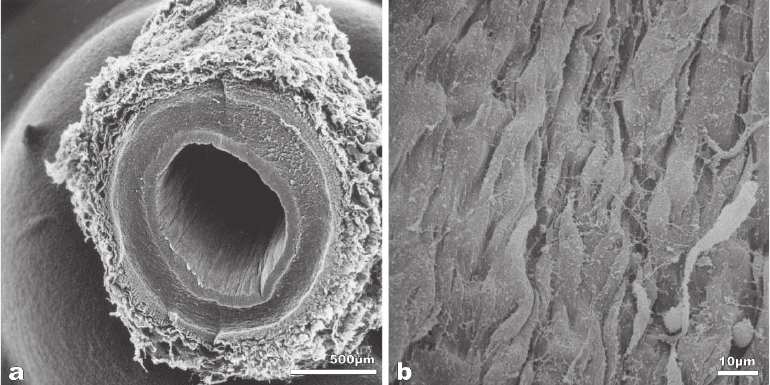
Scanning electron microscopy can be used for comparative morpho-
logical studies of tissues as demonstrated by the application in cardio-
vascular surgery to detect endothelial damage caused by skeletonization
(Rukosujew et al., 2004). In cardiovascular surgery, the radial artery is
increasingly used for myocardial revascularization because of its pre-
sumed advantageous long-term patency rates. The vessel can be har-
vested as a pedicle or skeletonized. The SEM reveals the endothelial
morphology (cf. Figure 3–35), and thus allows comparison of the skele-
tonization technique with pedicle preparation using either an ultrasonic
scalpel or scissors.
Table 3 –8. SEM applications on specimens from life sciences.
a
Specimen Information
Bones, teeth, dentin, cartilage, At the specimen surface:
hairs, fi ngernails, toenails Morphology; ultrastructure, pathological alterations of
ultrastructure, microstructure, roughness; cracks; fi ssures;
fractures; elemental composition
Inside the specimen:
Three-dimensional microstructure; cracks; fi ssures; elemental
composition
Biominerals, e.g., gallstone, At the specimen surface:
kidney stone, tartar, Morphology; microstructure, cracks; fi ssures; fractures; grain
calcifi cation size and shape; size and shape of small particles; elemental
composition
Inside the specimen:
Grain size and shape; microstructure; cracks, fi ssures;
material inclusions; cavities; elemental composition
Soft tissues cells, bacteria At the specimen surface:
Morphology; topography (three-dimensional); roughness;
ultrastructure; pathological alterations of ultrastructure; size
and shape of cells and bacteria; elemental composition
Inside the specimen:
Ultrastructure; pathological alterations of ultrastructure;
elemental composition
Biomaterials, implants, Morphology; biocompatibility; biostability; ultrastructure of
prostheses and degradation mechanisms at the bone–implant interface;
mineral apposition; cell and tissue apposition; adsorption
behaviors of fi brinogen, albumin, and fresh plasma on
implants for the cardiac–vascular systems; fault diagnosis of
prostheses; failure analysis after loading tests in simulator;
wear of prostheses; surface erosion of prostheses after use
a
State-of-the-art preparation and image analysis techniques are required to take full advantage of the capabilities
of SEM.
Chapter 3 Scanning Electron Microscopy 207
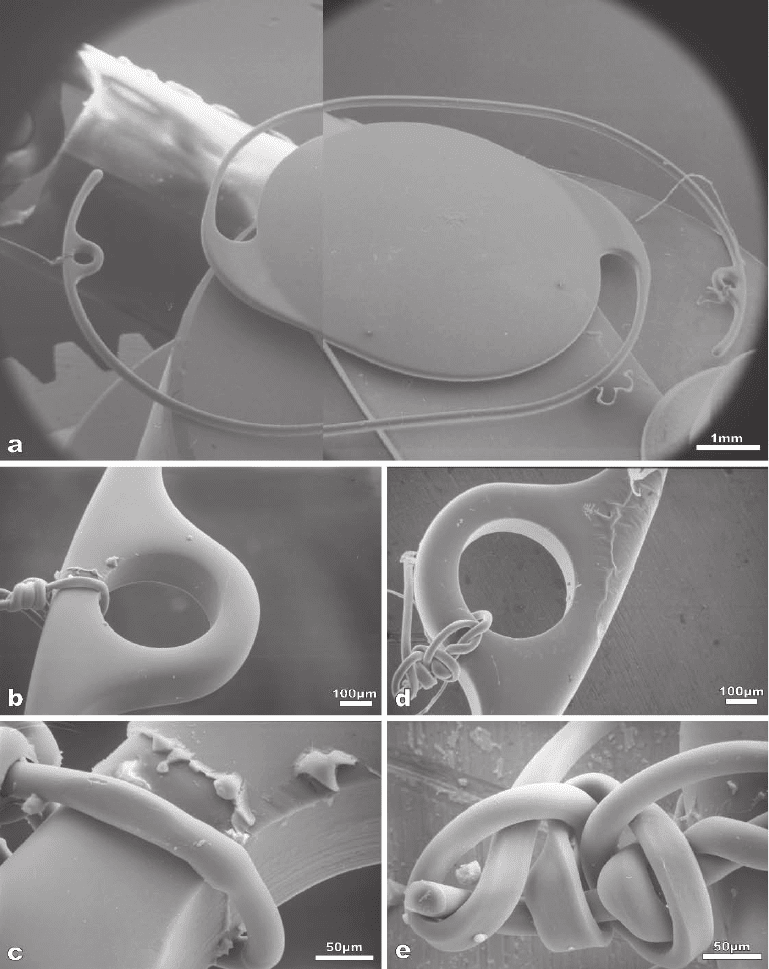
Investigation of implants is a strongly growing fi eld, where scanning
electron microscopy is an indispensable tool. Figure 3–36 shows an
example from ophthalmology where a technique for knotting a suture
to the haptic of an intraocular lens is used for its fi rm fi xation onto the
sclera to avoid postoperative dislocation. Because of the large depth of
focus and the distinct topographic contrast in the secondary electron
micrograph, which conveys a pseudo three-dimensional and detailed
view, the SEM allows checking as to the extent to which the haptic and
suture can be damaged by knotting. Moreover, the quality of knots can
be studied.
Microtechnology and “microelectromechanical systems” (MEMS)
are additional fi elds in which SEM is used as a tool for monitoring
processes, detecting defects, or measuring sizes and distances, e.g., in
micromachines and micromechanical or micromachining processes
(see, e.g., Ishikawa et al., 1993; Aoyagi, 2002; Hernandez-Lopez et al.,
2003; Khamsehpour and Davies, 2004).
The acquisition of quantitative data about the third dimension
(stereo, 3D) of surfaces and interior specimen structures was previ-
ously mentioned (see Sections 2.14, 2.15, and 2.4). In general, this
requires digital image analysis, specifi c instrumentation for the SEM
(e.g., specimen stage, detectors), and special specimen preparation
(e.g., ultramicrotome, IBSC, FIB). Recently, interesting applications of
3D morphometry for accurate dimensional and angular measurements
of microstructures (Minnich et al., 1999, 2000) and of volumetric mea-
surements (Chan et al., 2004) were shown using stereopaired images
and digital image analysis.
Figure 3–35. Secondary electron micrograph of the cross-sectioned radial artery at low magnifi cation
(a) and of the endothelial cells at medium magnifi cation (b). The vessel was critical point dried and
sputter coated with gold.
208 R. Reichelt
Figure 3–36. Secondary electron micrographs of a poly(methyl methacrylate) (PMMA) intraocular
lens (IOL) with knots from 10-0 polypropylene (Prolene) on the haptic recorded at different magnifi ca-
tions. (a) Whole IOL with the haptic and the fi xated sutures; (b–e) Detailed views to the haptic and
knots, respectively, showing some minor damage. The IOL is sputter coated with gold and imaged at
25 kV.
Chapter 3 Scanning Electron Microscopy 209
3 Field Emission Scanning Electron Microscopy
The diameter of the electron beam at the specimen surface sets a fun-
damental lower limit to the signal localization and, therefore, also to
the resolution, which can potentially be obtained. As discussed in
Section 2.2 and shown in Figures 3–13 and 3–14, the SE and BSE are
emitted from a surface area, which commonly is much larger than the
beam diameter at the specimen surface. The large emitting area is
caused by multiple elastic and inelastic electron scattering events
within the excitation volume, whose size depends on the specimen
composition and energy of the beam electrons. Only the SE1 and BSE1
generated as the beam enters the specimen carry local information,
while the SE2 and BSE2 carry information about the larger region sur-
rounding the point of beam entrance (cf. Figure 3–14). High-resolution
information can be obtained from SE1 and BSE1 generated by an elec-
tron probe with a diameter at the specimen surface of about 1 nm or
even less. A probe of that small size can be achieved by using fi eld
emission electron sources, electromagnetic lenses with low aberration
coeffi cients (cf. Eqs. 2.7, 2.8, and 2.10), and both highly stabilized accel-
eration voltage (cf. Eq. 2.8) and objective lens current. High-resolution
scanning electron microscopy at conventional acceleration voltages—
that is 5–30 kV—will be treated in Section 3.1. Alternatively, high-
resolution information, in principle, can also be achieved when the
excitation volume is reduced to a size similar to the SE1 and BSE1 emit-
ting area by using low-energy beam electrons. By defi nition, electrons
below 5 keV are considered low-energy beam electrons and, conse-
quently, scanning electron microscopy at low energies is called scan-
ning low-energy electron microscopy or low (acceleration)-voltage
scanning electron microscopy (LVSEM). This type of scanning electron
microscopy will be treated in Section 3.2. However, the majority of
commercial high-resolution SEMs are capable of operation at both con-
ventional energies, i.e., from 5 to usually 30 keV, and at low energies,
i.e., below 5 keV down to usually 0.5 keV.
3.1 High-Resolution Scanning Electron Microscopy
3.1.1 Electron Guns
Three different types of electron guns are suitable sources for high-
the so-called Schottky emission cathode (SEC). The characteristic
parameters of the different electron guns are listed in Table 3–1.
Schottky emission cathodes are of the ZrO/W(100) type—also called
ZrO/W(100) thermal fi eld emitter (TFE)—and have a tip radius of
0.6–1 µm (Tuggle and Swanson, 1985). The work function of the TFE is
lowered to about 2.8 eV. In operation the SEC is heated to about 1800 K
and electrons are extracted by a high electric fi eld, which lowers the
potential barrier (Schottky effect). The SEC brightness is about three
orders of magnitude higher and the energy spread of the emitted elec-
trons is about a factor of 2 lower than those for the thermionic W-
resolution SEM: the cold fi eld emission gun (FEG), the hot FEG, and
210 R. Reichelt
cathode. Presently, the SEC in commercial high-resolution SEM is less
frequently an electron source than the FEG.
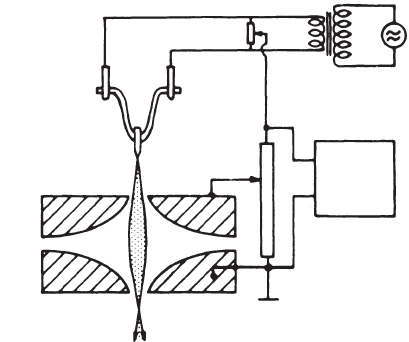
The FEG usually consists of a very sharp [100] or [321] oriented
tungsten single crystal and two anodes in front, which extract
(fi rst anode) and accelerate or decelerate (second anode) the electrons
by the electric fi eld to a fi nal energy E
0
= eU (Figure 3–37). Caused by
the small tip radius r, which is in the range of 10 to about 50 nm, the
electric fi eld strength amounts to at least 10
8
V/c m with an extraction
voltage of approximately 4–5 kV applied between the fi rst anode
and the tip. Due to the high fi eld strength at the tip the width of the
potential barrier is signifi cantly reduced and fi eld emissions take place.
The fi eld emission current density j
c
is described by the Fowler–Nord-
heim equation
j
c
= c
1
|E|
2
/Φ exp(−c
2
Φ
3/2
/|E|) (3.1)
where |E| ≈ U
1
/r, c
1
and c
2
depend weakly on |E|, and Φ is the work
function of tungsten. The density j
c
depends strongly on |E|, and E can
be varied by U
1
. The so-called cold FEG (CFEG) is operated at room
temperature and generates a current density of typically 2 × 10
5
A cm
−2
.
However, after several hours of work adsorbed gas layers have to be
removed by short heating to about 2500 K (fl ashing), otherwise the
emission current becomes very unstable. The distinct advantage of the
cold FEG is the low-energy spread.
The hot FEG (HFEG) is operated at approximately 1800 K, which
increases the energy spread to about twice that from the cold FEG. The
current density is higher than for the cold FEG and typically amounts
to 5 × 10
6
A cm
−2
. The advantage of the hot FEG is the less noisy emis-
sion current.
Anode
2nd
1st
U
1
U
H
U=
1-50 kV
–
+
Figure 3–37. Schematic drawing of the fi eld emission gun with an electrolyti-
cally polished sharp monocrystalline tungsten tip. The hot FEG operates the
tip at high temperature heated by the applied voltage U
H
. U, acceleration
voltage; U
1
, extraction voltage. [Adapted from Reimer (1993); with kind
permission of the International Society of Optical Engineering (SPIE),
Bellingham, WA.]
Chapter 3 Scanning Electron Microscopy 211
Field emission guns require ultrahigh vacuum in the order of 10
−8
–
10
−9
Pa in the gun chamber, which is generated by ion getter pumps.
This means that SEMs equipped with an FEG need a sophisticated and
consequently cost-intensive vacuum system. Another disadvantage of
FEGs compared to the thermionic W-cathode is their signifi cantly
lower short- and long-time beam current stability.
3.1.2 Electron Lenses
Electron lenses are used to demagnify the virtual source size, which
amounts to 3–5 nm for both the cold and hot FEG, and about 20–30 nm
for the SEG. To obtain and electron beam diameter of about 1 nm or
less a demagnifi cation of only 10–100× is required in contrast to up to
about 5000× for the thermionic emission triode gun (cf. Section 2.1.2).
To achieve the smallest effective electron probe diameter, the spherical
and the chromatic aberration constants have to be as small as possible
[see Eqs. (2.7), (2.8), and (2.10)]. In the conventional SEM usually large
working distances ranging from about 10 to 40 mm are used. Typical
values of the spherical aberration constant C
s
are 10–20 mm. Since C
s
increases strongly with increasing WD (C
s
∼ WD
3
) suffi ciently small
values of C
s
∼ 1–2 mm can be achieved only with very short WD, i.e.,
the focus of the electron beam has to be inside (so-called “in-lens”
type) or very close to the objective lens [frequently called “semi-in-
lens” with a snorkel-type conical objective lens (Mulvey, 1974)]. The
chromatic aberration constant C
c
corresponds approximately to the
focal length of the objective lens for large WD, i.e., also the chromatic
aberration is strongly lowered at a very short WD. The shortest WD of
the “in-lens” type SEM is about 2.5 mm in order to secure a specimen
traverse in the x and y direction perpendicular to the optical axis as
well as specimen tilt angles up to a maximum of |±15°|. Larger tilt
angles obviously require a larger work distance. To obtain the minimum
effective electron probe diameter under these conditions, the optimum
aperture α
opt
has to be used [see Eq. (2.11)]. Presently, the highest reso-
lution obtained with the “in-lens” type FESEM at 30 keV using a test
3.1.3 Detectors and Detection Geometries
The detectors used in fi eld emission scanning electron microscopes
(FESEM) have been described in Section 2.1.3.1. The detection geome-
try depends on the particular type of the FESEM. The instruments
using the conventional specimen position outside the objective lens
(“out-lens”), i.e., the WD is in the range of about 5–30 mm, are com-
monly equipped with an ET detector located laterally above the speci-
men and a BSE detector located centrally above the specimen. The
“semi-in-lens” instruments, where the specimen is outside but
immersed in the fi eld of the objective lens, usually have both the detec-
tor arrangement of the “out-lens” type SEM and the “through-the-lens”
detection, thus combining the advantages of both detection geometries.
The “in-lens” type SEM is restricted to “through-the-lens” detection
(cf. Section 2.1.3.2).
sample amounts to 0.4 nm (Hitachi, 2001).
212 R. Reichelt
3.1.4 Specimen Stages
The purpose of the specimen stage in high-resolution scanning elec-
tron microscopes is of course the same as in conventional SEM, i.e., the
stage has to allow for precise backlash-free movement, tilting, and pos-
sibly rotation of the sample during the investigation. As for conven-
tional SEM, there are optionally special specimen stages available that
allow investigations of the specimen at elevated temperature, during
different types of mechanical deformation, at positive or negative bias,
and last at low temperature. Independent on the special type of speci-
men stage, a higher stability in terms of mechanical vibrations as well
as mechanical or thermal drift is required to avoid any deterioration
of the performance of the high-resolution SEM. The “in-lens”-type
SEMs use side-entry specimen holders, which are almost identical to
the ones used in TEMs (cf. Section 2.1.4). However, the limited space
available in this type of SEM places some restrictions on the specimen
stage for the ultimate resolution of “in-lens”-type FESEM.
3.1.5 Contrast Formation and Resolution
At high beam energy, e.g., 30 keV, the lateral extension of the excitation
volume in the specimen is for carbon approximately 10 µm and for a
high atomic number element such as gold about 1 µm (cf. Figure 3–13).
Secondary and backscattered electrons are emitted from a surface area
of the specimen, which corresponds in size to about the lateral exten-
sion of the excitation volume (cf. Figure 3–14). As discussed in Sections
2.2.1 and 2.2.2, the SE2 and BSE2 represent the majority of the SE and
BSE, respectively, whereas the SE1 and BSE1, both carrying high-
resolution information, represent the minority. Assuming for simplic-
ity an electron beam diameter of 1 nm, the ratio of the lateral size of
the excitation volume and the beam diameter amounts to approxi-
mately 10
4
for carbon and 10
3
for gold. By choosing the magnifi cation
such that the fi eld of view at the specimen surface approaches the
lateral size of the excitation volume, i.e., related to a 100-mm image size
about 10,000× for carbon and 100,000× for gold, both the SE2 and the
BSE2 contributions will change in response to the features of the fi eld
of view on the size scale of the excitation volume. In contrast to this
the SE1 and BSE1 contributions will change in response to the features
of the fi eld of view approximately on a size scale of the electron beam
diameter. That means that in the course of scanning the electron beam
across the fi eld of view, the SE2/BSE2 contribution only insignifi cantly
varies from pixel to pixel whereas the SE1/BSE1 contribution depends
sensitively on local features as small as the beam diameter. With a
further increase of magnifi cation the fi eld of view becomes signifi -
cantly smaller than the lateral size of the excitation volume, conse-
quently the SE2/BSE2 contribution is almost constant over the image.
The changes in the total SE/BSE signal are almost exclusively due to
the SE1/BSE1 component and correspond to the changes in the very
tiny volume where SE1/BSE1 are generated. Figure 3–38 shows an
example of a high-resolution SE micrograph recorded from a test
sample at a magnifi cation of 500,000×. The distinct changes in image
intensity refl ect the variation of the SE1 component, which is due to
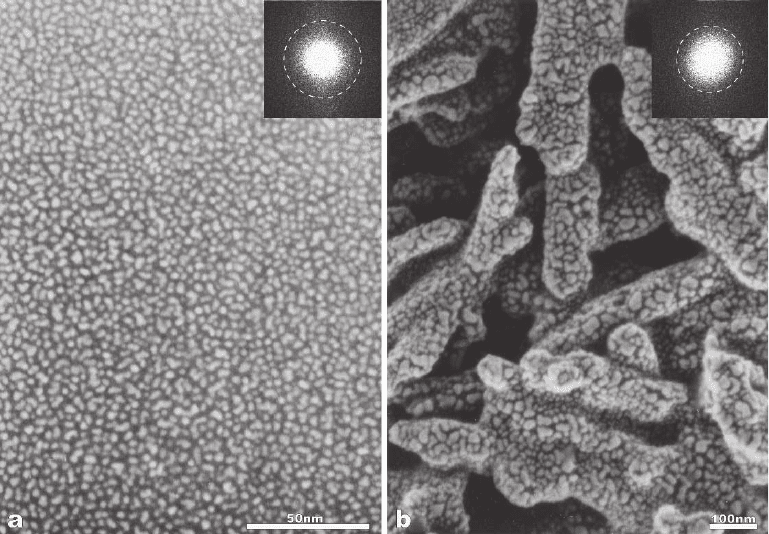
Chapter 3 Scanning Electron Microscopy 213
the large differences in the atomic number between the carbon and the
Au–Pd particles. This type of test sample is usually used to demon-
strate the performance of SEMs.
The low SE yield of low atomic number specimens (cf. Figure 3–17)
such as soft biological objects and polymers limits the resolution due
to the poor SNR. However, the SNR can be improved signifi cantly by
coating the specimen surface with an ultrathin very fi ne-grain metal
fi lm (Peters, 1982) by Penning sputtering or by evaporation in oil-free
high vacuum (cf. Section 2.4). The thickness of such fi lms can be as
small as 1 nm and, as we shall see later, such ultrathin fi lms do not
mask fi ne surface structures. In addition to improving the SNR the
ultrathin coating plays an important role in contrast formation and the
image resolution obtainable. As mentioned earlier, the SE1 arise from
the area directly irradiated by the electron beam and its immediate
vicinity caused by the delocalization of the inelastic scattering in the
order of a very few nanometers (cf. Section 2.2). In the case of the speci-
men coated with an ultrathin metal fi lm the SE1 generation is confi ned
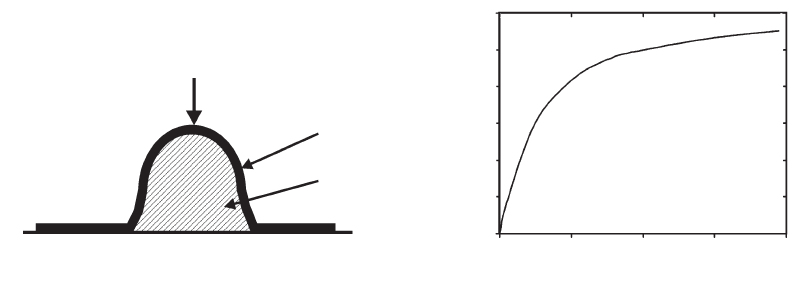
almost exclusively to the fi lm. Figure 3–39a shows schematically the
cross section of an object coated with a continuous metal fi lm of con-
stant thickness. As the electron beam is scanned across the object the
projected fi lm thickness will vary between the nominal fi lm thickness
Figure 3–38. High-resolution secondary electron micrographs of test specimens recorded with the
“in-lens” fi eld emission scanning electron microscope S-5000 (Hitachi Ltd., Tokyo, Japan) at 30 kV (a)
and 1 kV (b). The test specimens were Au–Pd particles on carbon (a) and magnetic tape evaporated
with gold (b). The related power spectra are inserted at the top right. The dashed circles correspond
to (0.6 nm)
−1
(a) and (3.5 nm)
−1
(b), respectively.
214 R. Reichelt
and the maximum, which is several times greater than the nominal
thickness. As shown by Monte Carlo calculations the SE1 yield increases
very quickly with the thickness of the metal fi lm (Joy, 1984). For
example, the Monte Carlo calculations by Joy (1984) reveal for chro-
mium and 20-keV electrons that half of the maximum SE1 yield is
reached for a thickness of 1–1.5 nm only. The dependence of the SE1
yield versus the thickness of a coating fi lm is shown schematically in
Figure 3–39b. It indicates that the increase of the SE1 yield with the
thickness slows down at twice the thickness at half of the maximum
SE1 yield, i.e., the continuous fi lm should be as thin as possible. Monte
Carlo calculations of the SE1 yield for some of the metals suitable for
preparing ultrathin very fi ne-grain metal fi lms show a monotonic
increase with the atomic number (Joy, 1991); thus some further improve-
ment of the SNR may be expected with high atomic number metals.
The ultrathin very fi ne-grain metal fi lm on the sample surface also
improves the BSE1 component signifi cantly, thus improving the SNR
in high-magnifi cation BSE micrographs. The BSE1 are very important
for high-resolution SEM because the elastic electron scattering is
strongly localized. The intensity of the BSE1 component increases with
the projected fi lm thickness, i.e., increases with the number of atomic
scattering centers. Since the BSE coeffi cient strongly increases with the
atomic number (cf. Figure 3–17), the BSE1 component of the metal fi lm
is signifi cantly larger than the contribution from the coated low-atomic
number specimen. The same is also true for small metal clusters or
small particles at the specimen surface, e.g., such as colloidal gold down
to a minimum diameter of 0.8 nm (Hermann et al., 1991), which can be
identifi ed unambiguously in the high-resolution BSE micrograph.
3.1.6 Selected Applications
Since the achievable resolution is the main difference between the
high-resolution fi eld emission SEM and the conventional SEM, it is
obvious that the high-resolution SEM (HRSEM) can readily handle
almost all of the applications mentioned in Section 2.6. Exceptions are
Layer
e
-
Specimen
0
0
ba
T(nm)
1234
SE1-yield (arb. units)
Figure 3–39. Schematic cross section of a specimen coated with an ultrathin continuous metal layer
of constant thickness (a). The projected mass thickness of the metal layer varies as the electron beam
is scanned across the specimen. (b) Graph of the SE1 yield versus the thickness of the coating fi lm.