Gardiner V., Matthews H. The changing geography of the United Kingdom
Подождите немного. Документ загружается.

TONY CHAMPION
176
Population distribution
Despite the UK having one of the highest population densities in the world, its population is
very unevenly distributed and only quite a small proportion of its land surface is heavily
settled. The degree of concentration can be measured at a variety of scales. At the broadest
level, exactly half of the UK’s population lives in the four standard regions which comprise
the ‘South’ and make up barely a quarter of national territory. In terms of urban regions
defined in terms of commutersheds around employment centres, just fourteen of the 283
Local Labour Market Areas (LLMAs) contain one-third of Britain’s population, with London
alone accounting for 1 in 7 of all residents and being larger than the next eight largest
LLMAs combined (Champion and Dorling 1994). In terms of physically defined settlements,
in 1991 2,307 ‘urban areas’ (known by the census authorities as ‘localities’ in Scotland)
accounted for almost 90 per cent of Great Britain’s population despite occupying only 6 per
cent of the land area (Denham and White 1998, and see Chapter 10).
This uneven distribution is a legacy of the UK’s pioneering role in the industrial era
and the associated rapid growth of large factory-based settlements at a time when personal
mobility was very restricted. Fifty years of land-use planning policies designed to limit the
outward spread of the largest built-up areas have reinforced this patterning. Even so, recent
decades have seen some important changes in population distribution, in part a reflection of
the changing nature and location of economic activities but also an outcome of changes in
residential preferences and the importance attached to ‘quality of life’. In general, population
has become more concentrated in southern Britain, while at sub-regional and local scales
deconcentration has been the prevailing tendency.
North-South drift
The principal feature of regional population change throughout the twentieth century has
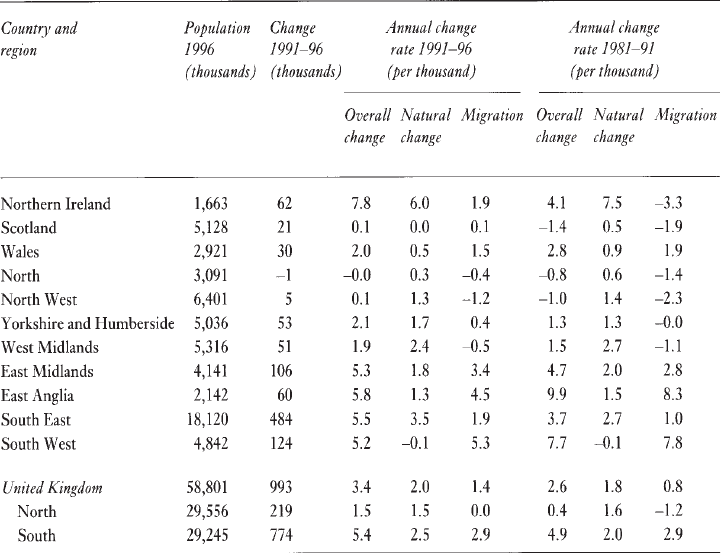
been the drift of population from North to South. As shown in Table 9.3, this tendency
has continued into the 1990s, increasing the degree of population concentration in the
four southernmost regions. The South East, the South West, East Anglia and the East
Midlands combined accounted for over three-quarters of the 1 million national gain in
1991–96. All four regions saw their populations grow at rates of around 5 per 1,000 a
year, well over twice the rate of any northern region apart from Northern Ireland. In
aggregate, the South was growing by 5.4 per cent a year compared to only 1.5 per cent for
the North.
The pace of this southward shift has varied over time, weakening after the first
two decades of the post-war period but accelerating again more recently (Champion
1989). Dorling and Atkins (1995) have neatly summarised this shift in terms of Britain’s
mean centre of population, which moved southwards at a rate of 363 metres a year in
the 1950s, 375 metres in the 1960s, down to 125 metres in the 1970s and back up to 369
metres in the 1980s. In 1991 it was located close to the village of Overseal between
Swadlincote and the Derbyshire/Leicestershire border, some 27 kilometres south of its
position in 1901. The 1990s experience represents a slowdown in this progression, but
not by very much. The overall annual growth rate of the North was 0.4 per 1,000 between
1981 and 1991 and that of the South 4.9, a difference only marginally wider than the
3.9 points of 1991–6. That annual growth rates rose between the 1980s and 1990s in
DEMOGRAPHY
177
most northern regions appears more to do with their paralleling of the shift in the UK’s
growth rate than with redressing the imbalance between the two halves of the country
(Table 9.3).
Table 9.3 shows the separate contributions made to these patterns and trends by natural
change and migration. Natural change has been playing the lesser role, though its significance
increased between the 1980s and the 1990s as the South’s rate rose from 2.0 to 2.5 per
1,000 and that for the rest of the UK fell somewhat, leading to a widening of the South’s
premium from 0.4 to 1.0. Particularly notable in this context is the acceleration in the rate of
natural increase in the South East, which in 1991–6 was responsible for more than half the
UK’s surplus of births over deaths. While Northern Ireland remains distinctive in this respect,
owing to its much higher fertility rate than elsewhere in the UK, this province —along with
most other regions in the northern half of the UK, except Yorkshire and Humberside—has
seen a lowering of the rate of natural change between the two decades, against the UK
trend.
Migration was responsible for the larger proportion of the North-South differential in
the 1990s, though the width of the gap then was narrower than in the previous decade. It can
TABLE 9.3 Population change, by country and region, 1981–96
Source: Data supplied by Office for National Statistics. Crown copyright.
Note: Migration includes adjustments to reconcile population between mid-year estimates
with estimates of natural change and net civilian migration, together with the effects of any
boundary changes. Numbers may not sum because of rounding.
TONY CHAMPION
178
be seen from Table 9.3 that the South’s rate of migratory gain remained unaltered at 2.9 per
1,000, whereas the rate for the rest of the UK rose from -1.2 to a zero net balance. While the
West Midlands, North West and North regions continued to experience net migration loss in
the 1990s, all the northern parts of the UK recorded an upward shift in their migration
balances from the 1980s. Wales showed a slight reduction in its positive migration rate.
Among the four regions of the South, it is notable that, while the South West and East
Anglia registered marked slowdowns from their high migratory growth rates of the 1980s,
the South East and, to a lesser extent, the East Midlands saw their migration gains accelerate
in the first half of the 1990s.
These rather complex changes in regional migration patterns arise from the fact that
at least three different processes have been operating simultaneously and possibly interacting
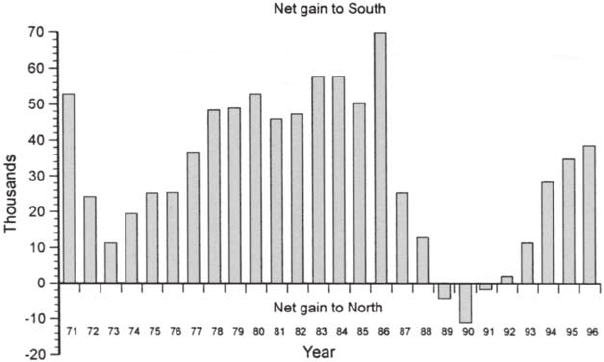
with each other. In the first place, the late 1980s saw a marked reduction in the drift of
people from North to South within the UK, to the extent that in the three years 1989–91 the
net flow switched in favour of the North (Figure 9.2). Second, around the same time, there
was a cutback in the scale of net exodus from the major cities, notably that from London
into East Anglia and the South West (see the next section). Third, a surge in net immigration
in the late 1980s and early 1990s had a positive impact on the migration balances of most
parts of the UK. However, by far the largest effect was felt within the South East which
absorbed over two-thirds of the UK’s net gains. The first two processes are mainly linked
into changes in the economy, notably the severe recession in the South East towards the end
of the 1980s which reduced its attractiveness as a destination of migrants from more northerly
parts of the UK and brought a marked downturn in housebuilding more generally. It is also
likely, though not as yet clearly proved, that over this period the immigration gains in the
South East reduced the availability of both housing and job opportunities for potential in-
migrants from the rest of the UK.
FIGURE 9.2 Net migration between the South and the rest of the United Kingdom, 1971–96
Source: Calculated from NHSCR data. Crown copyright.
Note: The South comprises the standard regions of South East, South West, East Anglia and
East Midlands.
DEMOGRAPHY
179
Urban-rural shift
Urban decentralisation, in the sense of suburban housebuilding, dates back to the
nineteenth century, but in more recent decades it has been operating on a much broader
geographical canvas. Not only is population moving out from the inner areas of individual
cities but it is also shifting out of the largest urban concentrations to towns and more
rural regions—a process sometimes referred to as ‘counterurbanisation’ and known to
the media as the ‘urban exodus’. As detailed in the second edition of this book (Compton
1991:47), these changes are better studied using specially designed representations of
urban regions and their internal structure as opposed to the standard administrative
areas for which mid-year estimates are available, so the account below focuses on change
between Census years.
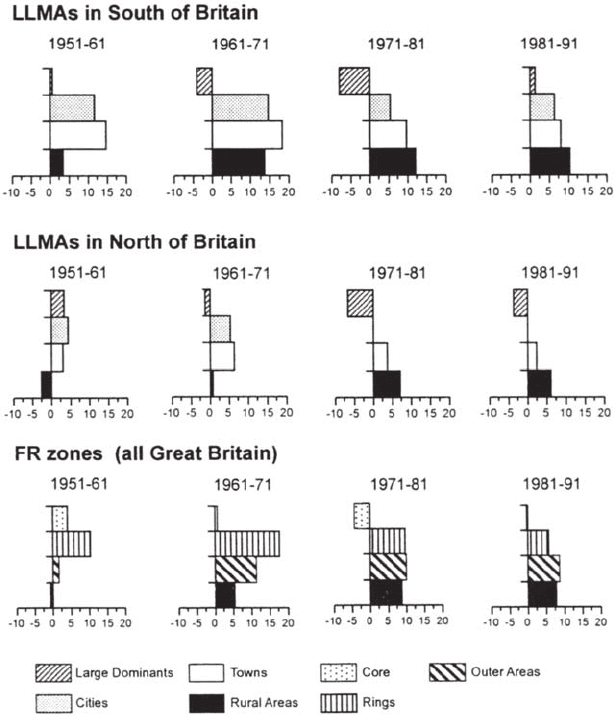
Figure 9.3, based on the Functional Regions framework (Champion and Dorling
1994), clearly illustrates the dual nature of the urban dispersal process, albeit in a highly
summary form. In the latest intercensal period 1981–91, a regular gradient of growth
rate is evident across the four LLMA size groups in both northern and southern halves
of Britain. The ‘large dominants’ at the top of the urban hierarchy register the lowest
growth. At each subsequent level (that is, cities, towns and rural areas) rates in the
South become progressively stronger. The pattern is almost as consistent for the four
types of zone within the Functional Regions, with their main built-up areas (cores)
losing out to their primary commuting areas (rings), and especially to the outer and
rural areas beyond. More detailed analyses (Champion and Dorling 1994) show that
these two dimensions of deconcentration have been occurring side by side, with the
more localised movement of population out of the cores affecting not only the large
dominants but also the cities and towns, which at the same time are gaining people
from the former. Such is the prevalence of these shifts out of heavily built-up areas and
down the settlement hierarchy that the whole urban dispersal process has been dubbed
the ‘counterurbanisation cascade’.
Even so, the pace of deconcentration has not been uniform over time, with the
1980s patterns just described representing a considerable convergence from those of
the previous decade at both scales. Figure 9.3 shows how the large dominants in both
North and South plunged from modest growth to massive decline between the 1950s
and the 1970s, while the rural areas experienced a strong upward shift in growth
rates, but the trend goes into reverse between the 1970s and the 1980s with a
considerable narrowing of the growth gradient. The latter was principally the result
of the recovery of the large dominants, notably in the South where London exerts a
major influence, and a cutback in the growth of rural areas and towns. At the more
localised scale of zone types a similar pattern is evident, with cores weakening through
to the 1970s and then beginning to recover in the 1980s as the growth of the outer and
rural areas fell back.
The partial recovery of the largest LLMAs and their main built-up areas in the 1980s
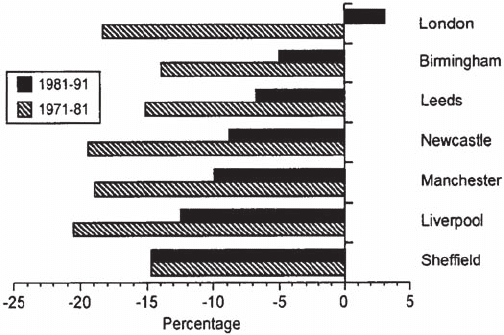
is also reflected at the most detailed spatial scale—that of their inner-city areas. Special
tabulations based on the small-area statistics of the last three Censuses reveal that, for London
and five of the six principal metropolitan cities (Sheffield being the exception), inner areas
saw a marked reduction in their level of population loss between the 1970s and the 1980s.
TONY CHAMPION
180
Most impressively of all, inner London switched from being amongst the greatest losers
into a position of overall gain (Figure 9.4).
In terms of explanation, recent research has focused largely on the slowdown in
deconcentration since the 1970s. Particular attention has been given to the effects of economic
restructuring in the 1980s, notably the exporting to cheap-labour countries of the industries
which led the job decentralisation of the 1970s and the growth of the financial and business
services sectors in the hearts of the largest cities, especially London. The latter, combined
with the ‘baby boomers’ reaching adulthood, is associated with the rise in the ‘yuppy’
phenomenon and the spur to the gentrification of inner-city areas (see Chapter 10). In addition,
the attractiveness of more rural areas fell as increasing pressures led to rising house prices
and traffic congestion, and as the quest for greater efficiencies prompted some withdrawal
FIGURE 9.3 Population change, by Local Labour Market Area types and Functional Region zones,
1951–91, Great Britain
Sources: Calculated from Census, ESRC/JISC data purchase. Crown copyright. See Champion and
Dorling (1994).
DEMOGRAPHY
181
of local shopping, transport and public services from smaller settelements (see Chapter 11).
Even so, in demographic terms, the principal reason for the urban recovery can be found in
the post-1980 surge in net immigration, which has impacted most on the inner areas of
London and certain other cities. Net out-migration from metropolitan England to the rest of
the UK, while fluctuating in the short term, has been averaging 90,000 people a year since
the mid-1970s.
In summary, population redistribution has for decades been dominated by the twin
processes of North-South drift and urban- rural shift, both of which have fluctuated in
pace but look set to continue into the new century. At the same time, it is important to
recognise the diversity of population trends arising from the peculiar circumstances of
individual places and the particular combinations of migration streams that affect them.
Smaller towns can be especially affected by the opening or closure of factories and coal-
mines, while alterations in the migration behaviour of specific groups like students and
retirees can have significant effects even on larger towns and cities. Something of this
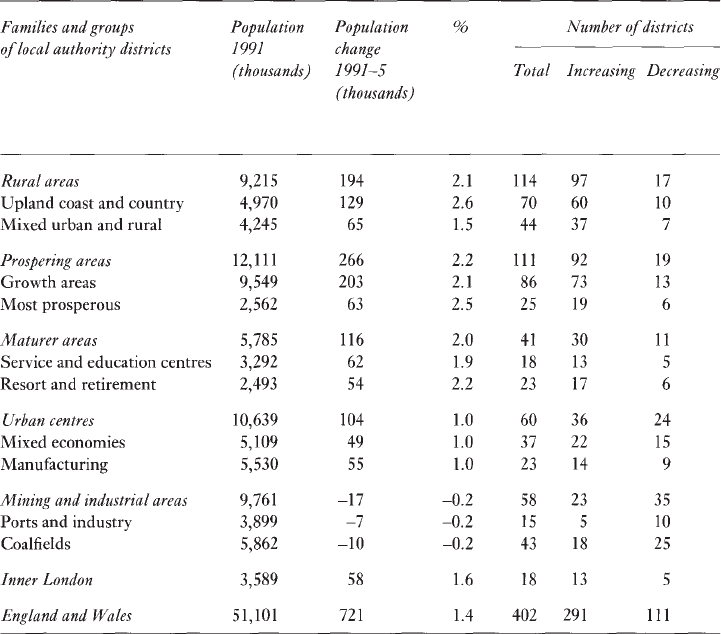
diversity is apparent from Table 9.4, which shows not only the range of growth rates
between different types of local authority districts but also the widespread occurrence of
population losses, even for those types which on average are the most prosperous and
fastest growing.
Population composition
While the UK’s population is growing again in overall size and continuing to redistribute
itself geographically, the most remarkable changes of the past quarter of a century have
been those relating to demographic structure. In particular, the population has been ageing,
it has been getting more diverse in ethnic terms and it has been dividing itself up into
smaller and more varied types of household. These three trends have already had important
implications for many aspects of national life and well-being and they look set to continue
into the future. Moreover, while there is a clear geography of age, ethnicity and household
FIGURE 9.4 Population change for inner areas of London and England’s six Principal
Metropolitan Cities
Source: Calculated from Census, ESRC/JISC data purchase. Crown copyright.
TONY CHAMPION
182
type inherited from earlier decades, most parts of the country have found that the recent
changes in their population profiles are due mainly to their tracking of the national trends.
These and other aspects of socio-demographic restructuring are examined in more detail in
Champion et al. (1996), and some of the consequences for policy at national and local
scales are explored in Champion (1993).
Age structure
The rise in the elderly population has been the most consistent theme of the past
century (Grundy 1996). The proportion of people at or over the current pensionable
age (65 for men, 60 for women) more than tripled from its 1901 level of around 5 per
cent to 18 per cent in 1996. In recent years the most marked change has been in the
numbers of the very elderly, with those 85 and over more than doubling between
TABLE 9.4 Population change by families and groups of local authority districts, England and
Wales, 1991–5
Source: Monitor Population and Health PP1 96/2, 1996, Table C and Table 4 (London: Office for
National Statistics). Data are crown copyright.
Note: Trends after 1995 cannot be studied on this basis because of local government reorganisation.
DEMOGRAPHY
183
1971 and 1996 (up by 120 per cent) and those aged 75–84 increasing by 45 per cent.
This growth derives primarily from the very large birth cohorts of the first years of
this century, which avoided the carnage of the First World War and then lived through
successive periods of improving survival chances. For some years now, this has been
posing a great challenge in terms of health-care and social support, not least because
of the relatively large proportion who do not have children to support them owing to
the low fertility of the inter-war period. Unfortunately, the continuing increases in
life expectancy appear to be providing extra years of disability rather than of healthy
life (Dunnell 1995).
The overall process of population ageing is also greatly affected by trends in fertility,
with the most notable features currently being the low birth rate and the progress of the
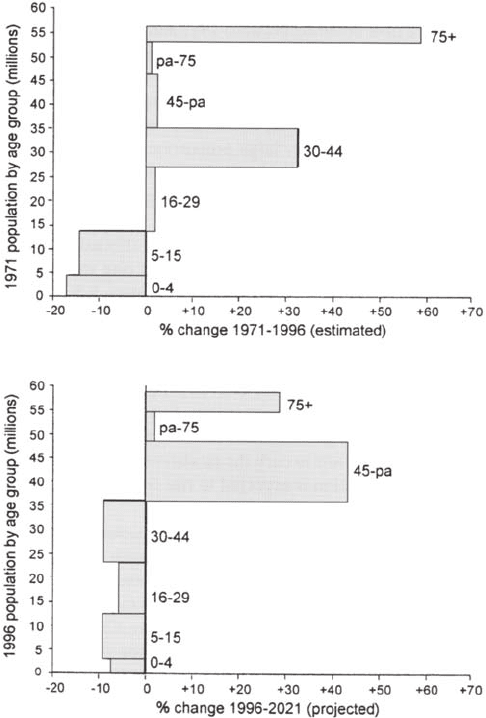
1960s baby boom through the age groups. As shown in Figure 9.5, already in the past
twenty-five years the proportion of under-16-year-olds has fallen by one-sixth and is projected
to reduce further to under 18 per cent by 2021 (see Botting 1996 for further details of the
child population). The passage of the baby boom is reflected in the big increase in 30 to 44-
year-olds between 1971 and 1996 and the even larger projected rise in the proportion of
between 45 and pensionable age over the next twenty-five years. Note, however, that the
latter is inflated by the effects of the government’s decision to raise the official pensionable
age for women from 60 to 65 in its effort to curb the escalation of the pensions bill thereafter.
Overall, the mean age of the population is expected to rise from 38.4 to 41.9 years between
1996 and 2021.
At the same time, there is a marked geography of age structure that means that
certain parts of the UK have already been wrestling for some time with these
challenges. Seaside resorts, spa towns and rural areas have for decades been
characterised by older than average age structures, produced by a combination of
retirement in-migration and the exodus of young adults. The extreme districts at the
1991 Census were Christchurch (Dorset) and Rother (East Sussex), both with
pensioners comprising over one-third of their populations. At the other extreme, with
elderly people making up less than one-eighth of their residents, were new and
expanded towns like Tamworth (Staffordshire) and Milton Keynes (Buckinghamshire),
which along with the earlier new towns have already had to cope with sizeable
reductions in school rolls and will find their numbers of older people growing very
rapidly over the next two or three decades.
Ethnic minority populations
While Britain has a long history of immigration and emigration, the growth of its non-
white population is essentially a phenomenon of the last fifty years. It began with the
intensive recruitment of West Indians to combat early post-war labour shortages. Initially
measured in terms of numbers born in the New Commonwealth (see Haskey 1997), the
non-white population is estimated to have risen from around 218,000 in 1951 to 541,000
in 1961 and to 1.15 million in 1971. From then on, unfortunately, this measure has become
increasingly inaccurate, as more children were born to immigrants in the UK and as the
numbers of non-white arrivals from other foreign countries mounted (see p. 175). In
1991, however, for the first time a question on ethnicity was asked in the Census of Great
Britain (but not in Northern Ireland), eliciting a figure of 3.01 million for the non-white
TONY CHAMPION
184
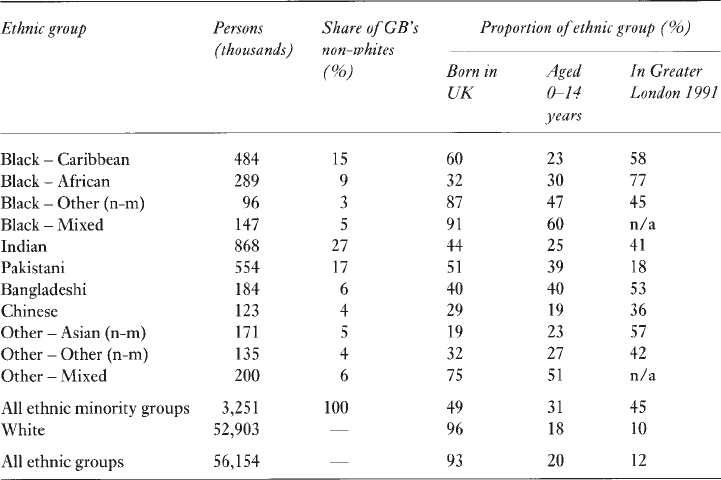
population. The latest estimate, derived from the Labour Force Surveys of 1995/6, is 3.25
million, or 5.8 per cent of Britain’s total population. Of these, almost exactly half (49 per
cent) were UK-born and almost one-third (31 per cent) were aged under 15, a far higher
share than the rest of the population’s 18 per cent. Perhaps most impressively, over the
period 1971–96 the non-white population contributed almost three-quarters of the UK’s
population growth.
At the same time, the non-white population, far from being a homogeneous entity,
is extremely varied in its ethnic background, geographical origins and characteristics,
as shown in Table 9.5. The Black-Caribbean group makes up 15 per cent of Britain’s
non-white population and, being in the vanguard of the post-war surge of immigration,
FIGURE 9.5 Population change by age group, 1971–2021, United Kingdom
Source: Calculated from Annual Abstract of Statistics 134, Table 2.3 (London: The Stationery Office,
1998).
Note: ‘pa’ refers to pensionable age, which in 1971 and 1996 is 65 for men and 60 for women but in
2021 is 65 for both sexes, see text
DEMOGRAPHY
185
contains the highest proportion born in the UK (apart from the mixed-race groups)
and has one of the smallest proportions of children. By contrast, Bangladeshis, as
would be expected of the most recent arrivals among the large national groups, have
a relatively low proportion born in the UK and a youthful age structure. Indians and
Pakistanis form the two largest national groups and have a similar timing of arrival in
the UK, but they differ in terms of their age structure, with Indians having fewer
children.
The ethnic minority groups vary greatly in their geographical distribution, too.
According to the 1991 Census, 45 per cent of all non-whites in Great Britain live in
London, but the proportion ranges from over three-quarters for Black-Africans to under
one-fifth for Pakistanis (Table 9.5). At the district level, there are some notable
concentrations of individual groups. For example, Black groups make up 22 per cent of
Hackney’s population, Indians 22 per cent of Leicester’s, Bangladeshis 23 per cent of
Tower Hamlet’s and Pakistanis 10 per cent of Bradford’s (Champion et al. 1996).
Nevertheless, apart from the Chinese, who are much more evenly distributed around the
country, the New Commonwealth and Pakistani ethnic minority groups have in common
a highly urban lifestyle, living mainly in the inner parts of the larger cities. Moreover,
though they are showing some signs of moving into more suburban areas, their existing
patterns of concentration are being reinforced by natural increase and new arrivals from
overseas (see Chapter 10).
TABLE 9.5 The population of Great Britain 1995/6, by ethnic group
Source: Haskey (1997) Tables 2b, 4, 5 and 8a, calculated from 1995/6 Labour Force Surveys and 1991
Census. Crown copyright.
Notes: n-m = non-mixed; n/a = not applicable, as the 1991 Census did not distinguish Mixed separately
