Venables J. Introduction to Surface and Thin Film Processes
Подождите немного. Документ загружается.

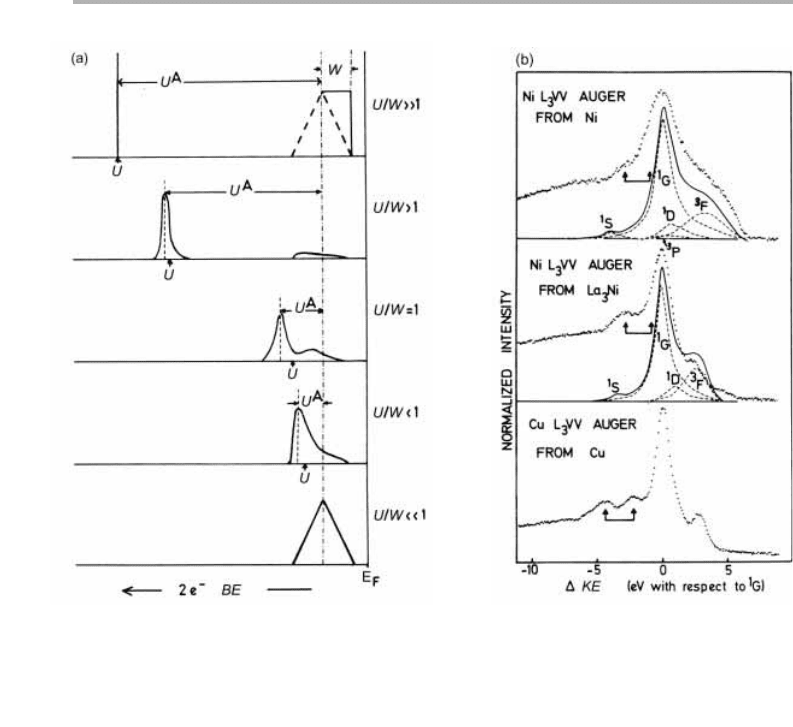
atom (the correlation energy U, often associated with the ‘Hubbard’ model), versus the
valence band width, W (Verdozzi & Cini 1995). If U/W is ,,1, we see an unshifted self
convolution (self fold) of the valence band, corresponding to a delocalized, band-like
final state; in the other limit (W/U ,,1) we see a shifted, but atomic-like, line. The
Auger CVV transitions then show multiplet structure where the details depend on the
variation of the matrix elements with the orbital character of the final state.
As a result of these considerations the lineshape can switch from one type to the
other across a series of alloys. This effect happens particularly for nearly filled d-shells,
as in Pd or Ni alloys and silicides. A schematic diagram of this effect plus an example
of Ni LVV in Ni-based alloys (Fuggle et al. 1982, Bennett et al. 1983) is shown in figure
3.16, but there is ongoing discussion about how such models apply to unfilled bands,
where many different possibilities for screening exist. This type of work is reviewed by
Weightman (1982, 1995) and Hüfner (1996), and is becoming more important as the
finer aspects of electron spectroscopy, including spin-polarized electron spectroscopy
of magnetic materials as discussed in chapter 6, can be interpreted in terms of the elec-
tronic structure.
All these electron spectroscopies derive their surface sensitivity from the low inelas-
tic mean free path (imfp) of electrons, which has a minimum in the neighborhood of
3.3 Inelastic scattering techniques 87
Figure 3.16. (a) Calculated Auger emission spectrum as a function of U/W for a CVV Ni
spectra; (b) comparison of Ni L
3
VV in Ni and in La
3
Ni with Cu L
3
VV Auger spectra,
including calculated (full and dashed) lines based on appropriate values of U for the different
atomic states (after Bennett et al. 1983, reproduced with permission).

50–100 eV, and a typical minimum value of around 0.5 nm. Calculating the imfp has
become a major activity in its own right (Powell 1994, Powell et al. 1994), but it is only
in special cases that it can be readily obtained experimentally. One case which is soluble
is when a deposit grows in the layer by layer mode. We consider this in connection with
AES quantification in the next section; other techniques are not considered here, but
the approaches and problems are all very similar.
The general form of
l
(E) has been given as
l
(in ML)5538/E
2
10.41 (aE)
1/2
, where
a is the ML thickness in nm (Seah & Dench 1979). This formula, widely used in the
1980s for want of a better alternative, shows a minimum at about 50eV, but the form
used is not rigorous; if you are doing detailed work you will need a more accurate
expression, such as that given by Tanuma et al. (1991, 1993). The underlying physics is
that at high E, we have the Bethe loss law for inelastic electron scattering, which shows
that (2dE/dx)⬃E
21
ln(E/I), with I equal to the mean ionization energy ⬃10–15 eV.
l
(E) increases as E/ln(E/I), approximated by E
1/2
in the Seah & Dench formula, since
l
is ⬃(dE/dx)
21
. At lower energy
l
(E) goes up strongly as E decreases, because of the
lack of states into which the electron can be scattered. For example, if the main scat-
tering mechanism is creation of plasmons with an energy of ⬃15 eV, then if the energy
is within 15 eV of the Fermi level, the scattering cannot occur because the final state is
already occupied. This then becomes a phase space limitation at low E, which has an
E
22
dependence.
3.4 Quantification of Auger spectra
3.4.1 General equation describing quantification
The general equation governing the Auger electron current, I
A
caused by a probe
current I
p
can be written down straightforwardly, but is not immediately transparent,
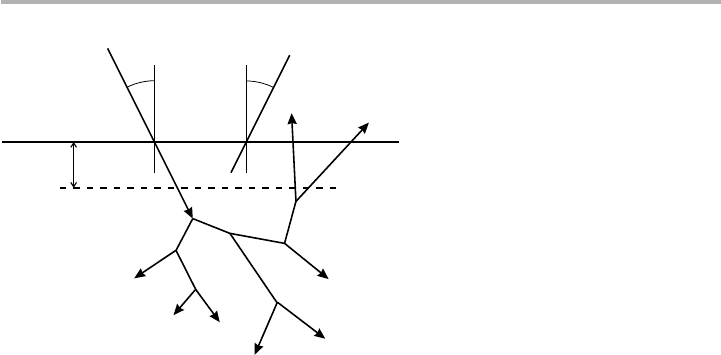
and really needs to be explained using a schematic drawing, such as figure 3.17. The
incoming electron causes an electron cascade below the surface, whose spatial extent is
typically much greater than the imfp. For example, the spatial extent is about 0.5 mm
at an incident energy E
0
520 keV, but also depends on the material and the angle of
incidence,
u
0
. As a result Auger electrons can be produced by the incoming primary
electron beam, and also by the backscattered electrons as they emerge from the sample;
the Auger signal intensity thus contains the backscattering factor, R, which is a func-
tion of the sample material, E
0
and
u
0
.
The ratio I
A
/I
p
can be expressed as a product of terms describing the production and
detection of the Auger electrons, as first developed by Bishop & Rivière (1969). The
Auger yield Y is the number of Auger electrons emitted into the total solid angle
(
V
5 4p sterad). It is therefore not dependent on the details of the analyzer. The detec-
tion efficiency D of the analyzer can be written as (T·«), where T is a function f(
V
a
/4p),
V
a
being the solid angle collected by the analyzer, and « is f(DE/E), most simply
«5(DE/E). Thus
88 3 Electron-based techniques
I
A
/I
p
5Y·D5[
sg
R]·sec
u
0
·N
e
(T·«). (3.8)
Here we have Y expressed as the cross section for the initial ionization event (
s
), the
Auger efficiency (
g
), discussed in outline in section 3.3, and the factor R. The sec
u
0
term
describes the extra ionization path length caused by having the primary beam at an
angle to the sample normal. Finally N
e
is the effective number of atoms/unit area con-
tributing to the (particular) Auger process.
What we actually want to know is: given a measured signal I
A
, how many A-atoms
are there on the surface? Typically there is not a unique answer to such a simple ques-
tion, because the signal depends not only on the number of atoms but also on their dis-
tribution in depth. There are two cases which can be solved uniquely, which are
instructive in showing how such analyses work. The first is when all the atoms are in
the surface layer: then N
e
5N
1
, and if one knew all the other terms in the equation, we
could determine N
1
.
The second case is when the atoms are uniformly distributed in depth: in this case
we can show that N
e
5
l
N
m
, where N
m
is the bulk (3D) density of A-atoms. The proof
of the second case is as follows. We work out
(N
e
·T)5(1/4p)
兰兰兰
N(z) exp(2z/
l
cos
u
a
)·sin
u
a
d
u
a
d
f
a
dz, (3.9)
where the integral is over the two analyzer angles (
u
a
,
f
a
) and depth z. The path length
in the sample in the direction of the analyzer is z/cos
u
a
, so we are assuming exponen-
tial attenuation without change of direction; this is reasonable for inelastic scattering
of the outgoing electrons. Because N(z)5N
m
is constant, we can do the integration
over z first. This gives
3.4 Quantification of Auger spectra 89
Figure 3.17. Schematic diagram of electron scattering in a solid, indicating the incident and
detected angles,
u
0
and
u
a
, plus the role of backscattered electrons in determining the Auger
signal strength. The escape depth is qualitatively the thickness of the region from which most
of the detected Auger electrons originate, of the same order as the imfp discussed in the text.
Auger electron
Backscattered
electrons
Auger
escape
depth
Primary
electron
beam
θ
θ
0
a
Electron
cascade
(N
e
·T)5
l
N
m
·(1/4p)
兰兰
cos
u
a
·sin
u
a
d
u
a
d
f
a
5
l
N
m
·f(
u
a
,
f
a
). (3.10)
The angular double integral is just the cosine electron emission distribution, integrated
over the solid angle of the analyzer; so f5T, N
e
5
l
N
m
, as required.
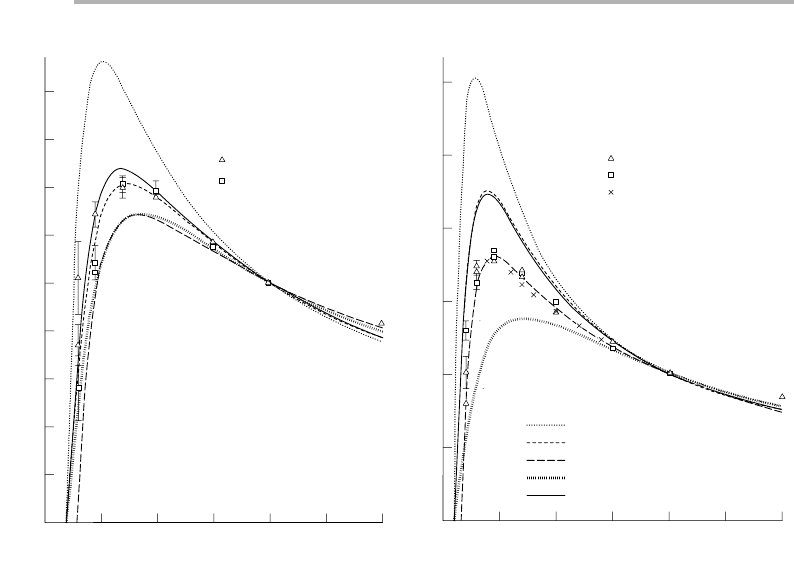
A detailed experimental and computational study of the Auger signals from bulk
elements has been performed, amongst others, by Batchelor et al. (1988, 1989). These
studies show that the dependence of the Auger peak height on primary beam energy
E
0
explores the variation of (
s
R) as shown in figure 3.18 for Si KLL and Cu L
3
MM;
the variation with
u
0
is determined by (Rsec
u
0
·T). The dependence on atomic number
Z is complicated, since all the above material variables and the Auger energy are prop-
erties of the individual element in question.
To make these comparisons we took a particular ionization cross section, and cal-
culated the Auger backscattering factor R511r with this cross section, where r is
defined as
r5(1/
s
(E
0
) sec
u
0
)
兰兰
s
(E)(d
2
h
/dEd
u
)sin
u
d
u
dE, (3.11)
where the normal electron backscattering factor
h
is given by
h
5
兰兰
(d
2
h
/dEd
u
)sin
u
d
u
dE. (3.12)
90 3 Electron-based techniques
Figure 3.18. Auger peak heights for (a) Si KLL and (b) Cu L
3
MM as a function of primary
energy E
0
, normalized to 20 keV, measured on Auger microprobe instruments at Harwell and
Sussex, compared to the product (
s
R) calculated with the cross sections indicated (after
Batchelor et al. 1989, reproduced withpermission).
1.8
1.6
1.4
1.2
1.0
0.8
0.6
0.4
0.2
0.0
3.0
2.5
2.0
1.5
1.0
0.5
0.0
0
5
10 15 20 25 30
(a)
Silicon 1610 eV θ
0
= 65°
0 5 10 15 20 25 30
Primary beam energy
E
0
(keV)Primary beam energy
E
0
(keV)
Normalised signal (20 keV)
Signal normalised to 20 ekV
Harwell MA500
Sussex HB50
Copper 914 eV θ
0
= 65°
Harwell MA500
Sussex HB50
Ichimuras results
Calculations
Worthington–Tomlin
Powell
Gryzinski
Lotz
Hartree–Fock
(θ
0
= 45°)
(b)
This means that the Auger backscattering factor can be written as R511
bh
, where
the factor
b
is typically greater than 1, and depends on the energy and angular distri-
bution of backscattered electrons, and the Auger energy in relation to the beam energy.
Comparison of the energy dependences of the cross sections and other checks on abso-
lute values has advanced knowledge of which cross sections are reliable (Batchelor et
al. 1988, Seah & Gilmore 1996).
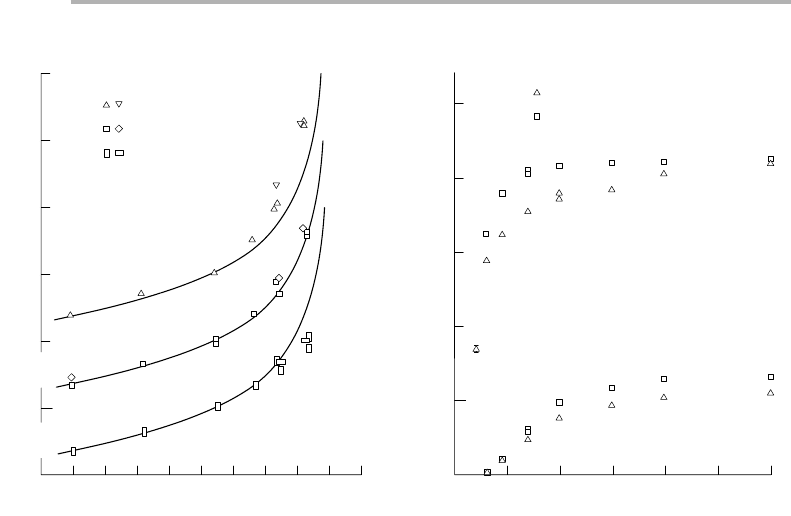
The peak to background ratio (P/B or PBR) can be measured accurately and is very
useful as an approximate compensation for topographic effects. The angular depen-
dence is rather flat as shown in figure 3.19(a) for Cu, Si and W Auger electrons meas-
ured in two different instruments. The lines are a simple model calculation based on
P/B ~ sec(
u
0
)R(
u
0
)/
h
(
u
0
), (3.13)
and it is seen that this model, normalized at normal incidence, gives a good fit out to
at least
u
0
570°. At high incidence angle, there is much less variation in the back scat-
tering factor as a function of atomic number, and the background becomes dominated
by secondary electrons, which have similar excitation mechanisms to Auger electrons.
This is mirrored in the PBR as a function of E
0
, shown in figure 3.19(b). Above 15–20
keV both Cu L
3
MM and Si KLL show no dependence on E
0
; this effect sets in at lower
E
0
for lower energy transitions, where the background comprises secondary rather than
backscattered electrons (Batchelor et al. 1989).
3.4 Quantification of Auger spectra 91
Figure 3.19. Variation of Auger peak to background ratio for (a) Si, Cu and W with incidence
angle
u
0
, compared with model calculation based on (3.13); (b) Si and Cu with primary beam
energy E
0
at two incidence angles
u
0
565 and 75° (after Batchelor et al. 1989, reproduced with
permission).
4.0
3.0
2.0
1.0
0.0
0.0
0.0
–10 0 10 20 30 40 50 60 70 80 90
Tilt angle (deg)
Harwell MA500
Silicon
Copper
Tungsten
(a)
2.5
2.0
1.5
1.0
0.5
0.0
(b)
0 5 10 15 20 25 30
Primary beam energy
E
0
(kV)
Harwell MA500
Incident angle, θ
0
65°
75°
Tungsten 1730 eV
Silver 345 eV
Peak to background ratio
Signal normalized to 45
°

3.4.2 Ratio techniques
Detailed study of the basic quantification equation leads to some interesting physics,
and often to a determination of one or more parameters of the experiment, but it does
not lead directly to easy sample analysis. For this we have to keep many of the experi-
mental parameters fixed, and use standard samples for comparison. Ratio techniques
are common in all forms of quantitative analysis, principally because they allow one
to eliminate instrumental variables. The measurement is then the value of (I
A
/I
p
) for
the sample (s), ratioed to the same quantity for the (pure element) standard (el).
Comparing the terms in the quantification equation, we can see that the only terms
which do not cancel out, for bulk, uniformly distributed samples, are
(I
A
/I
p
)
s
/(I
A
/I
p
)
el
5(R
s
l
s
/R
el
l
el
)·(N
s
/N
el
); (3.14)
the last bracket is what we want to know, and the previous term is a ‘matrix dependent’
factor. Without detailed calculation it is not obvious how such terms behave, but they
can sometimes vary slowly. For example, it has been shown that the matrix dependent
factors often vary linearly with composition in binary alloy systems (Holloway 1977,
1980). If one is stuck, one can establish standards closer to the composition of inter-
est. This might be seen as a last resort: it is clear that the smaller extrapolation one
makes, the more accurate the result is likely to be.
Many authors have developed programs for studying such effects, and national stan-
dards organizations (National Institute for Standards and Technology (NIST),
National Physical Laboratory (NPL), etc.) are involved on an ongoing basis. The
author most concerned in the USA is C.J. Powell of NIST, who has written extensively
on this topic; his UK counterpart is M.P. Seah, who works for NPL; he has published
an interesting commentary on the needs of, and competing pressures in this field (Seah
1996), and they have written several updates on the whole field (e.g. Powell & Seah
1990). It is no accident that they have concerned themselves with these aspects of quan-
titative analysis, and indeed run conferences with the title Quantitative Surface Analysis
(QSA) at which such matters are discussed in great detail (Powell 1994); QSA-10 was
held in 1998. Round-robins, which use standard samples to be tested in the different
laboratories, are one of the methods used to find out where there is common ground
and where there are difficulties. By characterizing the analyzers carefully, the spectra
can be calibrated on an absolute scale, such as the example given earlier for Ge in figure
3.13 (Seah & Gilmore 1996).
There are also major consulting businesses based on such analyses, since the services
and expertise are often very expensive to maintain in-house; the best known may be
C.A. Evans and Associates. These topics are not discussed further here, but the flavor
of this work can be obtained from the specialist books, especially Smith (1994); he too
worked for NPL, and gives a list of significant papers by the above authors and others.
The brochures and web-sites of such organizations are an increasing resource, which
can be accessed via Appendix D.
A typical ‘surface science’ application of quantitative AES is to distinguish layer by
layer from other types of growth. Layer growth is a case which one can work out easily
92 3 Electron-based techniques

if we disregard (the minor) changes in the backscattering factor; the experimental ratio
is (I
A
/I
p
) for a multilayer divided by (I
A
/I
p
) for a ML. Here we assume that there are N
1
atoms in the first layer, N
2
in the second and so on, and their spacing is d. Then we can
work out the signals at a coverage
u
between n and n11 ML from both the layers and
the substrate, as sums which take into account the attenuation. For example, if n51,
and we neglect attenuation within the first layer
N
e
5N
1
[(22
u
)1(
u
21)exp(2d/
l
cos
u
e
)]1N
2
, (3.15)
where the first (second) term in square brackets correspond to the proportion of the
first layer which is uncovered (covered) by the second layer, and so on. This relation
leads to a series of straight lines, often plotted as a function of deposition time, from
which the
l
can be deduced in favorable cases.
The simplest case, where there are the same numbers of atoms in each completed
ML, can be worked out explicitly. In that case, the slope of the second ML line ratioed
to that of the first ML gives exp(2d/
l
cos
u
e
), from which d/
l
can be extracted if the
effective analyzer angle
u
e
is known. This effective angle is given by
cos
u
e
5(1/
V
a
)
兰兰
cos
u
a
·sin
u
a
d
u
a
d
f
a
, (3.16)
with the integrals taken over the analyzer acceptance. For detailed studies, it is advis-
able to construct computer programs which take the analyzer geometry into account,
and then perform the angular integration numerically. There has been much discussion
over what
l
really is in such experimental comparisons; it is now accepted to be the
attenuation length (AL), which is shorter than the imfp due to elastic (wide angle) scat-
tering (Dwyer & Matthew 1983, 1984, Jablonski 1990, Matthew et al. 1997, Cumpson
& Seah 1997). However, as pointed out by the last authors, unless the integration of
(3.16) is performed separately (as implied here), the AL also depends on the type of
analyzer used and the angular range accepted; thus in some papers the AL is not a
material constant, and one should beware of using published values uncritically.
There are many layer growth analyses in the literature, in some cases with a large
number of data points showing relatively sharp break points at well-defined coverage,
such as for Ag/W(110) (Bauer et al. 1977). Experiments with fewer data points can still
lead to firm conclusions, using the comparison with a layer growth curve of the type
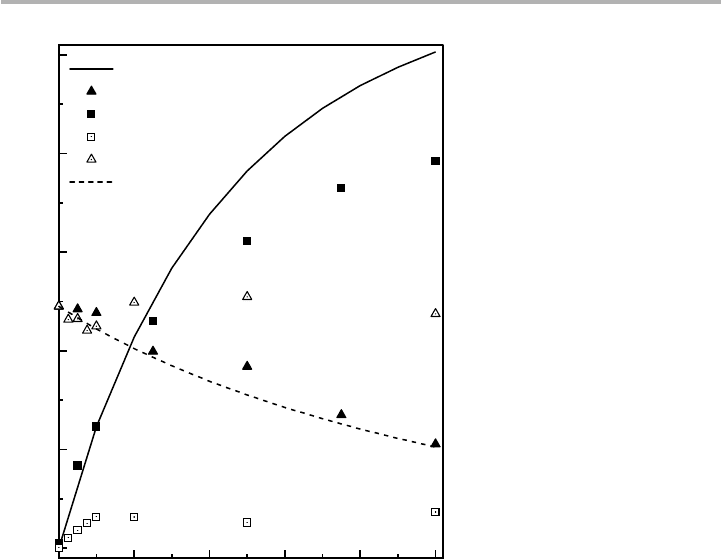
reported here. Such an analysis is shown in figure 3.20, which shows both the Auger
spectra for a series of Ag deposits on Si(001) and the corresponding Auger curves as a
function of coverage at both room and elevated temperature (Hanbücken et al. 1984,
Harland & Venables 1985). This is a case where growth more or less follows the ‘layer
plus island’, or Stranski–Krastanov (SK) mode, discussed in more detail in chapter 5.
From the Auger curves we see that at room temperature, layer growth is followed for
approximately 2 ML, but then experiment diverges from the model, indicating rough-
ening or islanding. The high temperature behavior is much more extreme, as the first
layer is #0.5 ML thick, and islands grow on top of, and in competition with, this dilute
layer (Luo et al. 1991, Hembree & Venables 1992, Glueckstein et al. 1996).
The Ag/Si(111) and Ag/Ge(111) systems have also been studied, with the 冑3 recon-
structed layer at high temperatures having a thickness of around 1 ML. The exact
3.4 Quantification of Auger spectra 93
coverage of such layers has been quite controversial (Raynerd et al. 1991, Metcalfe &
Venables 1996, Spence & Tear 1998), because the layers are only slightly more stable
than the islands, and consequently kinetic effects play an important role. There are now
many examples, from these and other growth systems, which show characteristic Auger
curves associated with layer, island and SK growth. It is only by detailed quantitative
analysis, with for example known imfp values, that one can make such definitive state-
ments from Auger curves on their own.
Some recent examples are discussed by Li et al. (1995), Venables et al. (1996),
Venables & Persaud (1997) and Persaud et al. (1998), where the layer growth analysis
was used to investigate interdiffusion in Fe/Ag/Fe(110) and surface segregation in
Si/Ge/Si(001) hetero-structures. The purpose of a detailed layer growth analysis is
often to show that the system does not follow the layer growth mode, as discussed for
these cases in sections 5.5.3 and 7.3.2. Many authors have used deposition time as the
dose variable, and then state that the break point corresponds to 1 ML coverage; this
is unfortunately bad logic, since the coverage is the independent variable and the Auger
94 3 Electron-based techniques
Figure 3.20. Auger E·N(E) peak intensities versus coverage for Ag/Si(001) at deposition
temperatures T5293 K (closed squares for Ag and triangles for Si) and at T5773 K (open
symbols). The lines are numerical layer growth calculations using the actual analyzer geometry
and for an inelastic mean free path
l
50.82nm for Ag (355eV) in Ag (solid line) and
l
51.90nm for Si (1620 eV) in Ag (dashed line) (after Hanbücken et al. 1984, replotted with
permission).
0246810
0
200
400
600
800
1000
Ag (0.82 nm)
Si KLL (RT)
Ag LMM (RT)
Ag LMM (793 K)
Si KLL (793 K)
Si (1.9 nm)
Peak height (arb. units)
Ag coverage (ML)

intensity is the dependent variable. Used in the way described here, the Auger curve
needs to be calibrated independently, e.g. via a quartz oscillator or Rutherford back-
scattering spectroscopy (RBS), as discussed, for example, by Feldman & Mayer (1986).
3.5 Microscopy-spectroscopy: SEM, SAM, SPM, etc.
3.5.1 Scanning electron and Auger microscopy
Scanning electron microscopy (SEM) is now a routine tool which has been extensively
commercialized; many experimental scientists need access to a high performance, but
non-UHV, SEM. For example, in nanotechnology, the sizes of the structures are so
small that they cannot be seen with optical microscopes; SEM is often the easiest
choice to obtain better resolution. Electron beam lithography is an important fabrica-
tion technique, particularly for mask manufacture, and SEM is used routinely in
quality control of the devices produced in this (and other) ways. Via my son’s profes-
sion in biology/biochemistry, I have seen that SEM pictures of cells and cell organiza-
tion have taken a central place in even the introductory text books on these subjects.
Thus SEM is in danger of being taken for granted, due to the life-like, apparently 3D
images which are so readily produced. At the same time, contrast mechanisms are typ-
ically not understood in detail, due to the relatively complex nature of secondary elec-
tron production in solids and the ill-defined collector geometry.
In a UHV, clean surface environment, there are several SEM-based techniques which
are surface sensitive at the ML and sub-ML level. The main SEM signal is based on col-
lecting secondary electrons, which typically form a large proportion of the emitted elec-
trons (see figure 3.7). In several papers with collaborators, we have shown that the low
energy secondary electron signal is very sensitive to work-function and other surface-
related changes; by biasing the sample negative to a bias voltage V
b
between 210 and
2500V, we can obtain biased secondary electron images (b-SEI), and ML and multi-
layer deposits can be readily visualized and distinguished (Futamoto et al. 1985). UHV-
SEM is particularly useful when combined with AES and RHEED (Venables et al.
1986, Ichikawa & Doi 1988). Progress in understanding secondary electron contrast
mechanisms, including in a clean-surface context, has been reviewed by Howie (1995).
Scanning Auger microscopy (SAM) is the child of AES and SEM. A fine primary
beam is used, scanned sequentially across the sample at positions (x,y) as in SEM, and
the emitted electrons are energy analyzed as in AES. We can now (attempt to) perform
various types of analysis, such as a spot mode analysis (scan the analysis energy E at
fixed (x
0
,y
0
)), an energy-selected line scan (scan x at fixed y
0
and analysis energy E
A
), or
an energy-selected map or image (scan x and y at analysis energy E
A
). These attempts
are subject to having a long enough data collection time and high enough beam current
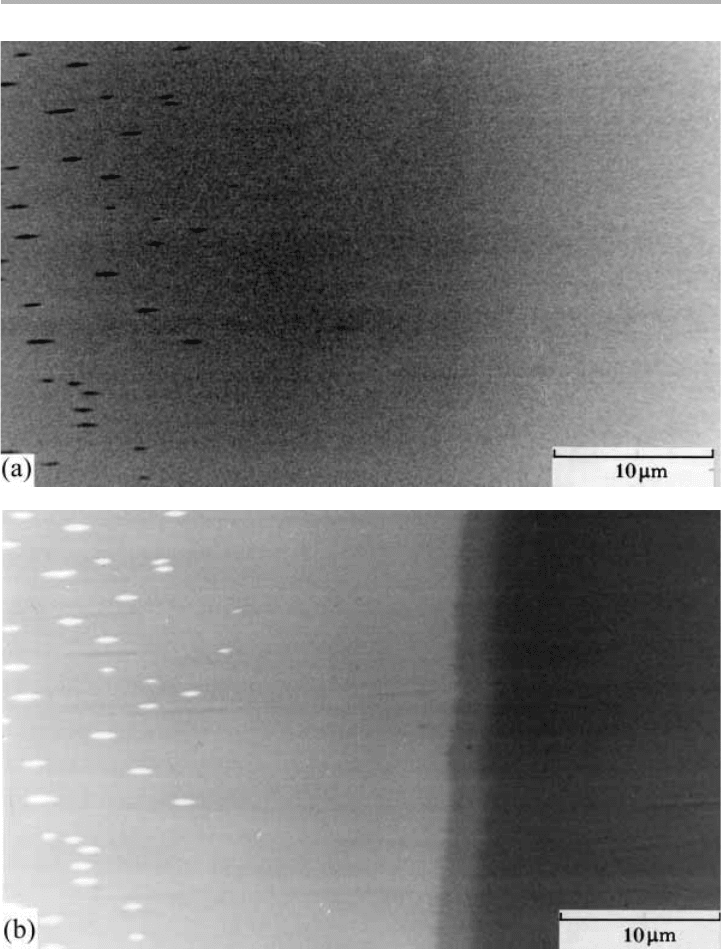
to achieve a satisfactory SNR. Some examples are shown in figures 3.21 and 3.22. In
particular, you can notice that the SNR of the b-SE linescans is very good, and the b-
SE images are reasonably clear; next good are the energy-selected line scans. The most
difficult/time-consuming are energy-selected images, especially if difference images are
3.5 Microscopy-spectroscopy 95
96 3 Electron-based techniques
Figure 3.21. Biased secondary electron images of 5 ML Ag/W(110), deposited past a mask
edge at T5 673 K and deposition rate R50.5 ML/min, observed with a 30 keV probe beam at
u
0
570°; the tilt is around the horizontal axis, so the vertical scale is compressed by cosec
u
0
.
(a) Zero bias, with Ag islands showing dark, and the layers essentially invisible; (b) bias
voltage V
b
52200V, showing the islands bright, and the 1 and 2 ML steps clearly visible (after
Jones & Venables 1985, reproduced with permission).
