Trent E.M., Wright P.K. Metal Cutting
Подождите немного. Документ загружается.

THE SHEAR PLANE AND MINIMUM ENERGY THEORY 63
This approach did not produce equations from which satisfactory predictions could be made of
the influence of parameters, such as cutting speed, on the behavior of materials in machining.
The inappropriate use of friction relationships relevant only to sliding conditions was probably
mainly responsible for the weakness of this analysis. With this model the important area of con-
tact between tool and work was not regarded as significant and no attempt was made to measure
or to calculate it.
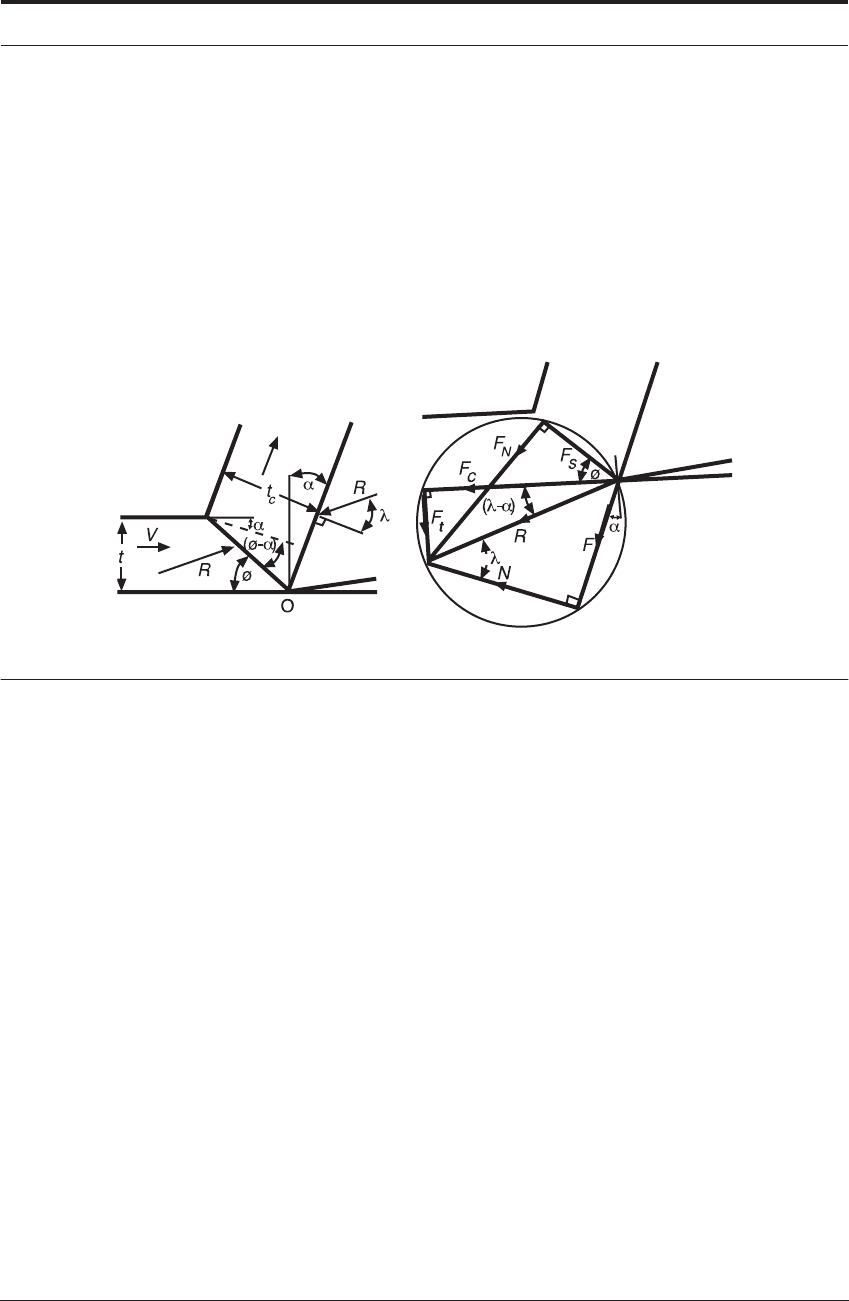
Nevertheless, Merchant’s force circle, shown in Figure 4.3, remains an important milestone in
metal cutting theory.
FIGURE 4.3 Merchant’s force circle
The forces can be found from Figure 4.3 as the two equations below:
(4.5)
(4.6)
Differentiating the first equation with respect to the shear plane angle gives:
(4.7)
and the Merchant equation as
(4.8)
D
F
c
t
1
wk λα–()cos
φφλα–+()cossin
-----------------------------------------------=
F
t
t
1
wk λα–()sin
φφλα–+()cossin
-----------------------------------------------
·
=
dF
c
dφ
---------
t
1
wk λα–()2φλα–+()coscos
2
φφλα–+()
2
cossin
-------------------------------------------------------------------------------0==
φ
π
4
---
1
2
---
λα–()–=

64 FORCES AND STRESSES IN METAL CUTTING
After this expression has been found, the cutting forces can then be written.
For the main cutting force acting in the tool/work direction:
(4.9)
and (4.10)
For the feed force acting normal to the main cutting force
(4.11)
and (4.12)
These forces allow the analysis of shear stresses, temperatures, etc., on the rake face of the
tool.
From the force diagram in Figure 4.3 the forces on the shear plane are given by
(4.13)
(4.14)
The shear stress and normal stress may be found from
(4.15)
F
c
wt
1
k λα–()cos
π 4⁄()
1
2
---
λα–()– π 4⁄()
1
2
---
λα–()+cossin
----------------------------------------------------------------------------------------------------------------=
F
c
2wt
1
k φcot=
F
t
wt
1
k λα–()sin
π 4⁄()
1
2
---
λα–()– π 4⁄()
1
2
---
λα–()+cossin
----------------------------------------------------------------------------------------------------------------=
F
t
wt
1
k φ
2
cot 1–()=
F
s
shear force = F
c
φ F
t
φsin–cos=
F
N
normal force F
c
φ F
t
φcos+sin==
k
s
shear stress
F
s
A
s
------
F
c
φ F
t
φsin–cos[]φsin
wt
1
----------------------------------------------------------===

THE SHEAR PLANE AND MINIMUM ENERGY THEORY 65
(4.16)
where is the shear-plane area .
The coefficient of friction is defined in usual engineering practice as the ratio of the force in
the direction of sliding to the force normal to the sliding interface. Thus, from the geometry
shown, Figure 4.3, it follows that on the rake face of the tool, the coefficient of friction,
(4.17)
(4.18)
where F is the friction force on the rake face, N is the normal force on the rake face, and is the
friction angle.
The usual concept of friction implies that F and N are forces which are uniformly distributed
over the sliding interface. However, this is not the case in metal cutting and thus this approach to
coefficient of friction is too simple to adequately describe a seizure situation.
Although there have been many attempts to update the model, change its boundary conditions
and consider new material properties, it still remains a useful, direct way of thinking about the
energy used in cutting and how deformation will take place.
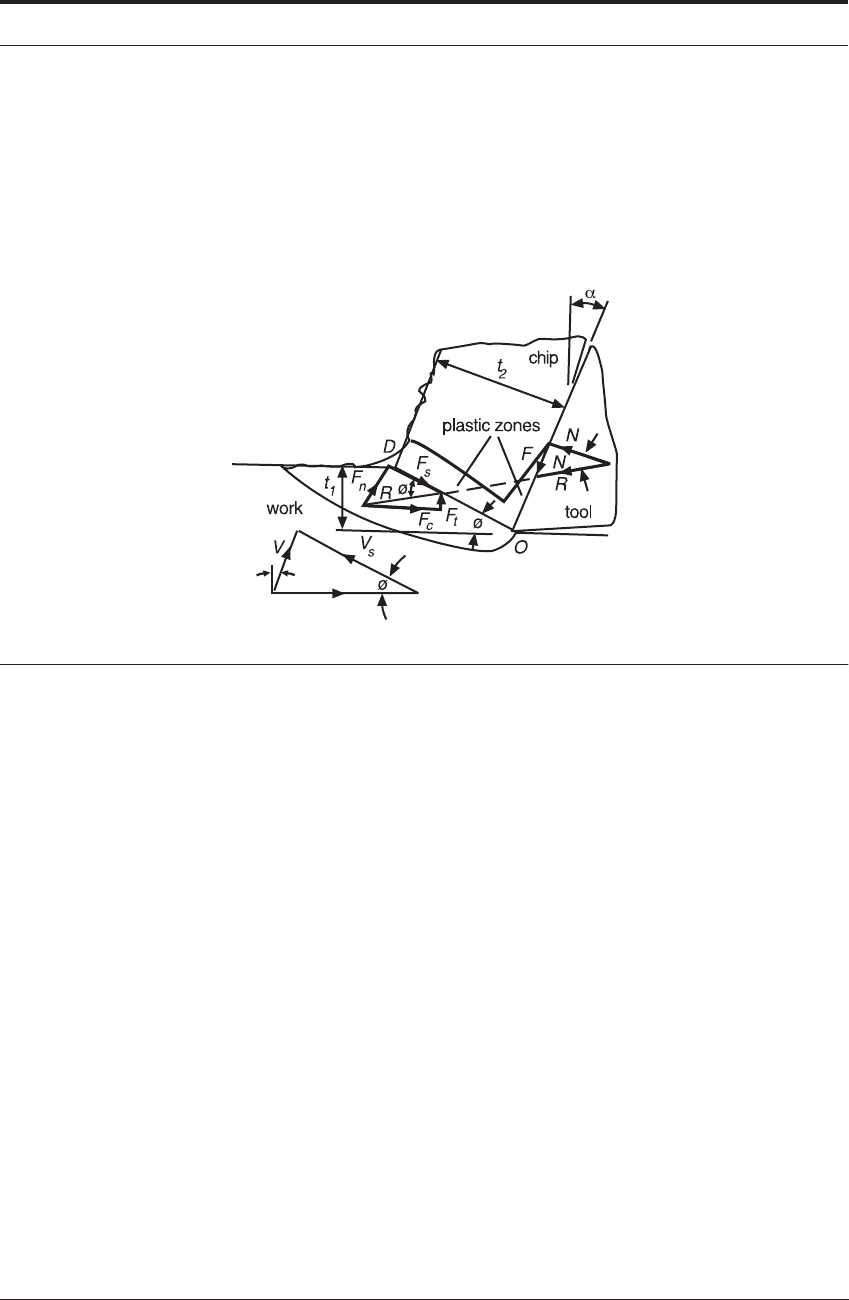
4.4.2 Oxley’s shear ‘zone’ analysis
More recently other research workers, notably Oxley and colleagues,
6
have refined the analy-
sis of cutting using more realistic models. Chip formation is considered to take place in a fan-
shaped zone at low speed, and a parallel-sided zone at higher speeds, rather than on a single
plane. The work-hardening characteristics of the material are taken into account. The frictional
conditions are described as shear within a layer of the chip adjacent to the rake face of the tool.
Within this layer “near-seizure” conditions are said to exist, with velocity in the work material
approaching zero at the interface. To make quantitative predictions from this model, attempts are
made to use realistic data for the stress/strain behavior of the work material allowing for strain
hardening and the influence of high strain rates and temperature. This model is a considerable
advance. For example, the conditions in which a built-up edge will occur during the cutting of
steel can be predicted.
In Figure 4.4 , the directions of maximum shear stress and maximum shear strain-rate are: i)
the line OD, near the center of the shear zone, and ii) the tool/chip interface.
σ normal stress
F
c
φ F
t
φcos+sin[]φsin
wt
1
----------------------------------------------------------==
A
s
wt
1
φsin⁄
μ
F
N
----
F
c
α F
c
αcos+sin
F
c
α F
t
αsin–cos
--------------------------------------------==
F
c
F
t
αtan+
F
c
F
t
αtan–
------------------------------= λtan=
λ
66 FORCES AND STRESSES IN METAL CUTTING
The theory analyzes the stress distribution along OD and the tool/chip interface in terms of the
shear angle φ, and the work material properties.
The key idea is to select φ so that the resultant forces transmitted by the shear plane OD and
the interface are in equilibrium.
Once φ is known then the chip thickness t
2
and the various components of force can be deter-
mined.
FIGURE 4.4 Model of chip formation used in Oxley’s orthogonal analysis.
By starting at the free surface just ahead of the shear plane, and applying the appropriate stress
equilibrium equation along the shear plane, it can be shown that for the angle
made by the resultant R with the shear plane is given by
(4.19)
In this equation, there are two constants:
• First, C is the constant in an empirical strain-rate relation from Stevenson and Oxley’s work.
C itself came from detailed studies of deformed grids in experimental work and calculations
of the primary shear strain rate:
(4.20)
in which is the maximum shear strain-rate at the shear plane, V
P
is the shear velocity in
the shear plane and (s) is the length of the shear plane
• Second, the other constant n, in equation 4.19 is the strain-hardening index in the empirical
stress/strain relation
(4.21)
0 φ
1
4
---
π≤<
θ
θtan 1 2
1
4
---
πφ–
⎝⎠
⎛⎞
Cn–+=
γ
·
P
CV
P
s()⁄=
γ
·
P
σσ
1
ε
n
=
THE SHEAR PLANE AND MINIMUM ENERGY THEORY 67
in which and are the uniaxial (effective) flow stress and strain and n are constants. {Note,
the constant n here, is quite different from the n in Taylor’s equation.} The angle can thus be
expressed in terms of other angles by the equation
(4.22)
There appear to be two major challenges when using Oxley’s new models for the quantitative
prediction of behavior in the region where a flow-zone is present at the interface - i.e. in most
high speed cutting operations.
Firstly, adequate data on stress/strain relations are not available, particularly for the amounts of
strain, extreme strain rates, times and temperatures at which material is deformed in the flow-
zone at the chip/tool interface.
Secondly, while the importance of the contact area is recognized, estimations of this area rely
on calculations of a mean contact length and the basis for this calculation seems to be inade-
quate. There appears to be no alternative to experimental measurement of this area which, as has
been indicated, presents serious difficulties.
4.4.3 Rowe and Spick’s approximate analysis
It is not intended, therefore, to present here a method of making quantitative predictions of cut-
ting behavior from properties of the work material. Instead, a very simple guide is offered to the
understanding of certain important features observed when cutting metals and alloys, based on
consideration of the energy expended in cutting. This treatment of the subject is a simplified ver-
sion of the analysis proposed by Rowe and Spick.
7
It is based on a model that assumes shear
strain on the shear plane to form the chip and shear strain in a thin layer of the work material
adjacent to the tool rake face. The major hypothesis is that, since it is not externally constrained,
the shear plane will adopt such a position that the total energy expended in the system (energy on
the shear plane plus energy on the rake face) is a minimum; this is similar to Merchant’s pro-
posal.
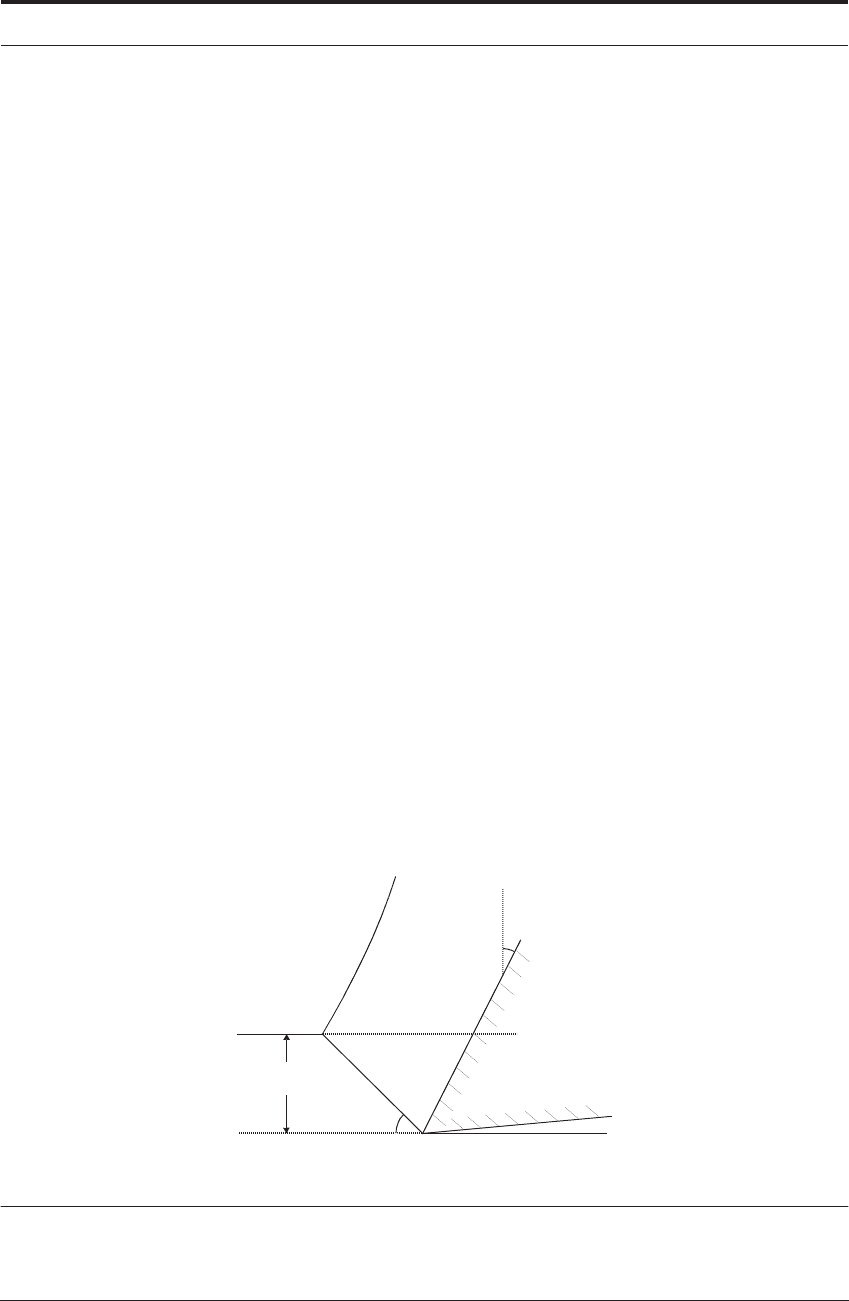
FIGURE 4.5 Rowe-Spick Definitions for Chip Formation (OP = the projected contact length, as opposed
to the full contact length OB´. Thus L= OB´ = χOP. Also note that the seizure part of the contact length will
extend well beyond position P usually to about 80% of OB´-see Figure 3.17)
σε σ
1
θ
θφλα–+=
Tool
B´
t
1
or feed
α
P
o
φ
D
68 FORCES AND STRESSES IN METAL CUTTING
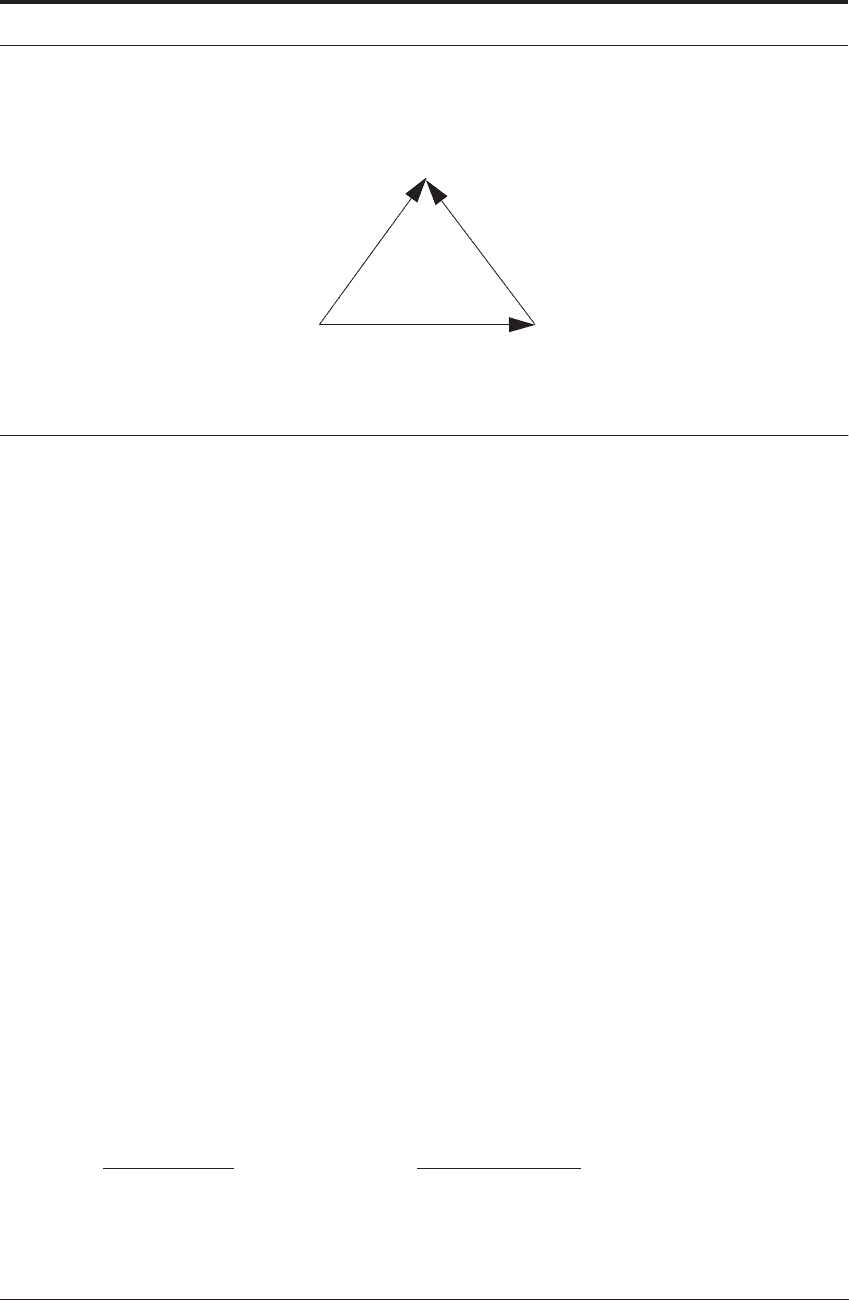
FIGURE 4.6 Corresponding velocity triangle (also called a Hodograph) during chip formation
Consider first the rate of work done on the shear plane. The principal of least action states that
the shear plane will adopt such a position as to make the rate of work done in cutting a minimum.
Here, V, is the cutting velocity and F
C
is the main cutting force. The approximate technique
summarized in Figure 4.5 and the velocity triangle of Figure 4.6 with its labels of o, a and c, lead
to the following:
Find the sum of internal rate of doing work
Rate of Work done = Primary Shear + Secondary Shear
Then if k is constant this simplifies to
The term β arises from the unknown issues around how much seizure versus sliding exists.
This is handled by Rowe and Spick by defining two extremes
Perfect Sliding
Complete Sticking
No friction force All shear within chip’s under-surface
Shear stress on rake face = 0 Shear stress = k. (Shear yield strength
of material.)
V
V
V
workmaterial
shear plane
chip
a
c
O
d
dφ
------
(work done per sec.)
d
dφ
------
F
C
V⋅()0.==
dw
dt
-------
∑
kus
∑
=
∑
ie.
d
dφ
------
kacOD⋅⋅ βk oc OB′⋅⋅+[]0=
=k ac OD βk oc OB′⋅⋅+⋅⋅
d
dφ
------
ac OD β oc OB′⋅⋅+⋅[]0=

THE SHEAR PLANE AND MINIMUM ENERGY THEORY 69
the shear stress k
r
on rake face is then a scalar function of the material strength = (where
).
Note that = a constant between zero and one, not a friction angle. It has been used in this
book to be consistent with the Rowe and Spick analysis. (Note also in other text books on metal
processing, that is often used in a very different way for the contact angle in strip rolling.) The
analysis also needs to estimate the contact length OB
´, which is a function χ of the projected
contact length OP. Assume, as shown in Figure 4.5, that
The velocities can be found by geometry
And
This can be differentiated to give the final equation defining the shear plane angle
(4.23)
The next equation rearranges the final equation:
βk
0 β 1<<
β
β
OB′χOP χprojected length==
OB′χ
t
1
αcos
------------
=
OD φsin t
1
=
ac
αcos
φα–()cos
--------------------------
=
oc
φsin
φα–()cos
--------------------------=
d
dφ
------
t
1
φsin
-----------
αcos
φα–()cos
--------------------------
t
1
βχ
αcos
------------+
φsin
φα–()cos
--------------------------
0=
α 2φα–()coscos βχ φsin
2
–0=
β sin
2
φ
1
χ
---
α() 2φα–()coscos=
70 FORCES AND STRESSES IN METAL CUTTING
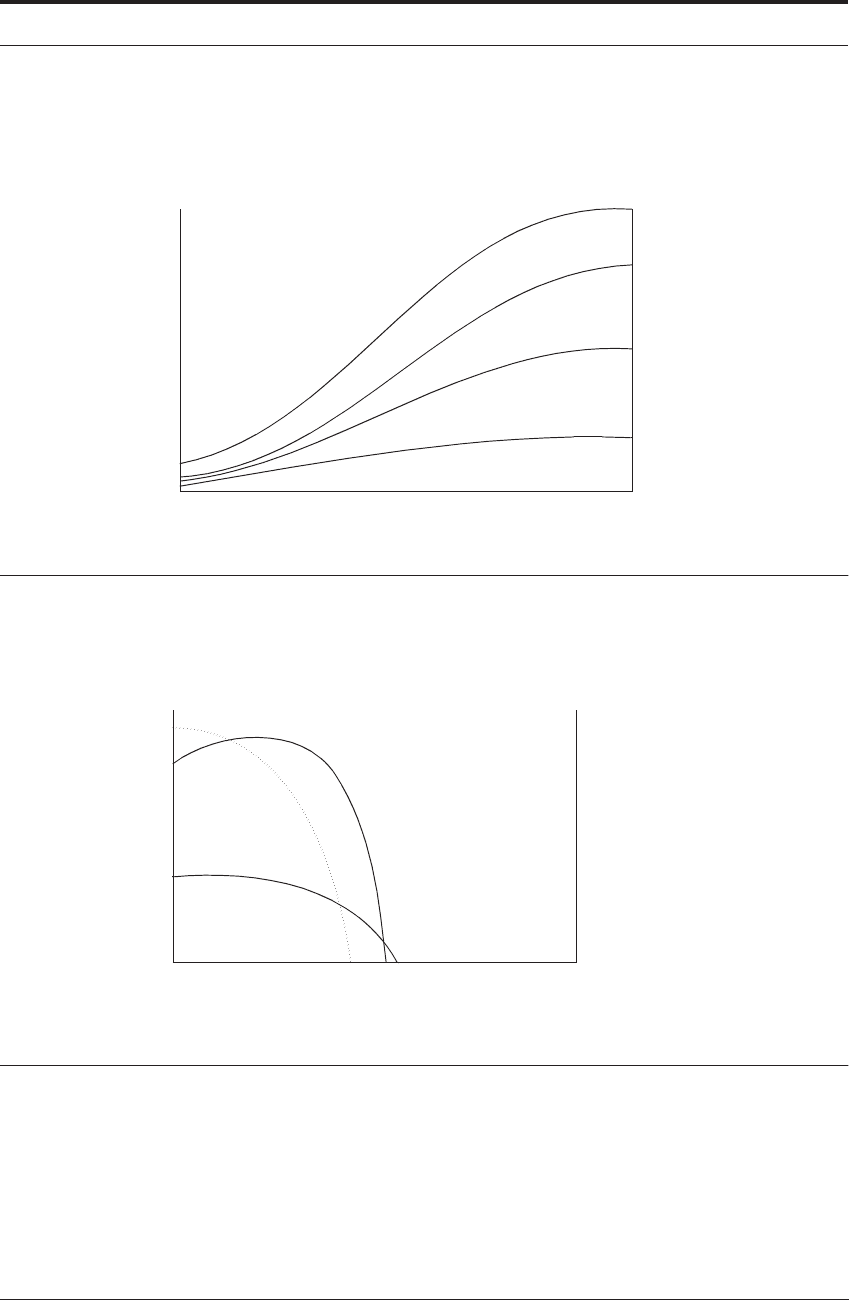
This next set of curves plots the left side (A= βsin
2
φ) of the above equation against the shear
angle:
FIGURE 4.7 Effect of φ and β on A = βsin
2
φ
This next set is the right side (B= cosαcos(2φ − α)/χ) against the shear angle:
FIGURE 4.8 Effect of φ, α, and χ on B = cosαcos(2φ − α)/χ
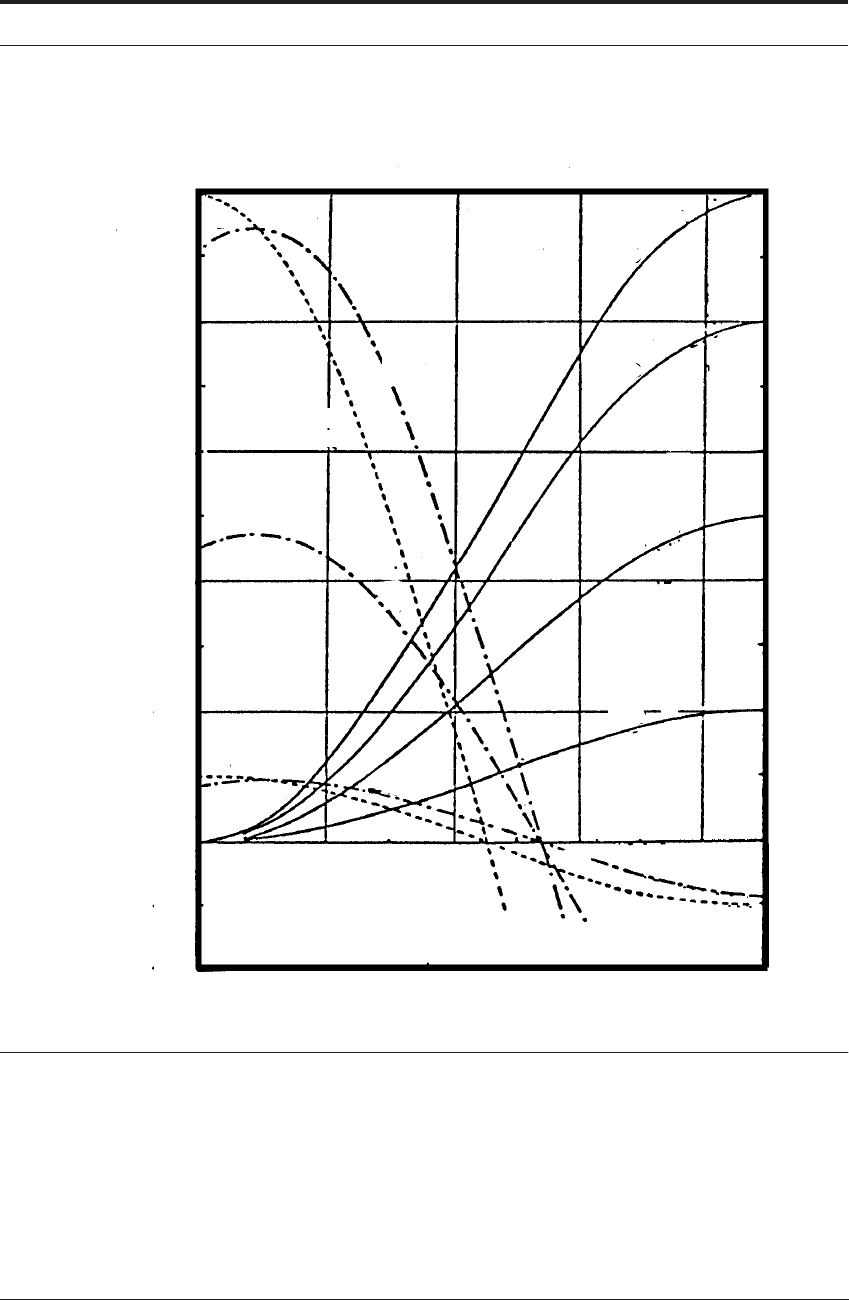
For different values of rake angle (α) friction condition (β) and contact lengths (χ) the Rowe
and Spick equation can be solved graphically for shear angle (
φ).
This could be computed to get the value of the shear plane angle, but the intersection of the
graphs in Figure 4.9 shows how the physical parameters influence the situation.
If the curves are superimposed, the intersection gives the value of for different values of χ,
β, and α.
A
0
o
A = βsin
2
φ
φ
90
ο
0.5
0.2
0
0.8
β = 1
Β
0
o
φ
90
ο
α = 0
χ = 1
α = 18
χ = 2
α = 18
χ = 1.0
ο
ο
ο
Β = cosαcos(2φ − α)/χ
φ

THE SHEAR PLANE AND MINIMUM ENERGY THEORY 71
For reference, some standard values are:
• χ: for free-machining steel = 1.
• β: for most turning operations, β = 0.8 to 1.
• α: this is a constant set by tooling choices. Most often, it is six degrees.
Since α is a constant and β is unity to a first approximation, a value of the shear plane angle
can be obtained by making a reasonable assumption about (χ). It is possible to grind the tool in
such a way as to fix (χ). And tools like this are often used in practice to curl the chip deliberately,
so this idea is not totally contrived. Once the value of , has been fixed, and the value of β is
assumed to be unity for free-machining steel, the shear plane angle can be predicted and impor-
tant parameters such as the cutting forces can be calculated.
As a final check the reader is invited to pin-point the shear plane angle for:
• Rake angle = 18 degrees, full sticking friction and contact length equal to the undeformed chip
thickness.
• Rake angle = 0 degrees, =0.8 and contact length equal to the undeformed chip thickness.
In the simple model, the force along the primary shear plane OD, can now be calculated using
the predicted value of the shear plane angle:
Also the resolved force along the rake face OB
´ can be calculated as
These forces can be resolved into the main cutting force directions F
C
and F
t
as follows:
Solving these equations simultaneously gives a final equation only in F
C
(4.24)
To summarize, if all the cutting conditions are held constant, it is found that the rate of work
on the shear plane is proportional to 1/sin φ cos φ, which has been shown to be the amount of
strain (γ) on the shear plane (Equation 3.5) when the rake angle (α) = 0°. Curve #1 in Figure
4.10 shows how the work done on the shear plane varies with the shear plane angle, and this has,
of course, the same shape as the curve for zero rake angle in Figure 3.4, with a minimum at φ =
45°.
χ
β
F
OD
kwt
1
⋅⋅
φsin
--------------------=
F
OB′
k OB′⋅
kχ t
1
αcos
------------==
F
c
F
OD
F
t
φsin–
φcos
---------------------------------=
F
t
F
OB′
F
c
αsin–
αcos
------------------------------------=
F
c
1
φcos αtan φsin+()
----------------------------------------------
kwt
1
φsin
-------------
kχt
1
α
2
cos
--------------–
⎝⎠
⎛⎞
=
72 FORCES AND STRESSES IN METAL CUTTING
FIGURE 4.9 Intersection of curves gives the value of shear plane angle (from Rowe & Spick 1966)
Thus, if the feed force F
t
and the work done on the rake face were so small that they could be
neglected, the minimum energy theory proposes that the shear plane angle would be 45
°
, with the
chip thickness t
2
equal to the feed t
1
. Where the rake angle is higher than zero, the minimum
work is at a shear plane angle higher than 45°, but always at a value where t
2
= t
1
. In practice, the
chip is sometimes approximately equal in thickness to the feed, never thinner, but often much
thicker.
From curve 2, Figure 4.10, dW
r
/dt is seen to increase with the shear plane angle.
NUMERICAL VALUE OF A & B
10
0.8
0.6
0.4
+0.2
+0.1
0
-0.1
-0.2
20 40 8060
β=1.0
Β
Β
Β
Α
Α
Α
0.8
0.5
0.2
β=0
0°
10
18°
10
18°
2
α=0°
χ=1
χ=10°
α=18°