Trent E.M., Wright P.K. Metal Cutting
Подождите немного. Документ загружается.

STRESS DISTRIBUTION 83
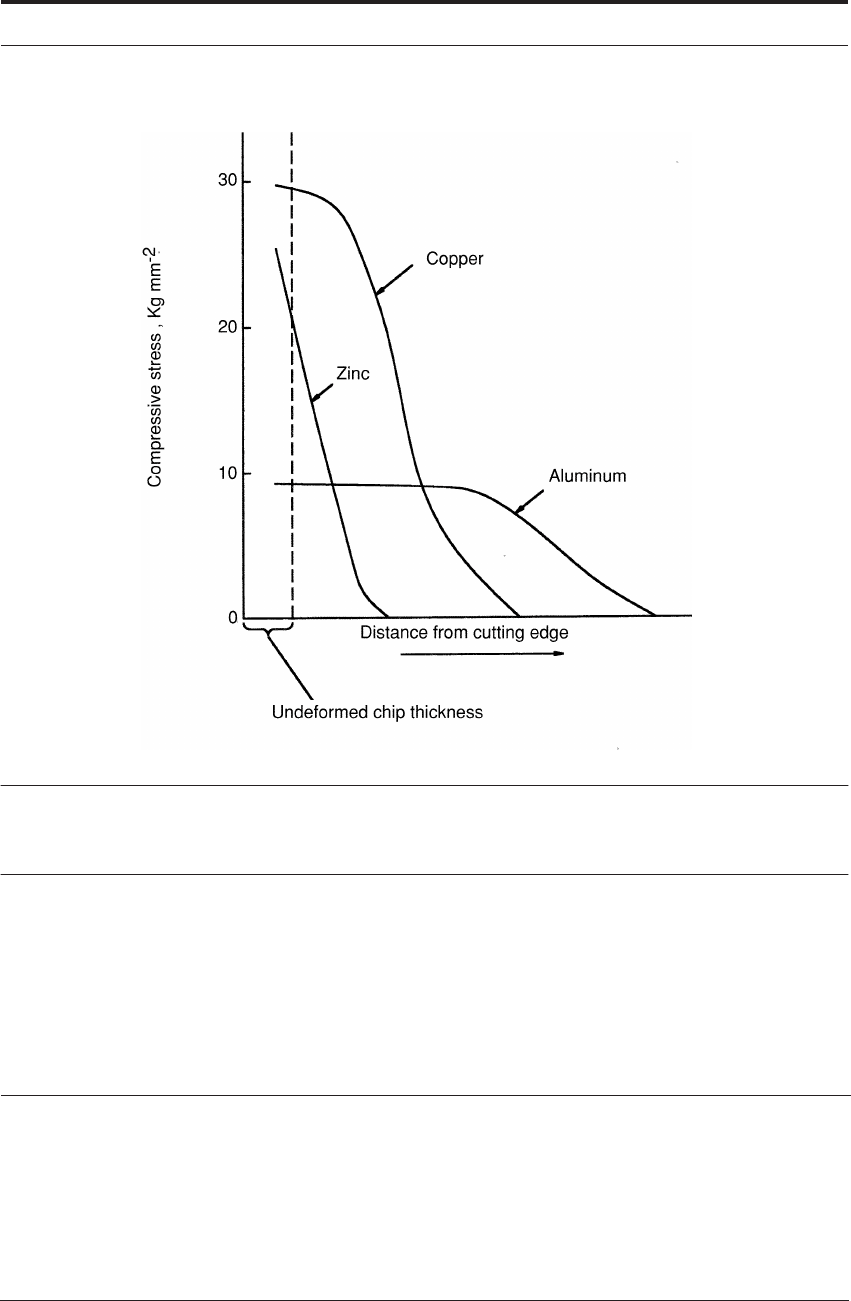
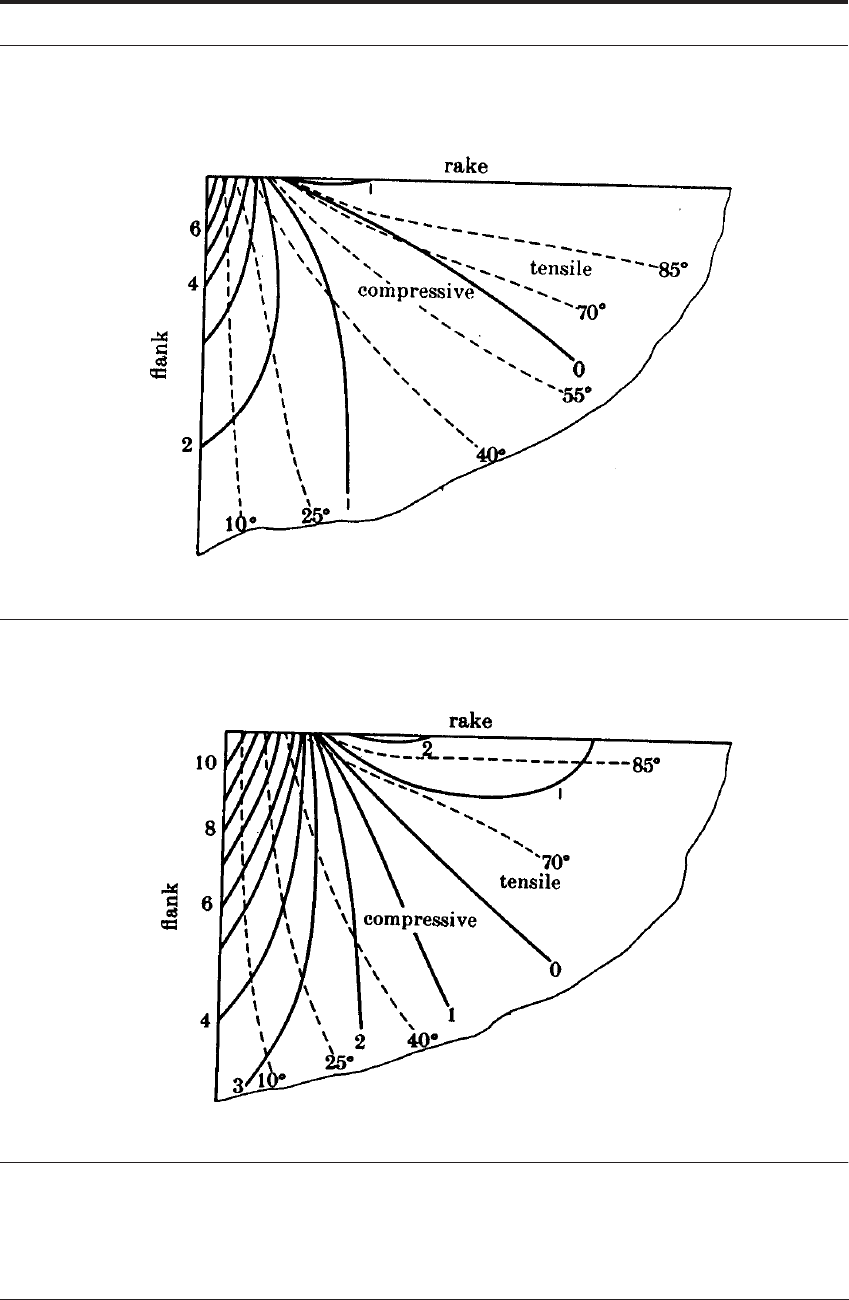
FIGURE 4.16 Distribution of compressive stress on rake face of tools used to cut three metals (After Kato
et al.
13
)
TABLE 4.6 Work material strength (Data after Kato et al.
13
)
4.7.3 Experiments with tools of different strengths
A second method to estimate distribution of compressive stress is by use of a series of tools of
different hardness levels and known yield strength. A tool with adequate yield strength is not
deformed plastically during cutting, but if the yield strength is too low, the tool edge is perma-
nently deformed downward.
Work
material
Maximum compressive
stress on tool
(MPa)
Compressive yield strength
of work material at ε = 0.2
(MPa)
Aluminium 83 93
Copper 284 294
Zinc 245 304

84 FORCES AND STRESSES IN METAL CUTTING
An estimate of the distribution of stress can be made by cutting the workpiece with a series of
tools of decreasing yield strength and measuring the permanent deformation of each edge. This
method was explored by Rowe and Wilcox
14
at low cutting speeds to avoid any heating of the
tool which would alter its yield strength. The published results agree with the other methods,
indicating a maximum compressive stress near the tool edge. For use over a wide range of speed,
temperature measurement in the tool would be required as well as knowledge of the variation of
yield strength of the tool with temperature.
4.7.4 Experiments with photoelastic polymers
A photo-elastic method uses a tool made of a polymer such as PVC. Because of the low
strength of the polymer, and the rapid drop in strength with temperature, these tools can be used
for the cutting only of soft metals of low melting points such as lead and tin, and the cutting
speed must be kept low. Figure 4.17 is a photograph of a photo-elastic tool taken with mono-
chromatic light, while cutting lead at 3.1 m min
-1
(10 ft/min) and a feed of 0.46 mm rev
-1
(0.0185 in/rev).
15
The dark and light bands are regions of equal strain within the tool and, from
these, the distribution of compressive and shear stress can be determined.
FIGURE 4.17 Stress distribution in photo-elastic model tool when cutting lead (Courtesy of E. Amini
15
)
STRESS DISTRIBUTION 85
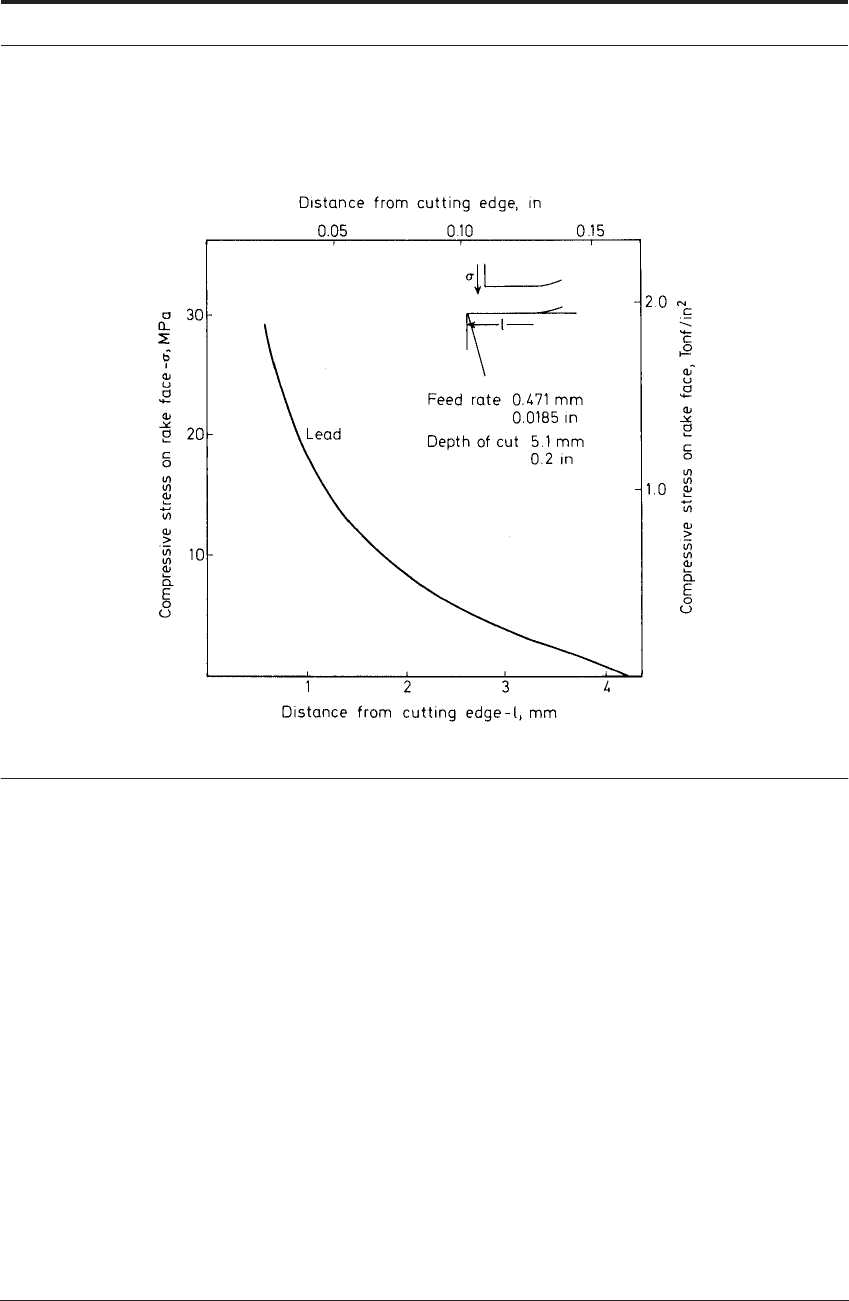
Figure 4.18 is an example of the type of stress distribution found.
FIGURE 4.18 Compressive stress on rake face calculated from photo-elastic tool, as in Figure 4.17 (From
data of E. Amini
15
)
4.7.5 Experiments with photoelastic sapphire
Stress birefringence in sapphire tools can also be used to determine the stress boundary condi-
tions in machining. The stress birefringence effect in sapphire is relatively weak and, of course,
sapphire is inherently brittle. Despite these difficulties, Bagchi and Wright
16
were able to
machine steel and brass specimens at speeds of up to 75 m min
-1
and at a maximum feed rate of
0.381 mm per revolution to study the effect of speed and feed rate on stress distributions.
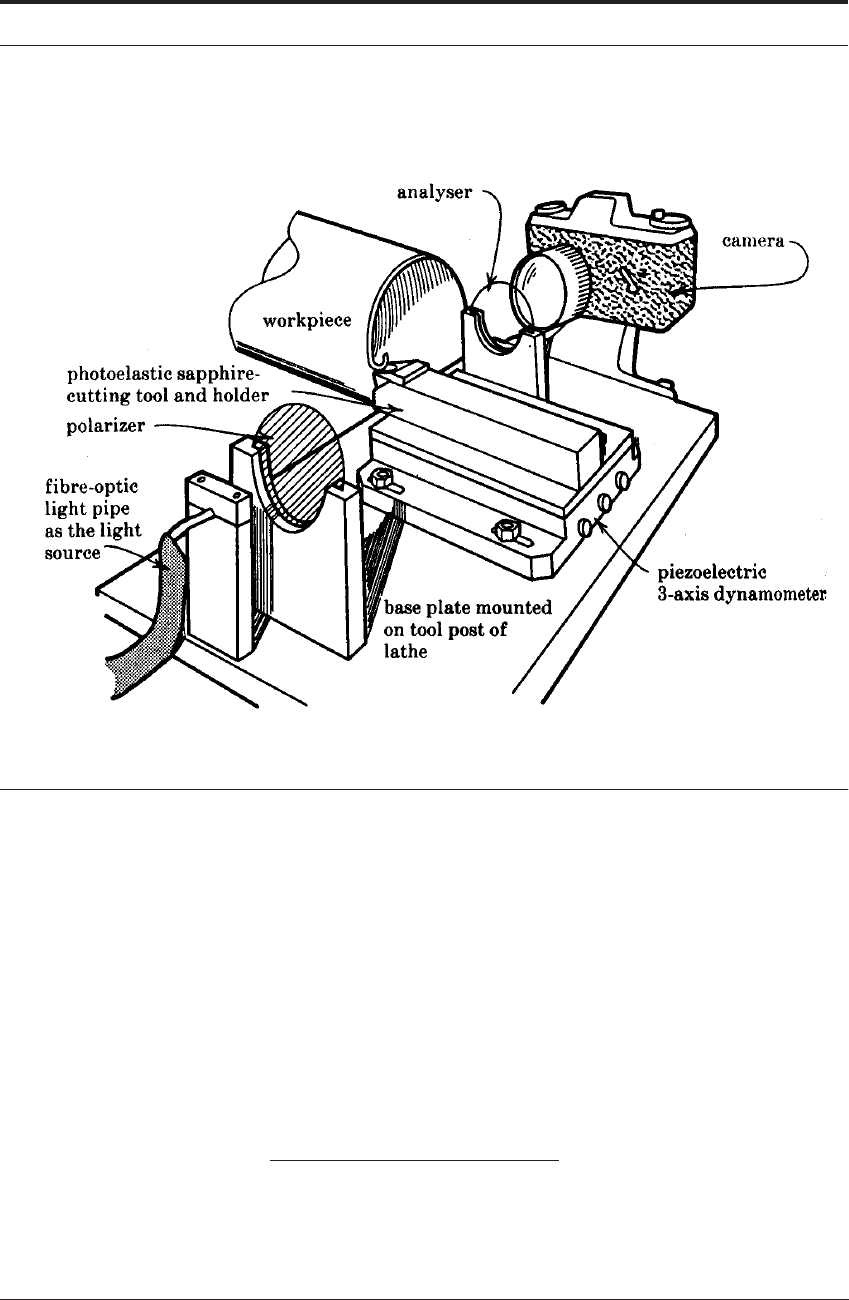
As shown in Figure 4.19, the tool holder was set up on a photoelastic bench on top of a three-
axis piezoelectric dynamometer, which measured the x, y and z components of the force on the
tool during machining. The x-direction on the dynamometer was parallel to the cutting during
machining, the y-direction normal to the cutting edge and on a horizontal plane containing the
edge, and z-direction orthogonal to the x and y plane. The photoelastic bench, sapphire insert and
tool holder were mounted on the carriage of the lathe.
AISI 1020 and 12L14 steels, and 360 brass
in the form of tubular sections made from round bars were used as work materials. Each of these
materials exhibited similar machining characteristics and produced continuous chips for the cut-
ting conditions used.
86 FORCES AND STRESSES IN METAL CUTTING
FIGURE 4.19 View of the experimental arrangement used for photoelastic stress analysis in machining.
The transparent, rectangular, parallelepiped photoelastic sapphire tool (7 x 10 x 15 mm
3
) was
mounted in a tool holder with a -5° rake and a 5° clearance angle, which supported the insert
only on its back and bottom faces. This ensured that the sides of the crystal, that is, the c-faces,
were stress free, thus conforming to plane stress conditions for the analysis. A suitably shaped
window in the tool holder permitted the observation and recording of the photoelastic fringes
during machining.
Fast-frame photography allowed a series of images to be collected. These had a similar
appearance to Figure 4.17. A first set of color images provided “isochromatic fringes”. These are
“contours of light extinction” that correspond to positions where the difference in the principal
stress values is equal to an integer value of wavelength.
†
A second set of black and white images
†
An easy to read review of stress analysis with photoelasticity may be found in “Advanced Strength and Applied
Stress Analysis” by R.G. Budynas, 1977, McGraw Hill, Pages 375 et seq. The basic photoelastic equation is (σ
1
− σ
2
)
= Νλ/f
a
t where N = 0,1,2,3,4... In this equation, σ is a principal stress value, N is zero or an integer, λ is traditionally
used for the wavelength of the light, f
a
is the stress-optical coefficient for the material being used and t is the thickness
of the model being studied, in this case the cutting tool thickness in Figure 4.19.
STRESS DISTRIBUTION 87
provided the “isoclinic fringes” ( ). These occur when either of the principal stresses are aligned
with the polarizer. Each photoelasticity experiment, with a fixed orientation of the crossed polar-
izer-analyser combination, can produce only a single isoclinic. Therefore, each experiment was
repeated (with identical speed and feed rate) for six orientations of polarizer-analyser settings to
obtain six isoclinics.
The three unknown quantities in the stress field are
σ
z
, σ
x
and τ
xy
. Because only two indepen-
dent parameters are known, it is not possible to determine the three unknowns uniquely from
these two parameters. A third independent relationship or parameter is necessary for separating
the stresses. The shear-difference method was thus selected and used by Bagchi and Wright to
calculate the normal and shear stresses from isochromatics and isoclinics obtained experimen-
tally. The composite isochromatic and isoclinic contours for the three cutting conditions are
shown in Figures 4.20 to 4.22. The rake surface stress distribution for these three machining con-
ditions - from the experimentally obtained isochromatics and isoclinics, and the shear difference
method - are shown in Figures 4.23 to 4.25.
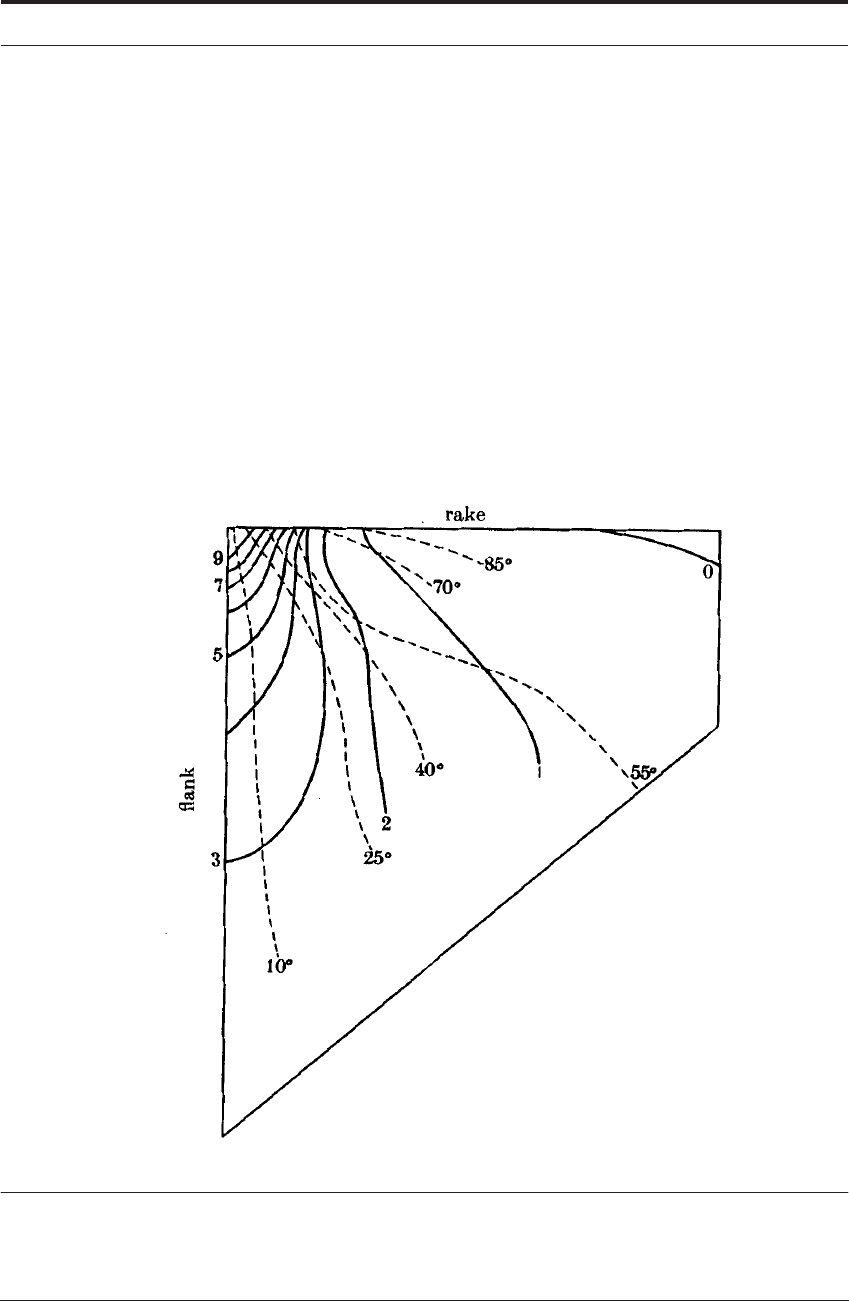
FIGURE 4.20 Composite isochromatics and isoclinics obtained during the machining of 1020 steel at 10
m min
-1
and an uncut chip thickness of 0.132mm. Solid lines; isochromatics, dashed lines isoclinics.
θ
88 FORCES AND STRESSES IN METAL CUTTING
FIGURE 4.21 Composite isochromatics and isoclinics obtained during the machining of 12L14 steel at 75
m min
-1
and an uncut chip thickness of 0.132mm. Solid lines, isochromatics; dashed lines, isoclinics.
FIGURE 4.22 Composite isochromatics and isoclinics obtained during the machining of 12L14 steel at 75
m min
-1
and an uncut chip thickness of 0.381mm. Solid lines, isochromatics; dashed lines, isoclinics.
STRESS DISTRIBUTION 89
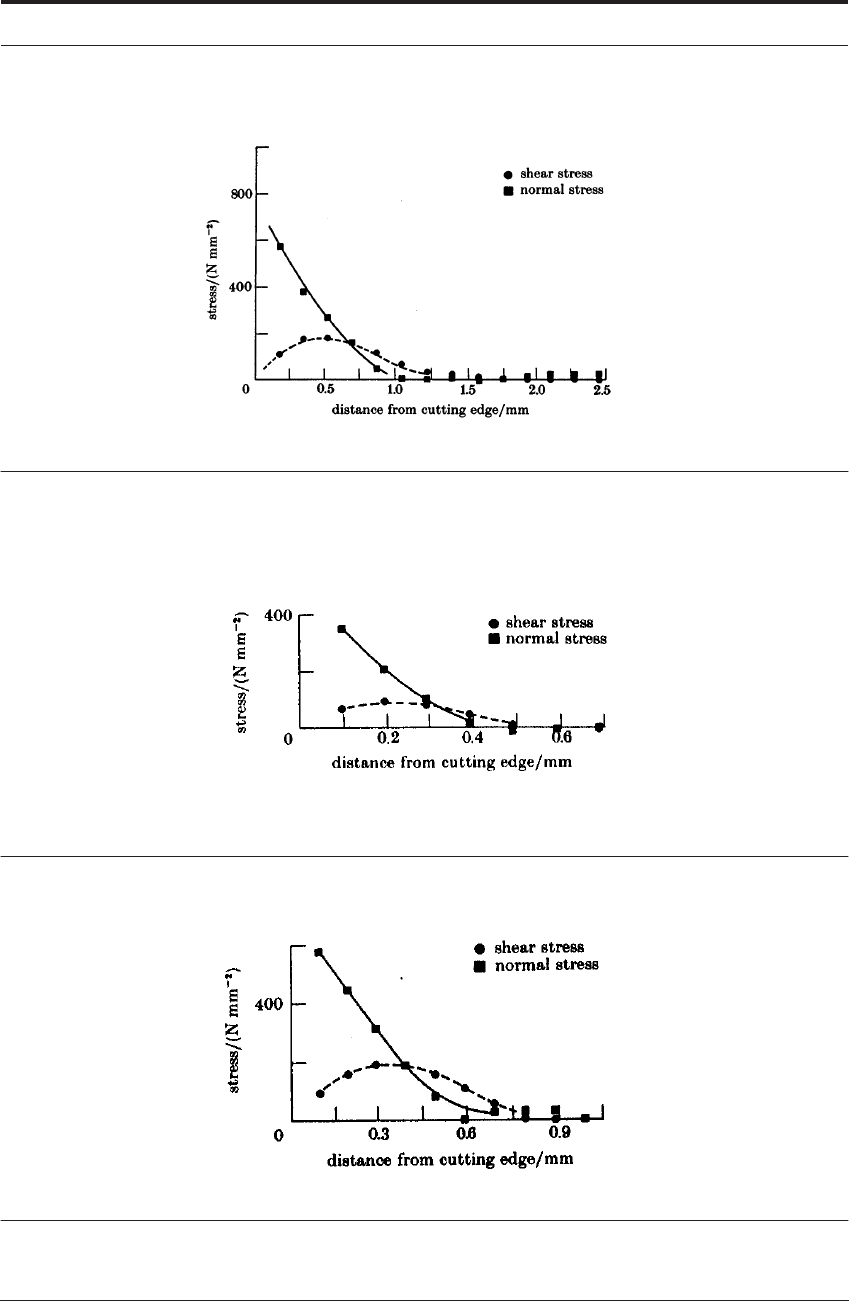
FIGURE 4.23 Normal and shear stress distributions along the rake face surface during the machining of
1020 steel at 10 m min
-1
and an uncut chip thickness of 0.132 mm.
FIGURE 4.24 Normal and shear stress distributions along the rake face surface during the machining of
12L14 steel at 75 m min
-1
and an uncut chip thickness of 0.132 mm.
FIGURE 4.25 Normal and shear stress distributions along the rake face surface during the machining of
12L14 steel at 75 m min
-1
and an uncut chip thickness of 0.381mm.

90 FORCES AND STRESSES IN METAL CUTTING
These rake-face normal and shear-stress distributions for the cutting conditions shown, quali-
tatively resemble those obtained by Chandrasekaran and Kapoor
17
who machined commercially
pure lead with a -10 degree rake angle epoxy resin tool. In the recent set of experiments with sap-
phire tools it was found that the boundary stress distributions varied with the speed and feed rate
as expected, although the variation was more pronounced with respect to feed rate.
4.7.6 Normal stress distribution: typical results
4.7.6.1 Influence of speed
TABLE 4.7 Comparisons of the Rake-face Stress Distributions from Photoelastic Analysis for
Different Machining Conditions
It can be seen in Table 4.7 that the maximum normal stress at the edge decreased by only 10%
for 650% increase in speed (from 10 to 75 m min
-1
) at 0.132 mm per revolution feed rate. At a
feed rate of 0.381 mm per revolution, although the speed was increased by 200% (from 25 to 75
m min
-1
) the decrease in peak stress was not noticeable. The variation in the stresses calculated
from experimental data closest to the cutting edge also showed the same trend. Such small
changes were not considered to be indicative of any variation of the stresses with speed.
4.7.7 Influence of feed rate
The variation of the normal stresses with feed rate was more noticeable. The rake-face normal
stresses increased by a factor of 1.5 when the feed rate was increased near three times from 0.132
to 0.381 mm per revolution. It is thus clear that the interfacial stresses increase with the uncut
chip thickness. However experimentation over a broader range of feed rates will be necessary
before any functional relationship between stresses and feed rate can be established.
The experimental data was also approximately validated by comparing the total normal force
measured by the 3 axis dynamometer with that obtained by integrating the normal stress distribu-
tion from photoelastic stress analysis (Figures 4.23 to 4.25) over the entire contact length. Table
4.8 shows the comparison between the rake face normal forces calculated from photoelastic
work
material
speed
m min
-1
thickness
(uncut chip)
mm
width
(uncut
chip)
mm
Cutting Forces
for F
f
and F
c
newtons
average
normal
stress
MPa
peak
normal
stress
MPa
360 brass 60 0.132 5.00 947 1373 --- 600
1020 steel 10 0.132 4.50 1225 1778 --- 565
12L14 steel 10 0.132 5.00 558 1307 286 580
12L14 steel 25 0.132 4.84 294 904 326 490
12L14 steel 75 0.132 4.93 201 821 339 530
12L14 steel 25 0.381 5.00 847 2633 498 800
12L14 steel 75 0.381 4.99 450 2140 495 840

STRESS DISTRIBUTION 91
stress analysis and those measured by the dynamometer. It can be seen that the maximum error is
32% but the mean absolute error is 14.3% and the mean error is 10.5%. Owing to the variabilities
inherent in chip formation a difference of 10-15% between the maximum and minimum mea-
sured force can be expected within a sequence of experiments.
TABLE 4.8 Comparison of the Rake-face Normal Cutting Forces from Photoelastic Analysis with
Dynamometer Measurements
4.7.8 Shear stress distribution: typical results
It is noteworthy that the shear stress in Figures 4.23-4.25 is low immediately behind the cut-
ting edge, increasing to a maximum over the remainder of the contact length before decreasing,
as might be expected, at the rear of contact as the chip leaves the tool face. This was also
observed in movie-films taken through the back-face of the transparent sapphire tools.
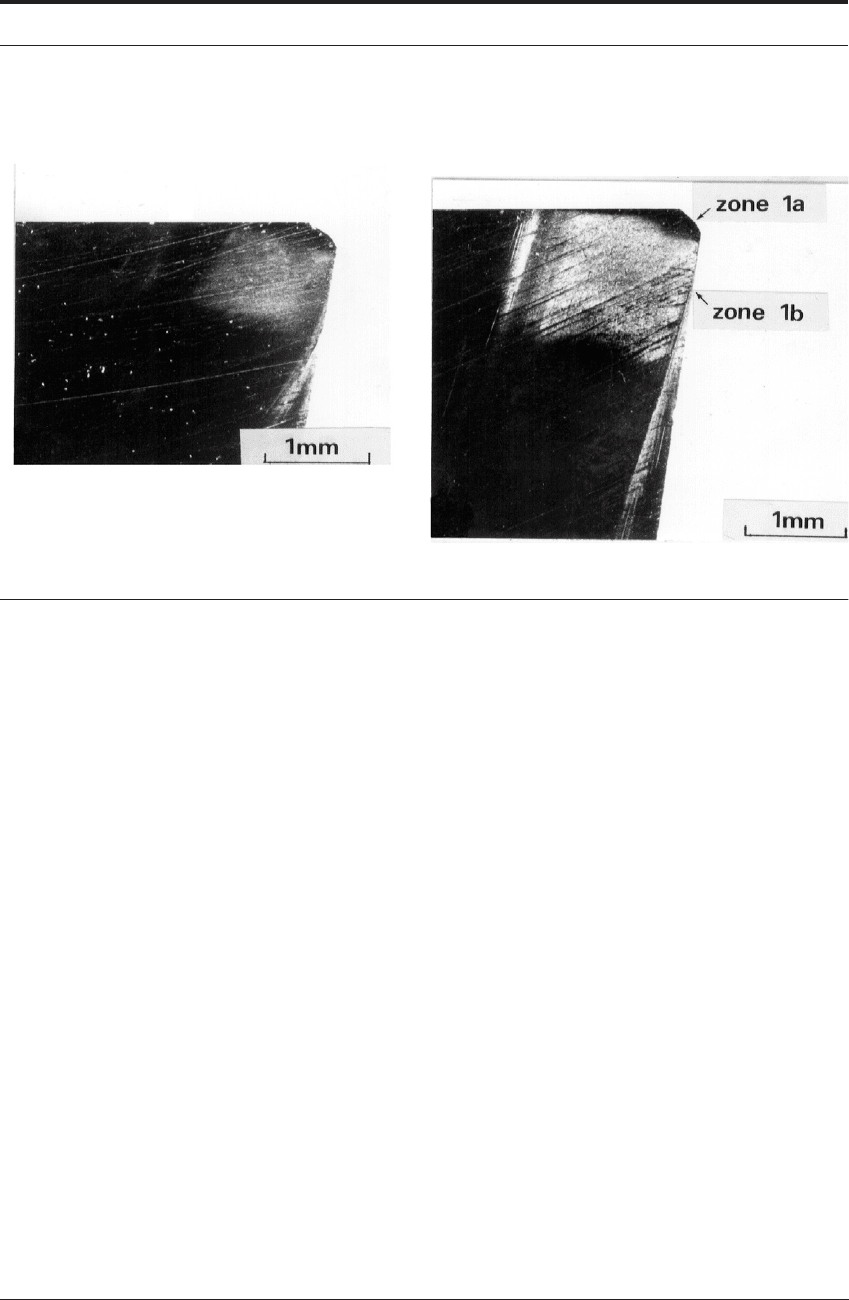
In Doyle et al’s work
18
copper coatings were evaporated on to sapphire tools before cutting
lead. It was found that the coating was sheared away in the main part of the contact area (a region
they termed zone 1b) but not in the region immediately behind the cutting edge (termed zone
1a).
Similarly, Wright
19
demonstrated the same partition into zones 1a and 1b by spraying enamel
paint onto the sapphire tools before cutting soft workmaterials. Once again the region close to
the edge remained covered in paint indicating a lower imposed shear stress in that region. After
cutting a wide range of materials at both low and high speeds, low magnification photography of
the rake faces of the tools showed that there is generally less transfer near the cutting edge, par-
ticularly for soft work materials (Figures 4.26a and b).
work
material
cutting
speed
m min
-1
uncut chip
thickness/
mm
normal force
(dynamometer)
in Newtons
normal force
(photoelastic)
in Newtons
difference
between
dynamometer
and photoelastic
forces (%)
brass 60 0.132 1450 1462 -0.8
1020 10 0.132 1877 2165 -15
12L14 10 0.132 1350 1787 -32
12L14 25 0.132 926 1150 -24
12L14 75 0.132 835 961 -15
12L14 25 0.381 2696 2582 +4
12L14 75 0.381 2171 1968 +9
92 FORCES AND STRESSES IN METAL CUTTING
FIGURE 4.26 Rake face photographs at x25 magnification confirming the reduced transfer and hence
shear stress in Zone 1a.
18,19
From machining copper at 120 m min
-1
for a) only 5 seconds and b) 50
seconds. Longer cutting times “clean-up” any organic films on rake face, creating increased amounts of the
seizure type contact as time progresses.
Photomicographs of sections through partially formed chips show that the zone 1a feature is
associated with the way in which material flows around the cutting edge. Metallography has
been carried out and Figure 4.27 shows a section through a copper quick-stop produced at 25
mm s
-1
. In this case the zone 1a region varied in length from 0.2 to 0.3mm. These lengths are
shown by OP and OQ in Figure 4.28. It is emphasized that the total length of zones 1a and 1b
was 3.1mm and that the first 1.2 mm only is shown in Figures 4.27 and 4.28.
The work material is initially sheared in the primary zone and the equiaxed grains of copper
are deformed to such an extent that the grain boundaries appear as single lines AB. Such lines
then show the deformation flow pattern. In the chip, all these deformation lines show a point of
inflection. This is marked along EF and may first be detected in the line CD. At C, material con-
tinues to flow into the machined bar whereas at D, material is turning into the chip.
As the chip is formed, such deformation lines bend towards the rake face as shown in the pro-
gression from CD to EF. The lines GH and IJ are further development of this process, but in
these cases the deformation line terminates at the rake face rather than in the machined surface.
Finally, the line KLMN contacts the rake face as the tangent at M. Beyond M all the lines curve
in towards the tool to meet the rake face at ~0°. In contrast, between 0 and M there is a region,
approximately bounded by KLM and the rake face, where the flow pattern is substantially differ-
ent from that beyond M.