Stewart J. College Algebra: Concepts and Contexts
Подождите немного. Документ загружается.

34 CHAPTER 1
■
Data, Functions, and Models
temperature. The table below gives data for the boiling point of water at different elevations.
(a) Use first differences to show that a linear model is appropriate for the data.
(b) Find a linear model for the relation between boiling point and elevation.
(c) Use the model to predict the boiling point of water at the peak of Mount
Kilimanjaro, 19,340 ft above sea level.
Elevation
above base (m)
Temperature
(°C)
First
difference
0 30 —
400 28
800 26
1200 24
1600 22
2000 20
23. Chocolate-Powered Car Two British entrepreneurs, Andy Pag and John Grimshaw,
drove 4500 miles from England to Timbuktu, Mali, in a truck powered by chocolate. They
used an ethanol that is made from old, unusable chocolate, and it took about 17 pounds of
chocolate to make 1 gallon of ethanol. The table in the margin gives data for the
relationship between the amount of chocolate used and the number of miles driven.
(a) Use first differences to show that a linear model is appropriate for the data.
(b) Find a linear model for the relation between the amount of chocolate used and the
number of miles driven.
(c) Use the model found in part (b) to predict how many pounds of chocolate it took to
drive from England to Timbuktu.
Miles
driven
Pounds of
chocolate used
0
0
20
17
40
34
60
51
80
68
100
85
Peter Zaharov/Shutterstock.com 2009
Elevation
(ⴛ 1000 ft)
Boiling point
(°F)
First
difference
0 212.0 —
1 210.2
2 208.4
3 206.6
4 204.8
5 203.0
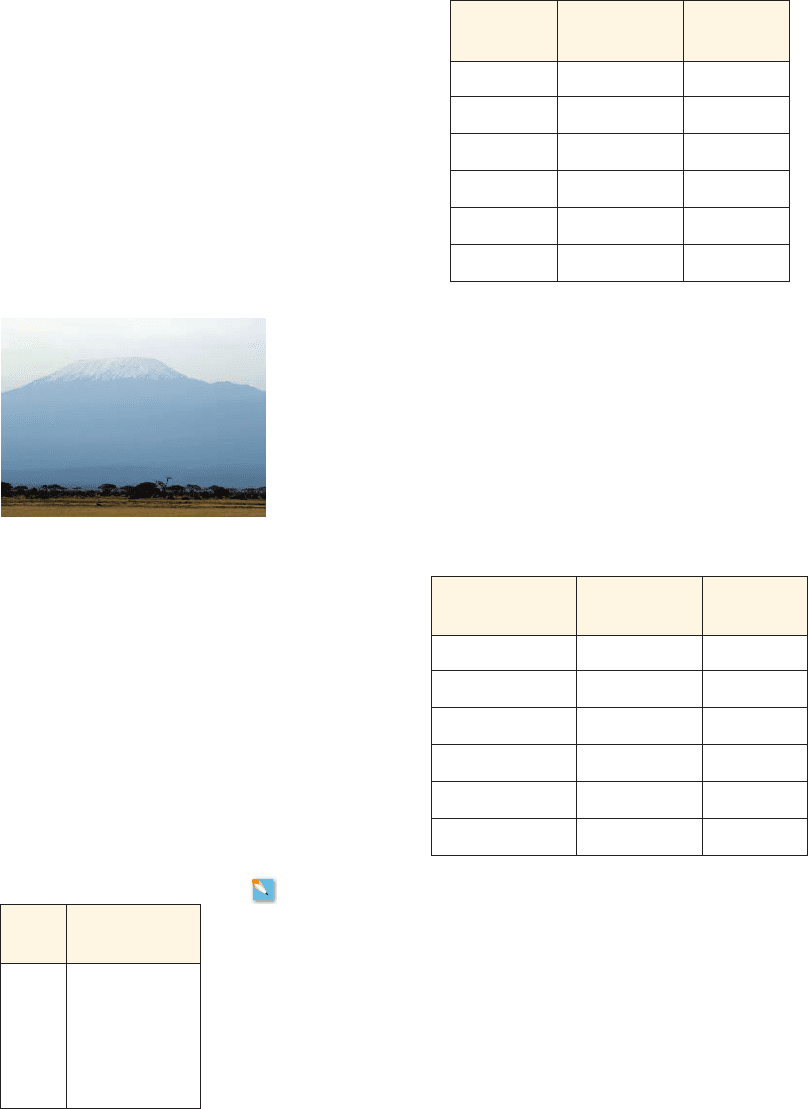
22. Temperatures on Mount Kilimanjaro Mount Kilimanjaro is the highest mountain
in Africa. Its snow-covered peak rises 4800 m above the surrounding plain. It is located
in northern Tanzania near the equator, and conditions on the mountain vary from
equatorial, to tropical, to arctic, because of the steadily decreasing temperature as the
altitude increases. The table below gives data for the temperature on a typical day on
Kilimanjaro at various elevations above the base of the mountain.
(a) Use first differences to show that a linear model is appropriate for the data.
(b) Find a linear model for the relation between the temperature on Kilimanjaro and
the elevation above the base of the mountain.
(c) Use the model to predict what the temperature will be on a typical day at the peak
of Kilimanjaro.Mount Kilimanjaro
SECTION 1.4
■
Functions: Describing Change 35
200
190
180
170
Salary (⫻ $1000)
160
150
42
Year
315
0
x
y
24. Profit An Internet company sells cell phone accessories. The table in the margin gives
the profit they make on selling battery chargers. (Note that negative numbers in the
table represent a loss.) Because of storage costs, the company needs to sell at least 20
chargers before they begin to make a profit.
(a) Find a linear model for the relation between profit and the number of battery
chargers sold.
(b) Draw a graph of the equation you found.
(c) Use the model to predict the profit from selling 150 battery chargers.
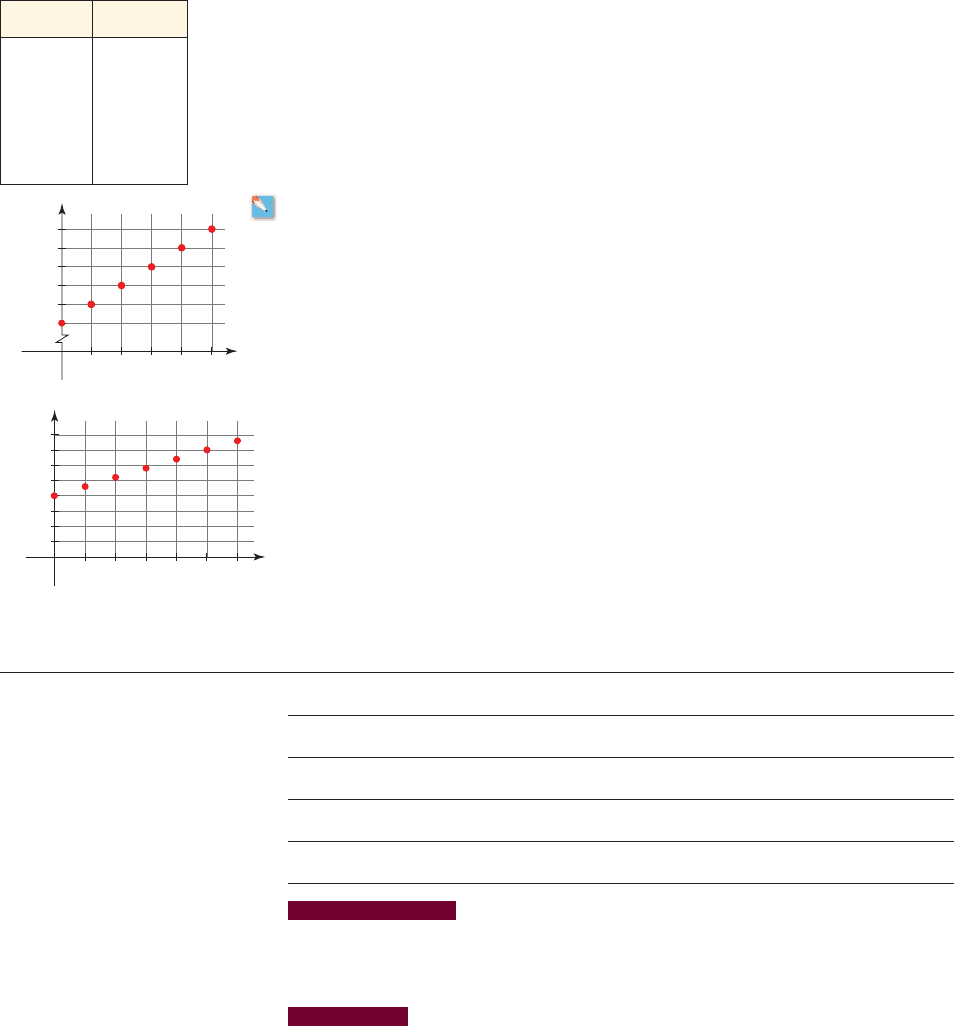
25. Salary A woman is hired as CEO of a small company and is offered a salary of
$150,000 for the first year. In addition, she is promised regular salary increases. The
graph in the margin shows her potential salary (in thousands of dollars) for the first few
years that she works for the company.
(a) Find a linear model for the relation between her salary and the number of years she
works for the company.
(b) Use the model to predict what her salary will be after she has worked 10 years for
the company.
26. Library Book Collection A city library remodeled and expanded in the year 2001
and increased its maximum capacity to about 100,000 books. In 2001 the library held
about 20,000 books, and each subsequent year the library adds a fixed number of books
to its collection. The graph in the margin plots the number of books (in thousands) the
library held each year from 2001 to 2007.
(a) Find a linear model for the relation between the number of books in the library and
the number of years since 2001.
(b) Use the model to predict the number of books in the library after 25 years (in 2026).
40
Books (thousands)
30
20
10
42
Years since 2001
3165
0
x
y
2
1.4 Functions: Describing Change
■
Definition of Function
■
Which Two-Variable Data Represent Functions?
■
Which Equations Represent Functions?
■
Which Graphs Represent Functions?
■
Four Ways to Represent a Function
IN THIS SECTION… we begin our study of functions. There are four basic ways to
represent functions: words, data, equations, and graphs. The concept of function is a
versatile tool for modeling the real world. In succeeding chapters we study more properties
of functions; each new property provides a new modeling tool.
GET READY… by reviewing how to solve equations in Algebra Toolkit C.1. Test your
skill by doing the Algebra Checkpoint at the end of this section.
In Sections 1.1–1.3 we saw how analyzing two-variable data can reveal relationships
between the variables. Such relationships can be seen from the data themselves, from
a graph, or from an equation. But this is not the whole story; in many real-world sit-
uations we are interested in how a change in one variable results in a change in the
other variable. We’ll study these types of relations using the concept of function.
Equipped with this concept, we will be able make a great leap in our understanding
of our ever-changing world.
Number Profit ($)
0
- 80.00
10
- 40.00
20 0.00
30 40.00
40 80.00
50 120.00
2
■ Definition of Function
We use the term function to describe the dependence of one changing quantity on an-
other. For example, we say that the height of a child is a function of the child’s age,
the weather is a function of the date, the cost of mailing a package is a function of its
weight, and so on. Situations like these, which involve change, have the property that
each input (or each value for the first variable) results in exactly one output (exactly
one value for the other variable). For instance, mailing a package does not result in
two different costs. This leads us to the following definition of function.
Definition of Function
A function is a relation in which each input gives exactly one output.
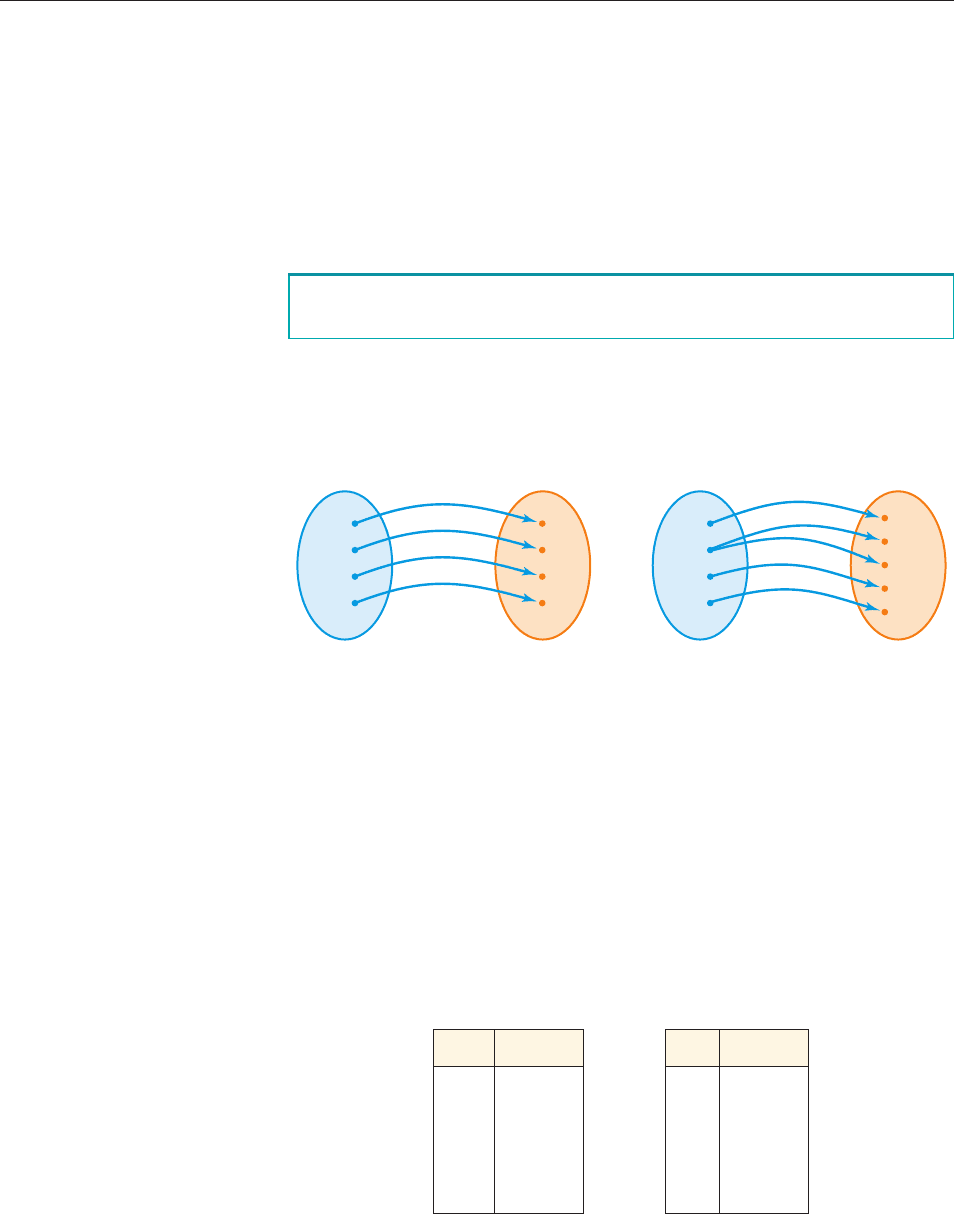
We can easily tell whether a relation is a function by making a diagram, as we did in
Section 1.2. The diagram in Figure 1(a) represents a function because for each input
there is exactly one output. But the relation described by the diagram in Figure 1(b)
is not a function—the input 2 corresponds to two different outputs, 20 and 30.
1
2
3
4
40
30
20
10
Outputs
(
a
)
A function
(
b
)
Not a function
Inputs
1
2
3
4
10
20
30
40
50
OutputsInputs
figure 1 When is a relation a function?
example
1
Which Relations Are Functions?
A relation is given by a table. The input is in the first column, and the output in the
second column. Is the relation a function?
(a) Table 1 gives the number of women in the U.S. Senate between 1997 and 2007.
(b) Table 2 gives the ages of women in a certain neighborhood and the number of
children each woman has.
Year Number
1997 9
1999 9
2001 14
2003 14
2005 14
2007 16
table 1
Women in U.S. Senate
Age Number
31 3
32 0
24 1
35 1
31 2
22 0
table 2
Number of children
36 CHAPTER 1
■
Data, Functions, and Models

SECTION 1.4
■
Functions: Describing Change 37
Solution
(a) This relation is a function because each input (year) corresponds to exactly
one output (the number of women in the Senate that year).
(b) This relation is not a function because the input 31 gives two different outputs
(3 and 2).
■ NOW TRY EXERCISES 7 AND 9 ■
Notice the difference between the two relations in Example 1. The first rela-
tion is a function, so the year determines the number of women in the senate. The
second relation is not a function—the age of a woman does not determine how
many children she has; women of the same age can have different numbers of
children.
2
■ Which Two-Variable Data Represent Functions?
From the definition of function we see that two-variable data represent a function if
to each value of the input variable there is exactly one value for the output variable.
Since the output depends entirely on the input, we call the output variable the de-
pendent variable and the input variable the independent variable.
Dependent and Independent Variables
example
2
Independent and Dependent Variables
Two-variable data are given in the table in the margin.
(a) Is the variable y a function of the variable x? If so, which is the independent
variable and which is the dependent variable?
(b) Is the variable x a function of the variable y? If so, which is the independent
variable and which is the dependent variable?
Solution
(a) The variable y is a function of the variable x because each value of x corre-
sponds to exactly one value of y. Since y is a function of x, the variable x is the
independent variable (the input), and the variable y is the dependent variable
(the output).
(b) The variable x is not a function of the variable y because when the input y is
22, there are two different outputs (1 and 2).
■ NOW TRY EXERCISE 11 ■
1. A variable y is a function of a variable x if each value of x (the input)
corresponds to exactly one value of y (the output). In this case we simply
say
“y is a function of x”
2. If y is a function of x, then the input variable x is called the independent
variable, and the output variable y is called the dependent variable.
x y
1 22
2 22
3 28
4 31
5 34
6 37

x
(year)
y
(dollars)
1996 1.32
1997 1.33
1998 1.16
1999 1.36
2000 1.66
2001 1.64
2002 1.51
2003 1.83
2004 2.12
2005 2.17
2006 2.81
example
3
Net Change in the Dependent Variable
The table in the margin gives the annual average California gasoline price from 1996
to 2006, where x is the year and y is average price.
(a) Show that the variable y is a function of the variable x.
(b) Find the net change in the average California gasoline price from 1996 to 1998.
(c) Find the net change in the average California gasoline price from 1996 to 2006.
Solution
(a) The variable y is a function of the variable x because each value of x corre-
sponds to exactly one value of y.
(b) Since the average California gasoline price was $1.32 in 1996 and $1.16 in
1998, the net change from 1996 to 1998 is
The negative sign means that there was a net decrease in the price of gas from
1996 to 1998.
(c) Since the average California gasoline price was $1.32 in 1996 and $2.81 in
2006, the net change from 1996 to 2006 is
This means that there was a net increase in the price of gas from 1996 to 2006.
■ NOW TRY EXERCISE 15 ■
2.81 - 1.32 = 1.49
1.16 - 1.32 =-0.16
38 CHAPTER 1
■
Data, Functions, and Models
2
■ Which Equations Represent Functions?
An equation in two variables defines a relation between the two variables—namely,
the relation consisting of the ordered pairs that satisfy the equation. For example,
some of the ordered pairs (x, y) in the relation determined by the equation are
Does this equation define the variable y as a function of the variable x? Since each
value of the variable x corresponds to exactly one value of the variable y (namely, ),
the equation does define a function. In general, we have the following.
Equations That Represent Functions
x
2
11, 1 2, 12, 42, 12.5, 6.252, 13, 92, 1- 2, 42
y = x
2
An equation in x and y defines y as a function of x if each value of x (the
independent variable) corresponds via the equation to exactly one value of y
(the dependent variable).
Once we have determined that a variable y is a function of a variable x we can
find the change in y as x changes. We find the net change in the variable y between
the inputs a and b by subtracting the value of y at the input a from the value of y at
the input b (where ). Note that the net change is the change between two par-
ticular values of y; between these two values y could increase, then decrease, then in-
crease again. But subtracting the value of y at the input a from the value of y at the
input b gives the net change between these two points. The next example illustrates
this concept.
a … b
SECTION 1.4
■
Functions: Describing Change 39
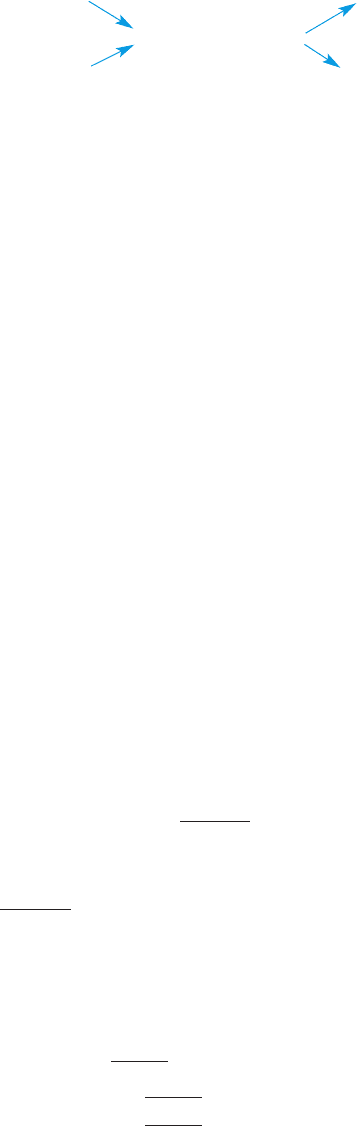
Notice that in the equation the variable x is not a function of the variable
y because certain values of y determine more than one value of x. For example,
determines and . The diagram below shows the difference.
22
44
y is a function of xxis not a function of y
In other words, if we view x as the independent variable and y as the dependent vari-
able, then the equation defines a function. On the other hand, if we choose to view y
as the independent variable and x as the dependent variable then the equation does
not define a function.
If an equation determines a function, we can write the equation in function
form—that is, with the dependent variable alone on one side of the equation. For ex-
ample, the following equation determines y as a function of x:
Equation
We express this equation in function form as
Equation in function form
In general, to determine whether an equation defines a function, we try to put the
equation in function form. The next example illustrates this procedure.
y = x
2
x
2
- y = 0
- 2- 2
x =-2x = 2
y = 4
y = x
2
example
4
Deciding Whether an Equation Defines a Function
Consider the equation .
(a) Does the equation define as a function of w?
(b) Does the equation define w as a function of ?
Solution
(a) To answer this question, we write the equation in function form with the
dependent variable alone on one side:
Equation
Subtract
Divide by 5
We see that is a function of w, because for each value of w we can use the equa-
tion to calculate exactly one corresponding value for .
(b) We try to write the equation in function form with the dependent variable w
alone on one side:
Equation
Subtract 5 , then divide by 2
Take the square root
w = ;
B
8 - 5z
2
z w
2
=
8 - 5z
2
5 z + 2w
2
= 8
zz =
8 - 2w
2
5
z
z =
8 - 2w
2
5
2w
2
5 z = 8 - 2w
2
5 z + 2w
2
= 8
z
z
z
5z + 2w
2
= 8
Solving for one variable in
terms of another is reviewed in
Algebra Toolkit C.1, page T47.

40 CHAPTER 1
■
Data, Functions, and Models
example
5
Deciding Whether an Equation Defines a Function
When the wind blows with speed √ km/h, a windmill generates P watts of power ac-
cording to the equation
(a) Show that P is a function of √.
(b) Find the net change in the power P as the wind speed √changes from 7 to 10 km/h.
(c) If possible, express √ as a function of P.
(d) Find the net change in the wind speed √ if the power generated changes from
1000 W to 10,000 W.
Solution
(a) P is a function of √ because for each value of √ the equation gives exactly one
corresponding value for P.
(b) When √ is 7, the power P is ; and when √ is 10, the power P
is . So the net change in the power is
(c) We need to rewrite the equation with √ alone on one side:
Equation
Divide by 15.6
Take the cube root, and switch sides
This equation does define √ as a function of P because each real number has ex-
actly one cube root.
(d) When P is 1000, the equation we got in part (c) gives
When P is 10,000, the equation we got in part (c) gives
So the net change in the speed of the wind when the power P changes from
1000 W to 10,000 W is
km/h
■ NOW TRY EXERCISE 57 ■
8.62 - 4.00 = 4.62
√ =
A
3
P
15.6
=
A
3
10,000
15.6
L 8.62
√ =
A
3
P
15.6
=
A
3
1000
15.6
L 4.00
√ =
A
3
P
15.6
P
15.6
= √
3
P = 15.6√
3
15,600 - 5350.8 = 10,249.2 W
15.6110 2
3
= 15,600
15.617 2
3
= 5350.8
P = 15.6√
3
We see from the last equation that w is not a function of . For example, if is
0, we get two corresponding values for w, namely,
■ NOW TRY EXERCISE 23 ■
w =
B
8 - 5102
2
= 2andw =-
B
8 - 5102
2
=-2
zz
SECTION 1.4
■
Functions: Describing Change 41
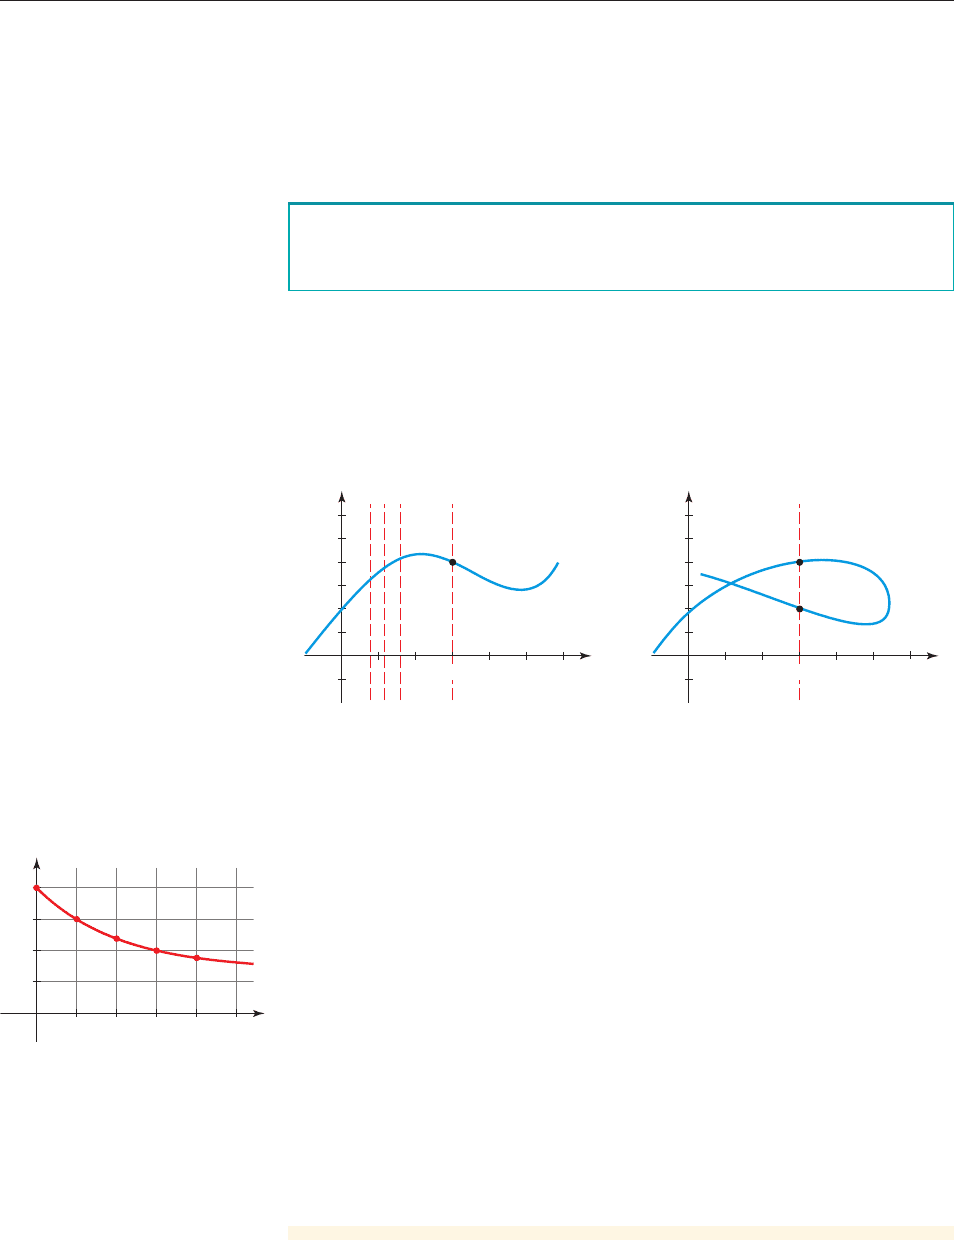
A graph is the graph of a function if and only if no vertical line intersects the
graph more than once.
So if any vertical line crosses the graph more than once, the graph is not the graph
of a function. This is illustrated in Figure 2.
The graph in Figure 2(a) is the graph of a function because we can see that each
input corresponds to exactly one output; for instance, the input 3 corresponds to the
output 4. But the graph in Figure 2(b) is not the graph of a function; for instance, the
input 3 corresponds to two different outputs: 2 and 4.
21
_1
1
2
4
3
6
5
4
(3, 4)
65
(
a
)
Gra
p
h of a function
0
x
y
3 21
_1
1
2
4
3
6
5
4
(3, 4)
65
(
b
)
Not a
g
ra
p
h of a function
0
x
y
3
(3, 2)
figure 2 Vertical Line Test
example
6
Cooling Coffee
A cup of coffee has a temperature of 200°F and is placed in a room that has a tem-
perature of 70°F. The graph in Figure 3 shows the temperature T of the coffee after
t minutes.
(a) Use the Vertical Line Test to show that T is a function of t.
(b) Find the net change in temperature during the first 10 minutes the coffee is
cooling.
Solution
(a) We see that every vertical line intersects the graph exactly once, so the graph
defines T as a function of t.
(b) From the graph we see that the temperature is 200°F at time 0 and 150°F
10 minutes later, so the net change in the temperature is .
The negative sign indicates that there was a net decrease in the temperature in
the first 10 minutes.
■ NOW TRY EXERCISE 29 ■
150 - 200 =-50
200
150
100
50
2010 40 5030
0
t
T
figure 3 Cooling coffee
2
■ Which Graphs Represent Functions?
For a relation to be a function, each input must correspond to exactly one output.
What does this mean in terms of the graph? It means that every vertical line intersects
the graph in at most one point. Of course, we are using the convention that the inputs
are graphed on the horizontal axis and the outputs are graphed on the vertical axis.
Vertical Line Test
10
5
23_3 _2 _1 1
0
x
y
2
46810
_2
2
0
x
y
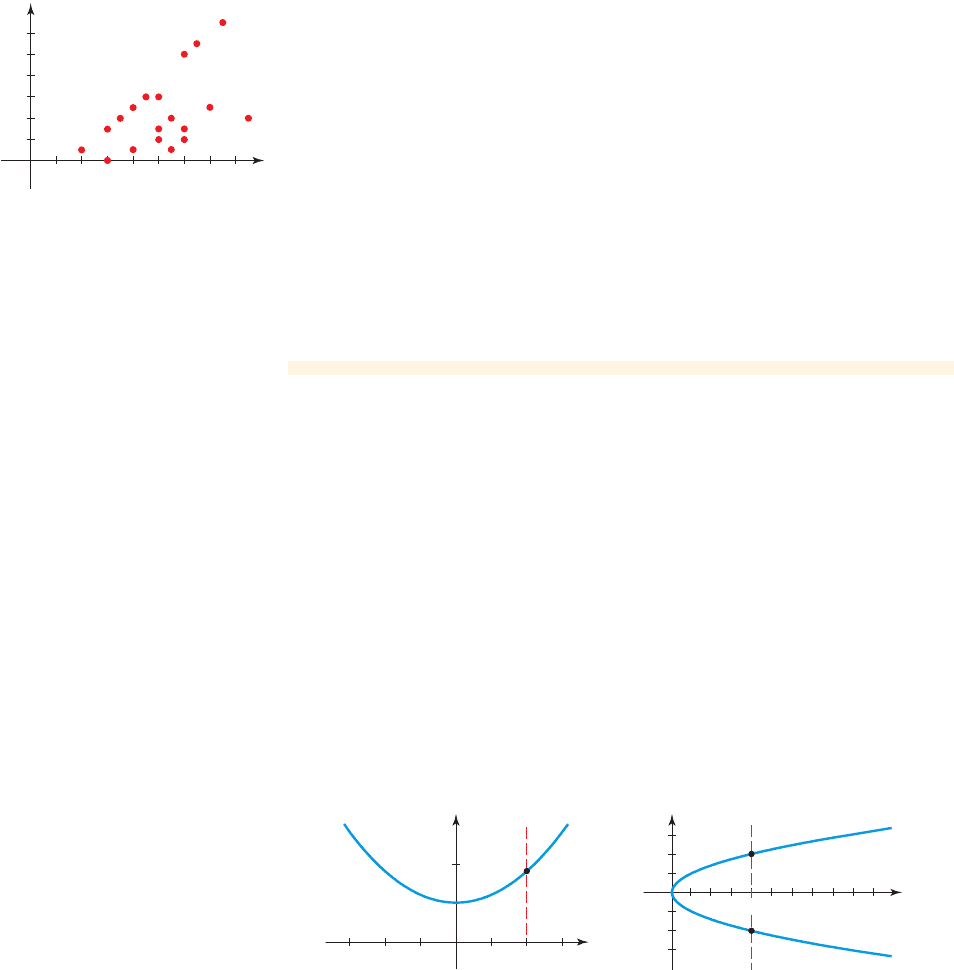
Solution
(a) We see from the figure that every vertical line intersects the graph exactly once,
so the equation defines y as a function of x.
(b) The vertical line shown in the figure intersects the graph at two different
points, so the equation does not define y as a function of x. The
input 4 corresponds to two different outputs. To find these outputs, we use
y
2
= x
y = x
2
+ 5
42 CHAPTER 1
■
Data, Functions, and Models
example
7
Voter Survey
A local campaign in the Midwest surveyed voters on their frequency of voting. The
graph in Figure 4 shows some of the survey data. Displayed is the age x of the voter
surveyed and the number y of elections in which they have participated.
(a) Use the graph to find the outputs that correspond to the input 40.
(b) List the ordered pairs on the graph with input 40.
(c) Use the Vertical Line Test to show that the graph does not determine y as a
function of x.
Solution
(a) From the graph we see that the input 40 corresponds to the outputs 1 and 5.
(b) The ordered pairs are (40, 1) and (40, 5).
(c) A vertical line at intersects the graph at more than one point, so the
graph is not the graph of a function.
■ NOW TRY EXERCISE 63 ■
Notice that if a relation is not a function, it doesn’t make sense to talk about net
change. In Example 6 the age of a voter does not determine how many elections the
person voted in, so a change in age does not determine a change in voting.
Another way to determine whether an equation defines a function is to graph the
equation and then use the Vertical Line Test. For example, the graph of the equation
is a circle (see
Algebra Toolkit D.2
). You can easily check that a cir-
cle does not statisfy the Vertical Line Test, so this equation does not define a func-
tion. Here are some other examples.
x
2
+ y
2
= 25
x = 40
12
10
8
6
4
2
40302010 6050 8070
0
x
y
figure 4 Voter survey
example
8
Using the Vertical Line Test
An equation and its graph are given. Use the Vertical Line Test to decide whether the
equation defines y as a function of x. If the equation does not define a function, use
the graph to help find an input that corresponds to more than one output.
(a) (b) y
2
= xy = x
2
+ 5
SECTION 1.4
■
Functions: Describing Change 43
2
■ Four Ways to Represent a Function
In Section 1.3 we represented relations in four different ways. Since functions are re-
lations, they also can be represented in these ways.
■
Verbally using words
■
Numerically by a table of two-variable data
■
Symbolically by an equation
■
Graphically by a graph in a coordinate plane
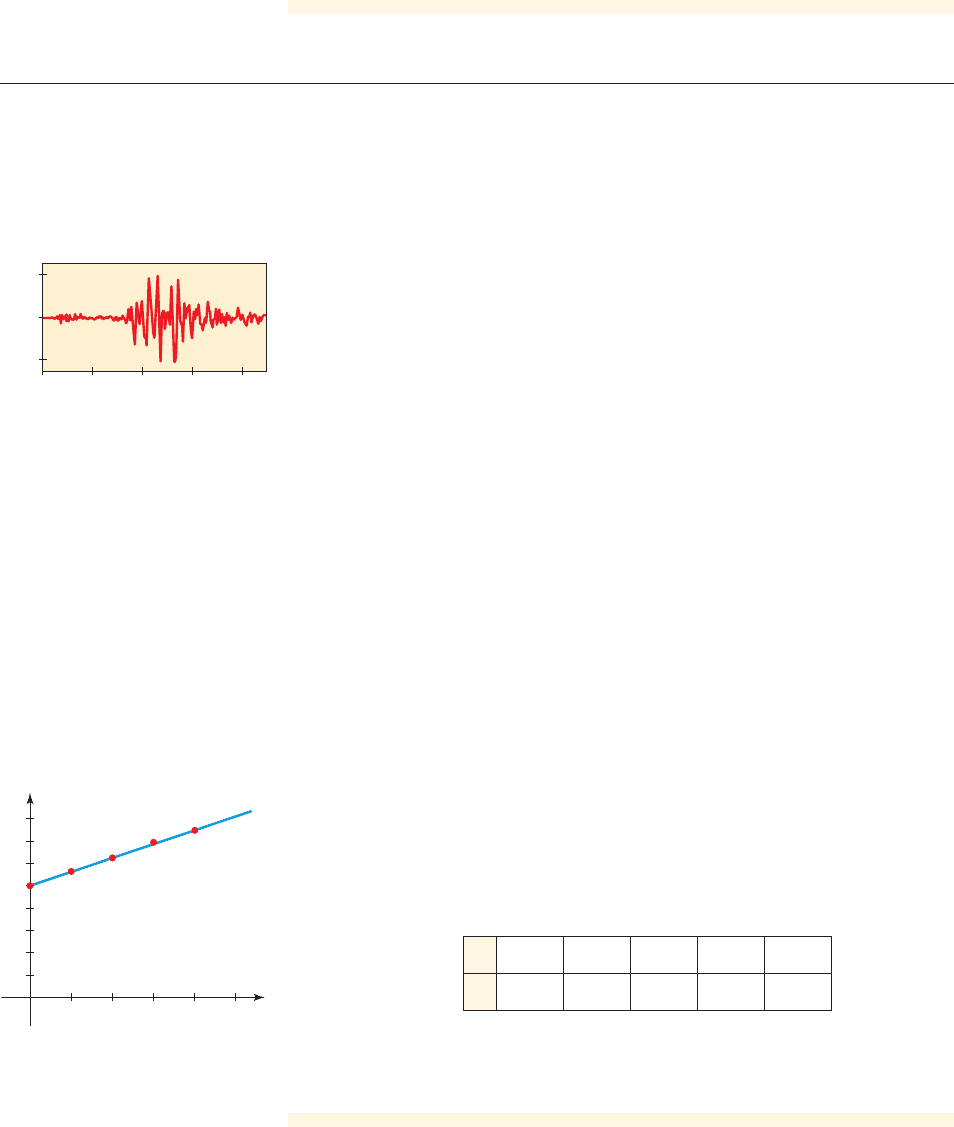
Any function can be represented in all four ways, but some are better represented in
one way rather than another. For example, a seismograph reading is a graph of the
intensity of an earthquake as a function of time (see the figure in the margin). It
would be difficult to find an equation that describes this function. We now give an
example of a function that can be represented in all four ways.
_0.1
0
0.0
0.1
5 10
Seismograph of Loma Prieta
earth
q
uake
,
1989
15 20
example
9
Representing a Function in Four Ways
A pizza parlor charges $10 for a plain cheese pizza and $1.25 for each additional top-
ping. The cost of a pizza is a function of the number of toppings. Express this func-
tion verbally, symbolically, numerically, and graphically.
Solution
■
Verbally We can express this function verbally by saying “the cost of a
pizza is $10 plus $1.25 for each additional topping.”
■
Symbolically If we let y be the cost of a pizza and x be the number of
toppings, then we can express the function symbolically by
Here the independent variable is x, the number of toppings, and the dependent
variable is y, the cost of the pizza.
■
Numerically We make a table of values that gives a numerical representa-
tion of the function.
y = 10 + 1.25x
8
10
12
14
16
4
2
6
21435
0
x
y
figure 5
Graph of y = 10 + 1.25x
x 0 1 2 3 4
y 10.00 11.25 12.50 13.75 15.00
■
Graphically We plot the data in the table to get the graphical representa-
tion shown in Figure 5.
■ NOW TRY EXERCISE 55 ■
the equation. If x is 4, then the equation tells us that , and so y is 2
or .
■ NOW TRY EXERCISE 33 ■
- 2
y
2
= 4