Stewart J. College Algebra: Concepts and Contexts
Подождите немного. Документ загружается.

2
1.6 Working with Functions: Graphs and Graphing Calculators
■
Graphing a Function from a Verbal Description
■
Graphs of Basic Functions
■
Graphing with a Graphing Calculator
■
Graphing Piecewise Defined Functions
IN THIS SECTION… we continue studying properties of functions by analyzing their
graphs. We use graphing calculators as a convenient way of obtaining graphs quickly.
GET READY… by learning how your own graphing calculator works. Review the material
on graphing calculators in Algebra Toolkit D.3. Test your graphing calculator skills by
doing the Algebra Checkpoint at the end of this section.
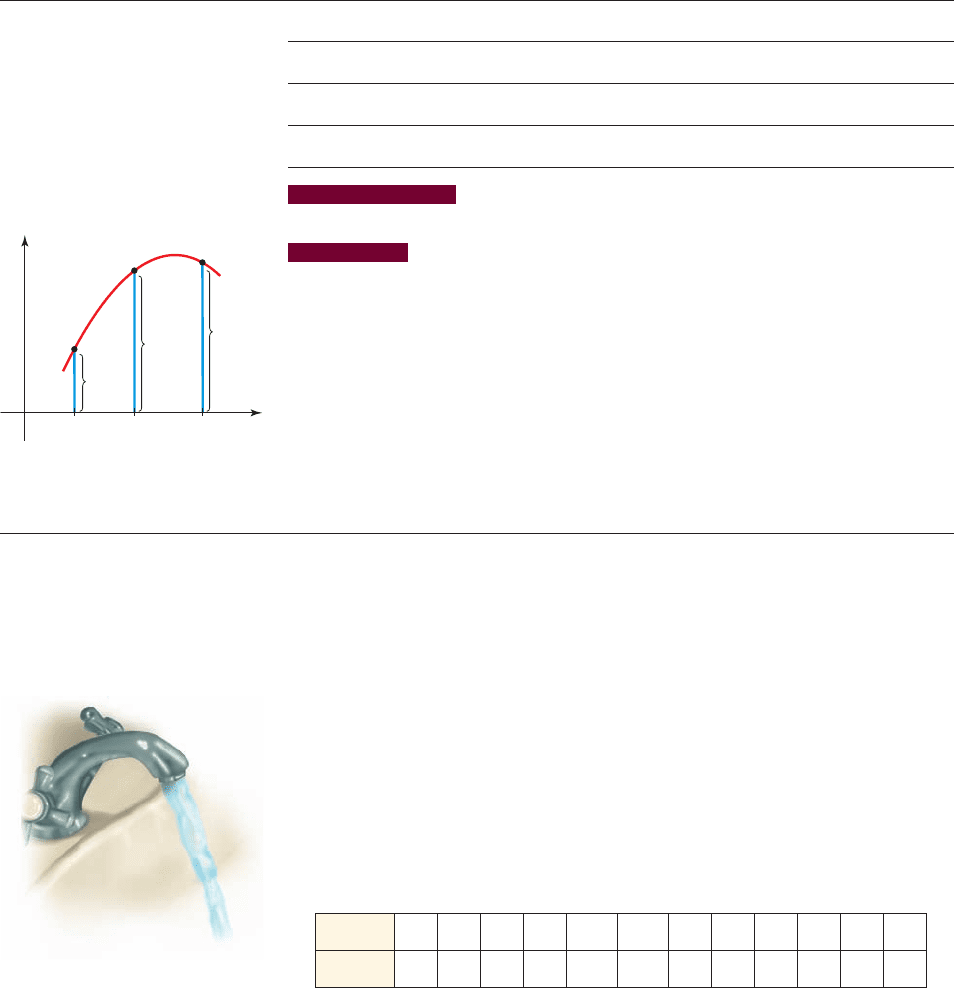
We graph functions in the same way we graphed relations in Section 1.2: by plotting
the ordered pairs in the relation. So the graph of a function f is the set of all ordered
pairs where , plotted in a coordinate plane. This means the value
is the height of the graph above the point x, as shown in Figure 1.
We can sketch the graph of a function from a verbal, numerical, or algebraic de-
scription of the function. In this section we examine graphs of some basic functions. In
subsequent sections we use these basic functions to model real-world phenomena.
f 1x2y = f 1x21x, y2
2
f(1)
f(2)
f(x)
(x, f(x))
x1
0
x
y
figure 1 The height of the graph
above x is the value of f 1x2
2
■ Graphing a Function from a Verbal Description
Even when a precise rule or formula describing a function is not available, we can
still describe the function by a graph. Consider the following example.
64 CHAPTER 1
■
Data, Functions, and Models
example
1
Graphing a Function from Verbal and Numerical Descriptions
When you turn on a hot water faucet, the temperature of the water depends on how
long the water has been running. Let T be the function defined by
“Temperature of the water from the faucet at time x”
where x is measured in minutes.
(a) Draw a rough graph of the function T.
(b) To get a more accurate graph, the following data were gathered from a
particular faucet. Draw a graph of the function T based on these data.
T 1x2=
x (min) 0 1 2 5 10 15 20 25 30 35 40 50
T (°F) 68 85 90 98 100 100 97 86 70 60 55 55
Solution
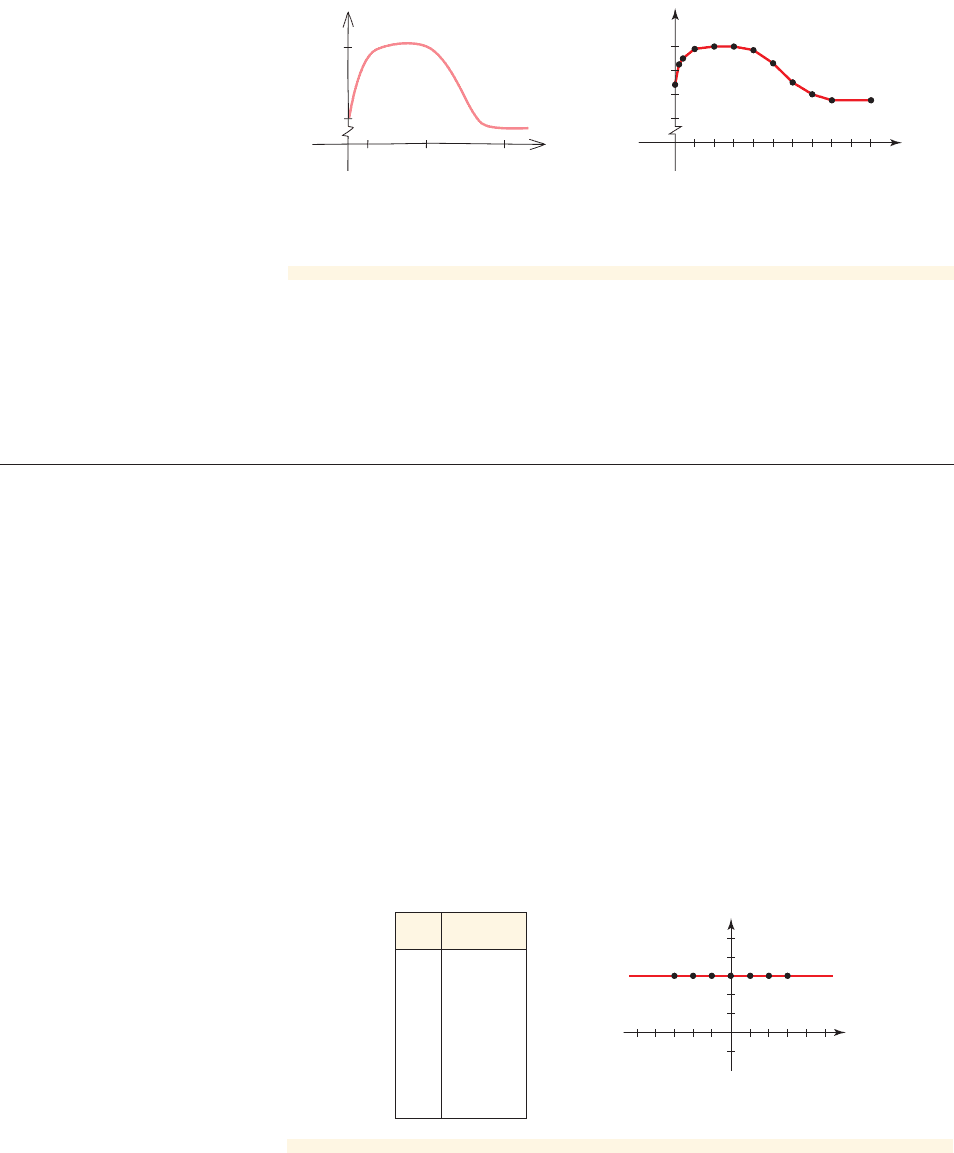
(a) When the faucet is turned on, the initial temperature of the water is close to
room temperature. When the water from the hot water tank reaches the faucet,
the water’s temperature T increases quickly. In the next phase, T is constant at
the temperature of the water in the tank. When the tank is drained, T decreases
to the temperature of the cold water supply. Figure 2(a) shows a rough graph
of the temperature T of the water as a function of the time t that has elapsed
since the faucet was turned on.
SECTION 1.6
■
Working with Functions: Graphs and Graphing Calculators 65
(b) We make a scatter plot of the data and connect the points with a smooth curve as in
Figure 2(b). Notice that the height of the graph is the value of the function; in other
words, the height of the graph is the temperature of the water at the given time.
2
■ Graphs of Basic Functions
When the rule of a function is given by an equation, then to graph the function, we
first make a table of values. We then plot the points in the table and connect them by
a smooth curve. Let’s try graphing some basic functions.
In the next example we graph a constant function, that is, a function of the form
where c is a fixed constant number. Notice that a constant function has the same out-
put c for every value of the input.
f 1x 2= c
520
(a) Rough graph (b) Graph from data
40
T (ºF)
70
100
x (min)
40
60
80
100
10 20 30 5040
0
x (min)
T (F)
figure 2 Graph of water temperature as a function of time
■ NOW TRY EXERCISE 49 ■
It would be nice to have a precise rule (function) that gives the temperature of
the water at any time. Having such a rule would allow us to predict the temperature
of the water at any time and perhaps warn us about getting scalded. We don’t have
such a rule for this situation, but as we study more functions with different graphs,
we may be able to find a function that models this situation.
example
2
Graph of a Constant Function
Graph the function .
Solution
We first make a table of values. Then we plot the points in the table and join them by
a line as in Figure 3. Notice that the graph is a horizontal line 3 units above the x-axis.
f 1x 2= 3
figure
3 Graph of f 1x2= 3
x
f(x) ⴝ 3
- 3
3
- 2
3
- 1
3
0 3
1 3
2 3
3 3
0
x
y
2
2
■ NOW TRY EXERCISE 7 ■
66 CHAPTER 1
■
Data, Functions, and Models
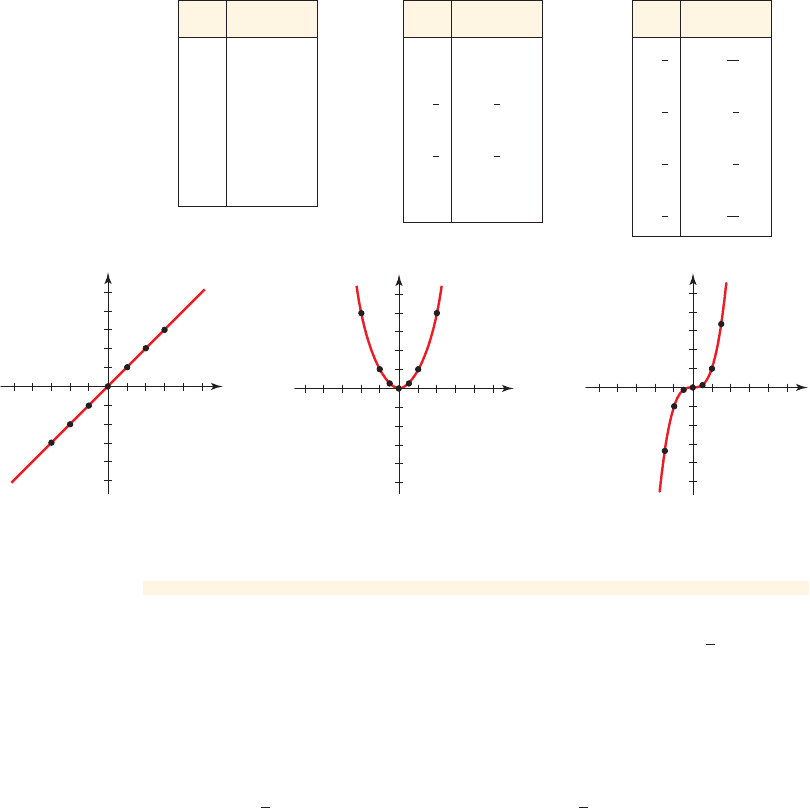
example
3
Graphs of Basic Functions
Graph the function.
(a) (b) (c)
Solution
We first make a table of values. Then we plot the points in the table and join them by
a line or smooth curve as in Figures 4, 5, and 6.
(a) (b) (c) f 1x 2= x
3
f 1x 2= x
2
f 1x 2= x
f 1x 2= x
3
f 1x 2= x
2
f 1x 2= x
x
f 1x2ⴝ x
- 3 - 3
- 2 - 2
- 1 - 1
0 0
1 1
2 2
3 3
x
f 1x2ⴝ x
2
- 2
4
- 1
1
-
1
2
1
4
0 0
1
2
1
4
1 1
2 4
x
f 1x2ⴝ x
3
-
3
2
-
27
8
- 1 - 1
-
1
2
-
1
8
0 0
1
2
1
8
1 1
3
2
27
8
0
x
y
2
2
figure 4
0
x
y
2
2
figure 5
x
y
0
2
2
figure 6
In the next example we graph the function . For each input, this func-
tion gives the same number as output. This function is called the identity function
(the output is identical to the input). We also graph , whose graph has the
shape of a parabola.
f 1x 2= x
2
f 1x2= x
Another basic function is the square root function , which we
graph in the next example.
f 1x 2= 1x
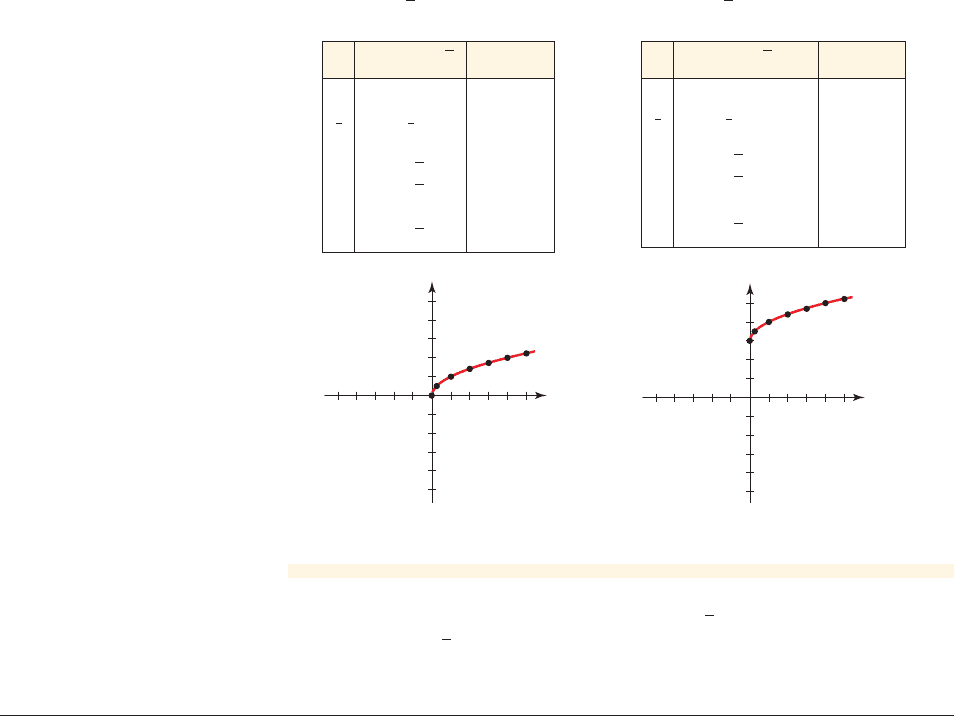
example
4
Graph of the Square Root Function
Graph the function.
(a) (b) g1x 2= 1x
+ 3f 1x 2= 1x
■ NOW TRY EXERCISES 15, 19, AND 23 ■
SECTION 1.6
■
Working with Functions: Graphs and Graphing Calculators 67
Solution
We first make a table of values. Since the domain of f is , we use only non-
negative values for x. Then we plot the points in the table and join them by a line or
smooth curve as in Figures 7 and 8.
(a) (b) g1x 2= 1x + 3f 1x2= 1x
5x 冨 x Ú 06
x
y
0
2
2
figure 7
x
f 1x 2ⴝ 1x
Decimal
0 0 0
1
4
1
2
0.5
1 1 1.0
2
12
1.4
3
13
1.7
4 2 2.0
5
15
2.2
■ NOW TRY EXERCISE 33 ■
In Example 4 notice how the graph of has the same shape as the
graph of but is shifted up 3 units. We will study shifting of graphs more
systematically in Chapter 4.
f 1x 2= 1x
g1x 2= 1x + 3
x
g1x 2ⴝ 1x ⴙ 3
Decimal
0
0 + 3
3.0
1
4
1
2
+ 3
3.5
1
1 + 3
4.0
2
12 + 3
4.4
3
13 + 3
4.7
4
2 + 3
5.0
5
15 + 3
5.2
x
y
0
2
2
figure 8
2
■ Graphing with a Graphing Calculator
A graphing calculator graphs a function in the same way you do: by making a table of
values and plotting points. Of course, the calculator is fast and accurate; it also frees us
from the many tedious calculations needed to get a good picture of the graph. But the
graph that is produced by a graphing calculator can be misleading. A graphing calcula-
tor must be used with care, and the graphs it produces must be interpreted appropriately.
Algebra Toolkit D.3, page T80,
gives guidelines on using a
graphing calculator as well as
advice on avoiding some
common graphing calculator
pitfalls.
example
5
Graphing a Function
Graph the function in an appropriate viewing rectangle.
Solution
To graph the function , we first express it in equation form
y = x
3
- 49x
f 1x 2= x
3
- 49x
f 1x 2= x
3
- 49x
68 CHAPTER 1
■
Data, Functions, and Models
100
_100
(
a
)
_10 10
200
_200
(
b
)
_10 10
figure 9 Graphing f 1x 2= x
3
- 49x
■ NOW TRY EXERCISE 35 ■
We now graph the equation using a graphing calculator. We experiment with differ-
ent viewing rectangles. The viewing rectangle in Figure 9(a) gives an incomplete
graph—we need to see more of the graph in the vertical direction. So we choose the
larger viewing rectangle by by choosing
The graph in this larger viewing rectangle is shown in Figure 9(b). This graph ap-
pears to show all the main features of this function. (We will confirm this when we
study polynomial functions in Chapter 5.)
Xmax = 10
Ymax = 200
Xmin =-10 Ymin =-200
3- 200, 20043- 10, 104
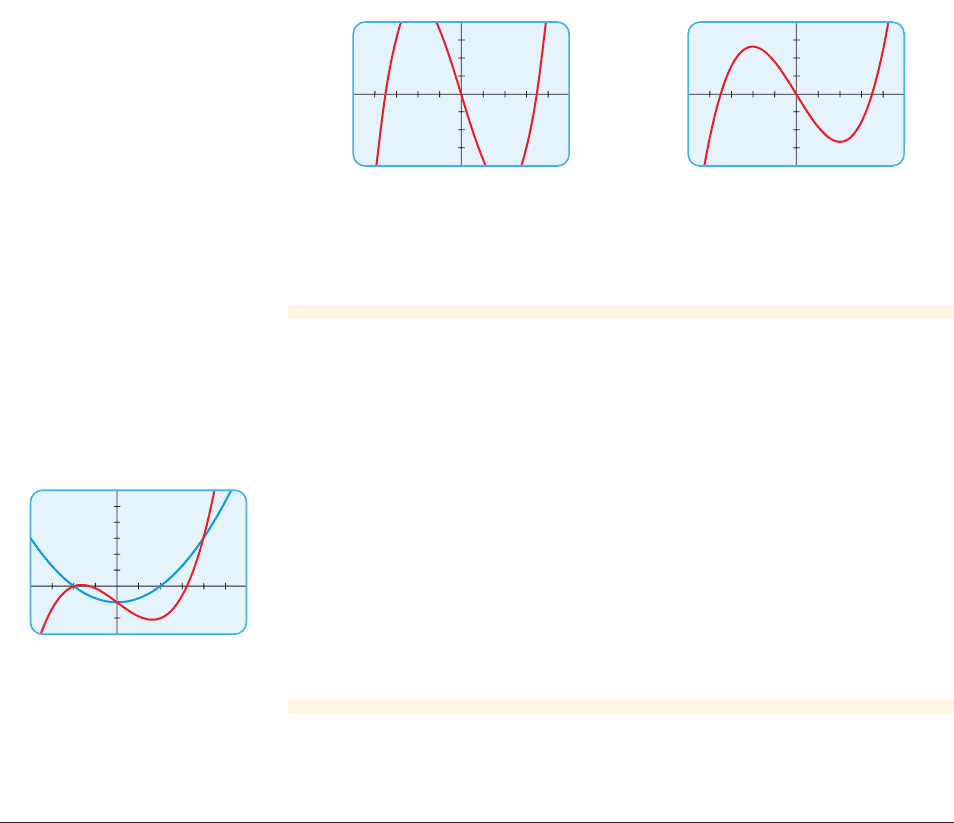
example
6
Where Graphs Meet
Consider the functions and
(a) Graph the functions f and in the viewing rectangle by .
(b) Find the points where the graphs intersect in this viewing rectangle.
Solution
The graphs are shown in Figure 10. The graphs appear to meet at three different
points. Zooming in on each point, we find that the points of intersections are
You can check that each of these points satisfies both equations.
■ NOW TRY EXERCISE 41 ■
1- 1, 0210, - 1212, 32
3- 3, 643- 2, 34g
g1x 2= x
3
- 2x - 1.f 1x 2= x
2
- 1
6
_3
_2
3
figure 10 Finding where
graphs meet
2
■ Graphing Piecewise Defined Functions
Recall that a piecewise defined function is a function that is defined by different rules
on different parts of its domain. As you might expect, the graph of such a function
consists of separate “pieces,” as the following example shows.
SECTION 1.6
■
Working with Functions: Graphs and Graphing Calculators 69
example
7
Graphing a Piecewise Defined Function
Graph the function
Solution
The rule f is given by for and for . We use this
information to make a table of values and plot the graph in Figure 11.
x 7 2f 1x2= x + 1x … 2f 1x2= x
f 1x 2= e
x if x … 2
x + 1 if x 7 2
On many graphing calculators the
graph in Figure 11 can be produced
by using the logical functions in the
calculator. For example, on the
TI-83 the following equation gives
the required graph:
Y
1
=(X
◊
2)*X+(X>2)*(X+1)
(To avoid the extraneous vertical
line between the two parts of the
graph, put the calculator in
Dot
mode.)
4
6
2
_2
2
x 22 x
_1_2 1 435
0
x
y
figure 11 Graph of the piecewise defined
function f
x
f 1x 2
- 2 - 2
- 1 - 1
0 0
1 1
2 2
3 4
4 5
5 6
Notice the closed and open circles on the graph in Figure 11. The closed circle at the
point (2, 2) indicates that this point is on the graph. The open circle above it at (2, 3)
indicates that this point is not on the graph.
■ NOW TRY EXERCISE 45 ■
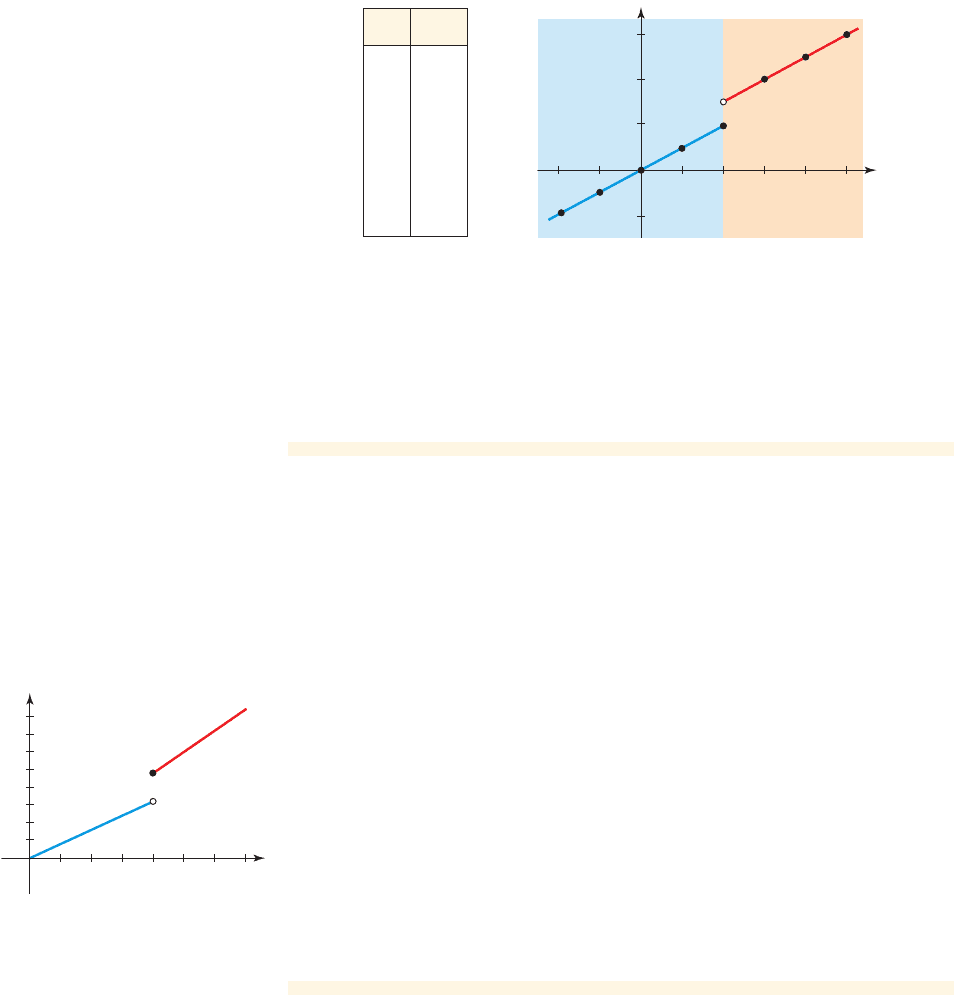
example
8
Water Rates
A city charges its residents $0.008 per gallon for households that use less than 4000
gallons a month and $0.012 for households that use 4000 gallons or more a month
(see Example 9 in Section 1.5). The function
gives the cost of using x gallons of water per month.
(a) Graph the piecewise defined function C.
(b) What does the break in the graph represent?
Solution
(a) We graph the function C in two pieces. For we graph the equation
, and for we graph the equation . The graph is
shown in Figure 12.
(b) From the graph we see that at 4000 gallons there is a jump in the cost of water.
This corresponds to the jump in the price from $0.008 to $0.012 per gallon.
■ NOW TRY EXERCISE 55 ■
y = 0.012xx Ú 4000y = 0.008x
x 6 4000
C 1x2= e
0.008x if x 6 4000
0.012x if x Ú 4000
0
40
60
80
20
2000 4000 6000
x
y
figure 12 Graph of the cost
function C
2.
(i)
(ii) [0, 10] by
(iii) by
(iv) by
4.
(i) by
(ii) by
(iii) by
(iv) by
3- 2, 643- 2, 104
3- 10, 4043- 10, 104
30, 10043- 5, 5 4
3- 4, 443- 4, 44
y = 28x - x
2
3- 100, 2043- 10, 34
3- 20, 10043- 15, 84
3- 20, 1004
3- 5, 54 by 3- 5, 54
y = x
2
+ 7x + 6
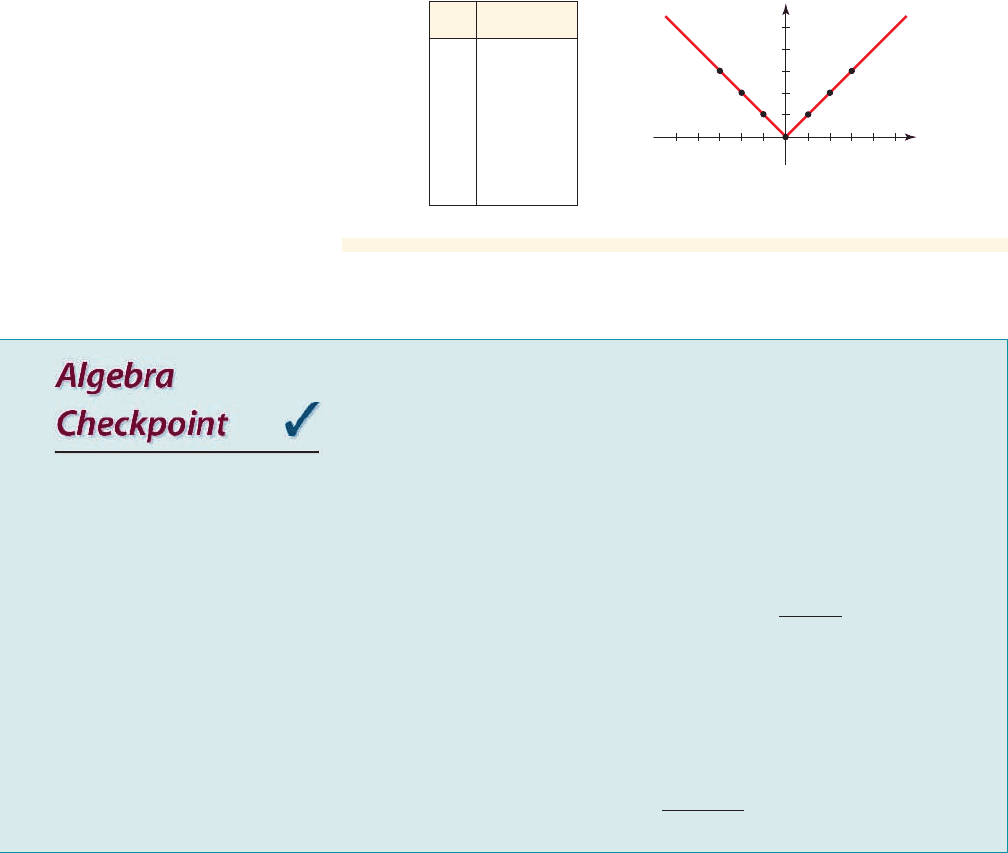
The absolute value function is a piecewise defined function:
This function leaves positive inputs unchanged and reverses the sign of negative
inputs.
f 1x 2= e
- x if x … 0
x if x 7 0
f 1x 2= 0 x 0
example
9
Graph of the Absolute Value Function
Sketch the graph of .
Solution
We make a table of values and then sketch the graph in Figure 13.
f 1x 2= 0
x 0
0
x
y
2
2
figure 13 Graph of f 1x 2= 0 x 0
x
f 1x 2ⴝ 0 x 0
- 3
3
- 2
2
- 1
1
0 0
1 1
2 2
3 3
■ NOW TRY EXERCISE 31 ■
70 CHAPTER 1
■
Data, Functions, and Models
To graph on the TI-83,
enter the function as
Y
1
= abs(X).
f 1x 2= 0 x 0
Test your skill in using your graphing calculator. Review the guidelines on graph-
ing calculators in
Algebra Toolkit D.3
on page T80.
1–4 Use a graphing calculator or computer to decide which viewing rectangle
(i)–(iv) produces the most appropriate graph of the equation.
1.
(i) by +
(ii) [0, 4] by [0, 4]
(iii) by
(iv) by
3.
(i) by
(ii) by
(iii) by
(iv) by
5. Graph the equation in an appropriate viewing rectangle.
(a) (b)
(c) (d)
y = 24 + x - x
2
y = x
4
- 5x
2
y = x
3
- 2x - 3y = 50x
2
3- 200, 20043- 100, 1004
3- 100, 10043- 20, 204
3- 10, 1043- 10, 104
3- 4, 443- 4, 44
y = 10 + 25x - x
3
3- 80, 80043- 40, 404
3- 4, 4043- 8, 84
3- 2, 243- 2, 24
y = x
4
+ 2
SECTION 1.6
■
Working with Functions: Graphs and Graphing Calculators 71
1.6 Exercises
II
0
x
x x x
0
0
y
y y y
1
1111
I
IV
0
III
CONCEPTS
Fundamentals
1. To graph the function f, we plot the points (x, _______ ) in a coordinate plane. To
graph , we plot the points (x,
_______ ). So the point (2, _______ ) is
on the graph of f. The height of the graph of f above the x-axis when is
_______.
2. If , then the point (2,
_______ ) is on the graph of f.
3. If the point (1, 5) is on the graph of f, then
_______.
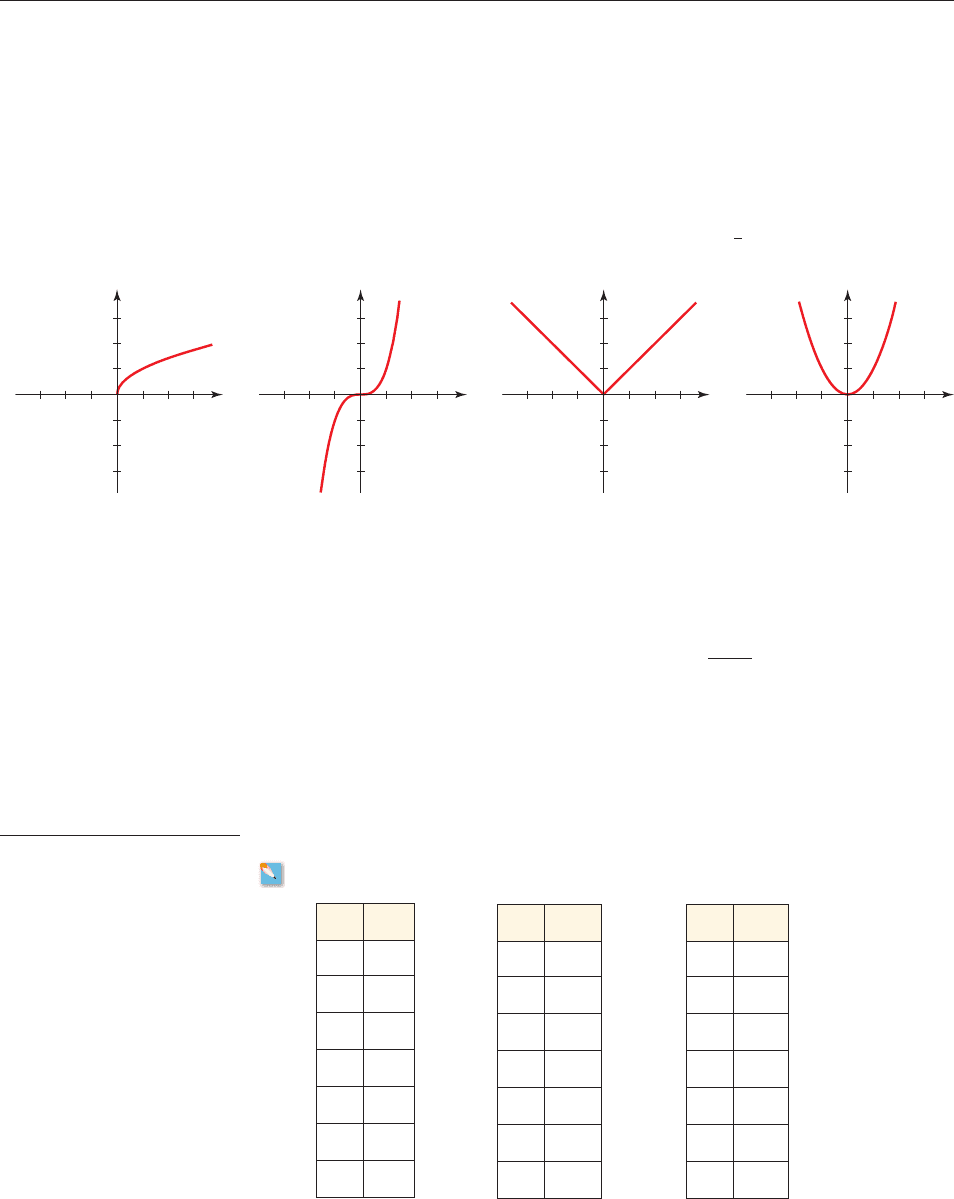
4. Match the function with its graph.
(a) (b) (c) (d) f 1x2= 0
x 0f 1x 2= 1xf 1x 2= x
3
f 1x 2= x
2
f 112=
f 122= 3
x = 2
f 1x 2= x
3
+ 2
Think About It
5. In what ways can a graph produced by a graphing calculator be misleading? Explain
using an example.
6. A student wishes to graph the following functions on the same screen:
and
He enters the following information into the calculator:
The calculator graphs two lines instead of the information he wanted. What went
wrong?
7–12
■ A function is given. Complete the table and then graph the function.
7. 8. 9. h 1x 2= 2x
2
- 3g1x 2= 2x - 4f 1x 2= 5
Y
1
X^1>3andY
2
X>X4
y =
x
x + 4
y = x
1>3
SKILLS
x f(x)
- 3
- 2
- 1
0
1
2
3
x
g(x)
- 3
- 2
- 1
0
1
2
3
x h(x)
- 3
- 2
- 1
0
1
2
3
72 CHAPTER 1
■
Data, Functions, and Models
x k(x)
- 3
- 2
- 1
0
1
2
3
10. 11. 12.
13–28
■ Sketch the graph of the function by first making a table of values.
13. 14.
15. 16.
17. 18.
19. 20.
21. 22.
23. 24.
25. 26.
27. 28.
29–34
■ Graph the given functions on the same coordinate axes.
29.
30.
31.
32.
33.
34.
35–40
■ Draw a graph of the function in an appropriate viewing rectangle.
35. 36.
37. 38.
39. 40.
41–42
■ Do the graphs of the two functions intersect in the given viewing rectangle? If
they do, how many points of intersection are there?
41. by
42. by
43–48
■ Sketch the graph of the piecewise defined function.
43. 44. f 1x 2= e
1 if x … 1
x + 1 if x 7 1
f 1x 2= e
0 if x 6 2
1 if x Ú 2
3- 5, 204f 1x 2= 6 - 4x - x
2
,g1x 2= 3x + 18;3-6, 24
3- 1, 34f 1x 2= 3x
2
+ 6x -
1
2
,g1x 2= 27 -
7
12
x
2
;3- 4, 44
f 1x 2= 2x - 0x
2
- 5 0f 1x 2= `
x
2
+ 7 `
f 1x 2= 0.1x
3
- x
2
+ 1f 1x 2= x
4
- 4x
3
f 1x 2= 212x - 17f 1x 2= 4 + 6x - x
2
f 1x 2= 1x,g1x2= 1x - 9,h 1x 2= 1x - 1 + 2
f 1x 2= 1x
,g1x 2= 14x,h 1x 2= 1x - 4
f 1x 2= 0
x 0,g1x2= 03x 0,h 1x2= 0x 0+ 4
f 1x 2= 0
x 0,g1x2= 2 0 x 0,h 1x2= 0 x + 2 0
f 1x 2= x
2
,g1x 2= 1x + 52
2
,h 1x 2= 1x - 52
2
f 1x 2= x
2
,g1x 2= x
2
- 3,h1x2=
1
4
x
2
r 1x 2= 0x + 1 0r 1x 2= 02x 0
A 1x 2= 1x + 4
A 1x 2= 1x + 1
G 1x 2= 1x + 22
3
G 1x 2= x
3
- 8
F 1x 2= 1x - 32
2
F 1x 2= x
2
- 4
k 1x 2= 4 - x
2
k 1x 2=-x
2
h 1x 2= 3 - x,- 2 … x … 2h 1x 2=-x + 3,- 3 … x … 3
g1x 2= 3x - 7g1x 2= x - 4
f 1x 2=-1f 1x 2= 8
G 1x 2= 2 0 x + 1 0F 1x 2= 1x + 4k 1x 2= x
3
+ 8
x F(x)
- 4
- 2
0
2
4
8
x G(x)
- 4
- 3
- 2
- 1
0
1
SECTION 1.6
■
Working with Functions: Graphs and Graphing Calculators 73
CONTEXTS
r T(r)
5
6
7
8
9
10
45. 46.
47. 48.
49. Filling a Bathtub A bathtub is being filled by a constant stream of water from the
faucet. Sketch a rough graph of the water level in the tub as a function of time.
50. Cooling Pie You place a frozen pie in an oven and bake it for an hour. Then you take
the pie out and let it cool before eating it. Sketch a rough graph of the temperature of
the pie as a function of time.
51. Christmas Card Sales The number of Christmas cards sold by a greeting card store
depends on the time of year. Sketch a rough graph of the number of Christmas cards
sold as a function of the time of year.
52. Height of Grass A home owner mows the lawn every Wednesday afternoon. Sketch a
rough graph of the height of the grass as a function of time over the course of a four-
week period beginning on a Sunday.
53. Weather Balloon As a weather balloon is inflated, the thickness T of its latex skin is
related to the radius of the balloon by
where T and r are measured in centimeters. Complete the table in the margin and graph
the function T for values of r between 5 and 10.
54. Gravity near the Moon The gravitational force between the moon and an astronaut in
a space ship located a distance x above the center of the moon is given by the function
where F is measured in newtons (N) and x is measured in megameters (Mm). Graph the
function F for values of x between 2 and 8.
55. Toll Road Rates The toll charged for driving on a certain stretch of a toll road
depends on the time of day. The amount of the toll charge is given by
where x is the number of hours since 12:00
A.M.
(a) Graph the function T.
(b) What do the breaks in the graph represent?
56. Postage Rates The domestic postage rate depends on the weight of the letter. In 2009,
the domestic postage rate for first-class letters weighing 3.5 oz or less was given by
where x is the weight of the letter measured in ounces.
(a) Graph the function P.
(b) What do the breaks in the graph represent?
P1x 2= d
0.44 if 0 … x … 1
0.61 if 1 6 x … 2
0.78 if 2 6 x … 3
0.95 if 3 6 x … 3.5
T 1x2= e
5.00 if 0 … x 6 7
7.00 if 7 … x … 10
5.00 if 10 6 x 6 16
7.00 if 16 … x … 19
5.00 if 19 6 x 6 24
F 1x2=
350
x
2
T 1r2=
0.5
r
2
f 1x 2= e
2 if x …-1
x
2
if x 7-1
f 1x 2= e
1 - x
2
if x … 2
x if x 7 2
f 1x 2= e
2x + 3 if x 6-1
3 - x if x Ú-1
f 1x 2= e
1 - x if x 6-2
5 if x Ú-2