Stewart J. College Algebra: Concepts and Contexts
Подождите немного. Документ загружается.

1.7 Working with Functions:
Getting Information from the Graph
■
Reading the Graph of a Function
■
Domain and Range from a Graph
■
Increasing and Decreasing Functions
■
Local Maximum and Minimum Values
IN THIS SECTION... we use the graph of a function to get information about the
function, including where the values of the function increase or decrease and where the
maximum or minimum value(s) of the function occur.
GET READY... by reviewing interval notation in Algebra Toolkit A.2. Test your skill in
working with interval notation by doing the Algebra Checkpoint at the end of this
section.
The graph of a function allows us to “see” the behavior, or life history, of the func-
tion. For example, we can see from the graph of a function the highest or lowest value
of the function or whether the values of the function are rising or falling. So if a func-
tion represents cost, the lowest point on its graph tells where the minimum cost oc-
curs. If a function represents profit, its graph can tell us where profit is increasing or
decreasing. In this section we examine how to obtain these and other types of infor-
mation from the graph of a function.
2
■ Reading the Graph of a Function
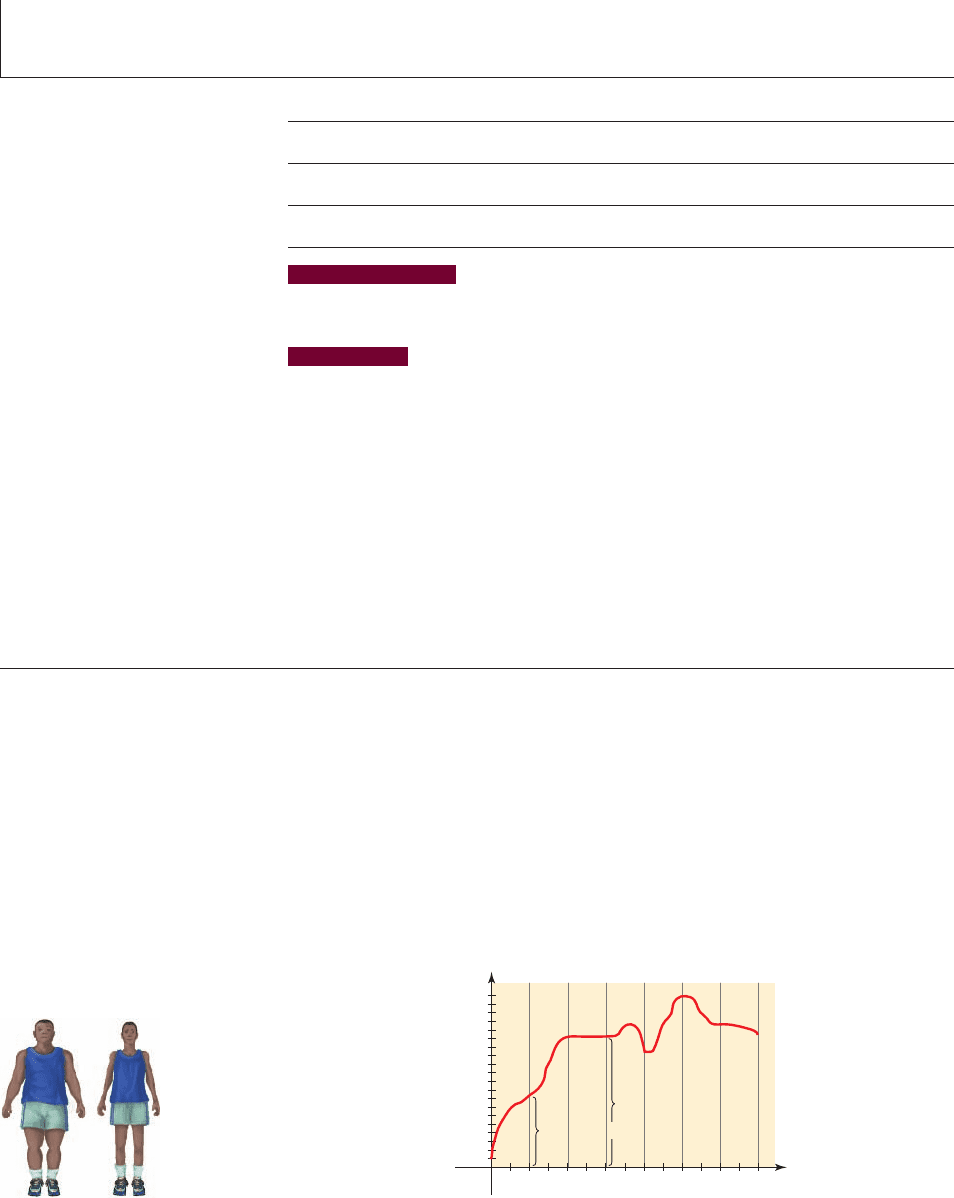
If a function models a real-world situation, such as the weight of a person, its graph
is usually easy to interpret. For example, suppose the weight of Mr. Hector (in
pounds) is given by the function W, where the independent variable x is his age in
years. So
“weight of Mr. Hector at age x”
The graph of the function W in Figure 1 gives a visual representation of how his
weight has changed over time. Note that Mr. Hector’s weight at age x is the
height of the graph above the point x.
W 1x2
W 1x2=
200
20
40
60
80
100
120
140
160
180
10 20 30 40 50 60 70
0
x
W
W(30)=150
W(10)=80
figure 1 Graph of Mr. Hector’s weight
74 CHAPTER 1
■
Data, Functions, and Models
SECTION 1.7
■
Working with Functions: Getting Information from the Graph 75
example
1
Verbal Description from a Graph
Answer the following questions about the function W graphed in Figure 1.
(a) What was Mr. Hector’s weight at age 10? At age 30?
(b) Did his weight increase or decrease between the ages of 40 and 50? Between
the ages of 50 and 70?
(c) How did his weight change between the ages of 20 and 30?
(d) What was his minimum weight between the ages of 30 and 50?
(e) What was his maximum weight between the ages of 30 and 70?
(f) What is the net change in his weight from the age of 30 to 50?
Solution
(a) His weight at age 10 is W(10). The value of W(10) is the height of the graph
above the x-value 10. From the graph we see that . Similarly,
from the graph, .
(b) From the graph we see that the values of the function W were increasing
between the x-values 40 and 50, so Mr. Hector’s weight was increasing during
that period. However, the graph indicates that his weight was decreasing
between the ages of 50 and 70.
(c) From the graph we see that Mr. Hector’s weight was constant between the
ages of 20 and 30. He maintained his weight at 150 lb during that period.
(d) From the graph we see that the minimum value that W achieves between the
x-values of 30 and 50 is 130. So Mr. Hector’s minimum weight during that
period was 130 lb.
(e) From the graph we see that the maximum value that W achieves between the
ages of 30 and 70 is 200 lbs. So Mr. Hector’s maximum weight during that
period was 200 lb.
(f) From the graph we see that at age 30 Mr. Hector weighed 150 lb and at age 50
he weighed 200 lb. We have , so the net
change in his weight between those two ages is 50 lb.
■ NOW TRY EXERCISE 41 ■
A complete graph of a function contains all the information about the function,
because the graph tells us which input values correspond to which output values. To
analyze the graph of a function, we must keep in mind that the height of the graph is
the value of the function. So we can read the values of a function from its graph.
W1502- W1302= 200 - 150 = 50
W 1302= 150
W 1102= 80
example
2
Finding the Values of a Function from a Graph
The function T graphed in Figure 2 gives the temperature between noon and 6:00 P.M.
at a certain weather station.
(a) Find T(1), T(3), and T(5).
(b) Which is larger, T(2) or T(4)?
(c) Find the value(s) of x for which .
(d) Find the values of x for which .
(e) Find the net change in temperature between 3:00 and 5:00 P.M.
T1x 2Ú 25
T1x 2= 25
x
T (*F)
0
10
20
30
40
123456
figure 2
Interval notation is reviewed
in Algebra Toolkit A.2,
page T7.
example
3
Where Graphs of Functions Meet
Use a graphing calculator to draw graphs of the functions and
in the same viewing rectangle.
(a) Find the value(s) of x for which .
(b) Find the values of x for which .
(c) Find the values of x for which .
Solution
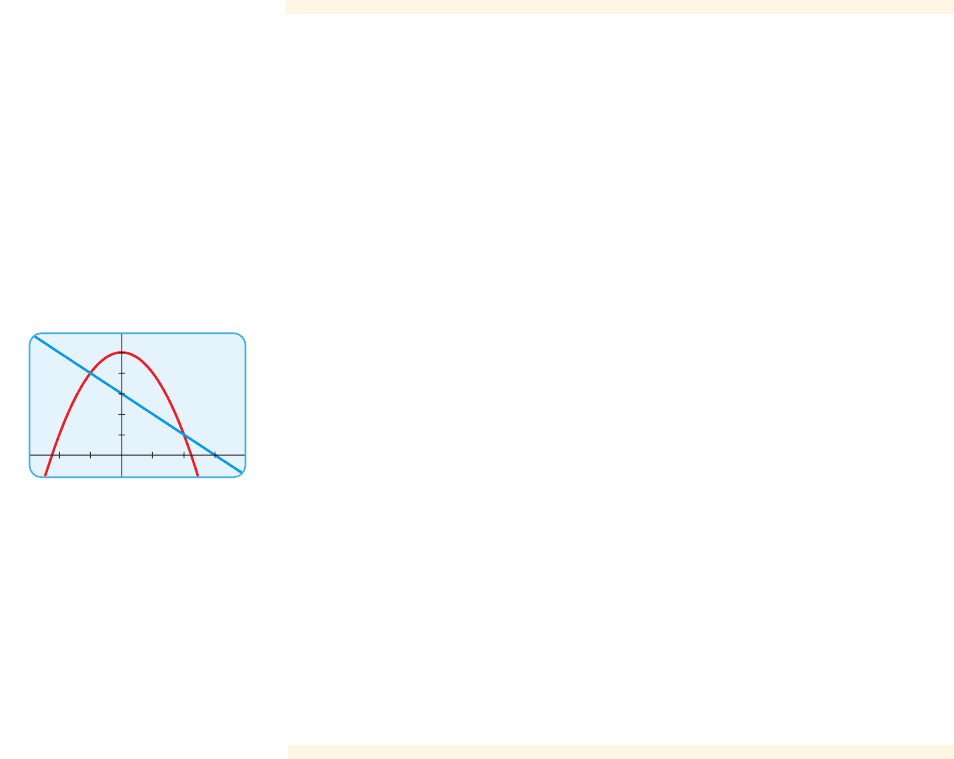
We graph the equations
in the same viewing rectangle in Figure 3.
(a) Recall that the value of a function is the height of the graph. So at
the x-values where the graphs of f and meet. From Figure 3 we see that the
graphs meet when x is and when x is 2. So when x is and
when x is 2.
(b) We need to find the x-values where . These are the x-values where
the graph of f is above the graph of . From Figure 3 we see that this happens
for x between and 2. So for x in the interval .
(c) We need to find the x-values where . These are the x-values where
the graph of f is below the graph of . From Figure 3 we see that this happens
for x strictly less than and x strictly bigger than 2, that is, and
. (We don’t include the points and 2 because of the strict inequality.)
So for x in the intervals and .
■ NOW TRY EXERCISE 11 ■
12, q 21- q, - 12f 1x 26 g1x2
- 1x 7 2
x 6-1- 1
g
f 1x 26 g1x2
3- 1, 24f 1x 2Ú g1x2- 1
g
f 1x 2Ú g1x2
- 1f 1x 2= g1x2- 1
g
f 1x 2= g1x2
y
1
= 5 - x
2
andy
2
= 3 - x
f 1x 26 g1x2
f 1x 2Ú g1x2
f 1x 2= g1x2
g1x 2= 3 - x
f 1x2= 5 - x
2
76 CHAPTER 1
■
Data, Functions, and Models
Solution
(a) is the temperature at 1:00 P.M. It is represented by the height of the graph
above the x-axis at the x-value 1. Thus . Similarly, and
.
(b) Since the graph is higher at the x-value 2 than at the x-value 4, it follows that
is greater than .
(c) The height of the graph is 25 when x is 1 and when x is 4. So when
x is 1 and when x is 4.
(d) The graph is higher than 25 for x between 1 and 4. So for all
x-values in the interval [1,4].
(e) From the graph we know that is 20 and is 30. We have
So the net change in temperature is .
■ NOW TRY EXERCISES 7 AND 43 ■
- 10°F
=-10
T152- T132= 20 - 30
T 132T 152
T 1x2Ú 25
T 1x2= 25
T14 2T122
T 152= 20
T 132= 30T 112= 25
T 112
6
_1
_3
4
figure 3 Graphs of f and g
SECTION 1.7
■
Working with Functions: Getting Information from the Graph 77
2
■ Domain and Range from a Graph
Recall from Section 1.4 that for a function of the form we have the following:y = f 1x2
Domain Range
Inputs Outputs
Independent variable Dependent variable
x-values y-values
The domain and range of a function f are represented in the graph of the
function as shown in the figure.
0
x
f
y
Range
Domain
So since the graph of f consists of the ordered pairs , the domain and range of
the function can be obtained from the graph as follows.
Domain and Range from a Graph
1x, y 2
For the function W graphed in Figure 1 on page 74, the domain is the interval
[0, 70] and the range is the interval [10, 200]. Note that the domain consists of all in-
puts (ages of Mr. Hector) and the range consists of all outputs (weights of Mr. Hector).
example
4
Domain and Range from a Graph
Let f be the function defined by .
(a) Use a graphing calculator to draw a graph of f.
(b) Find the domain and range of f from the graph.
Solution
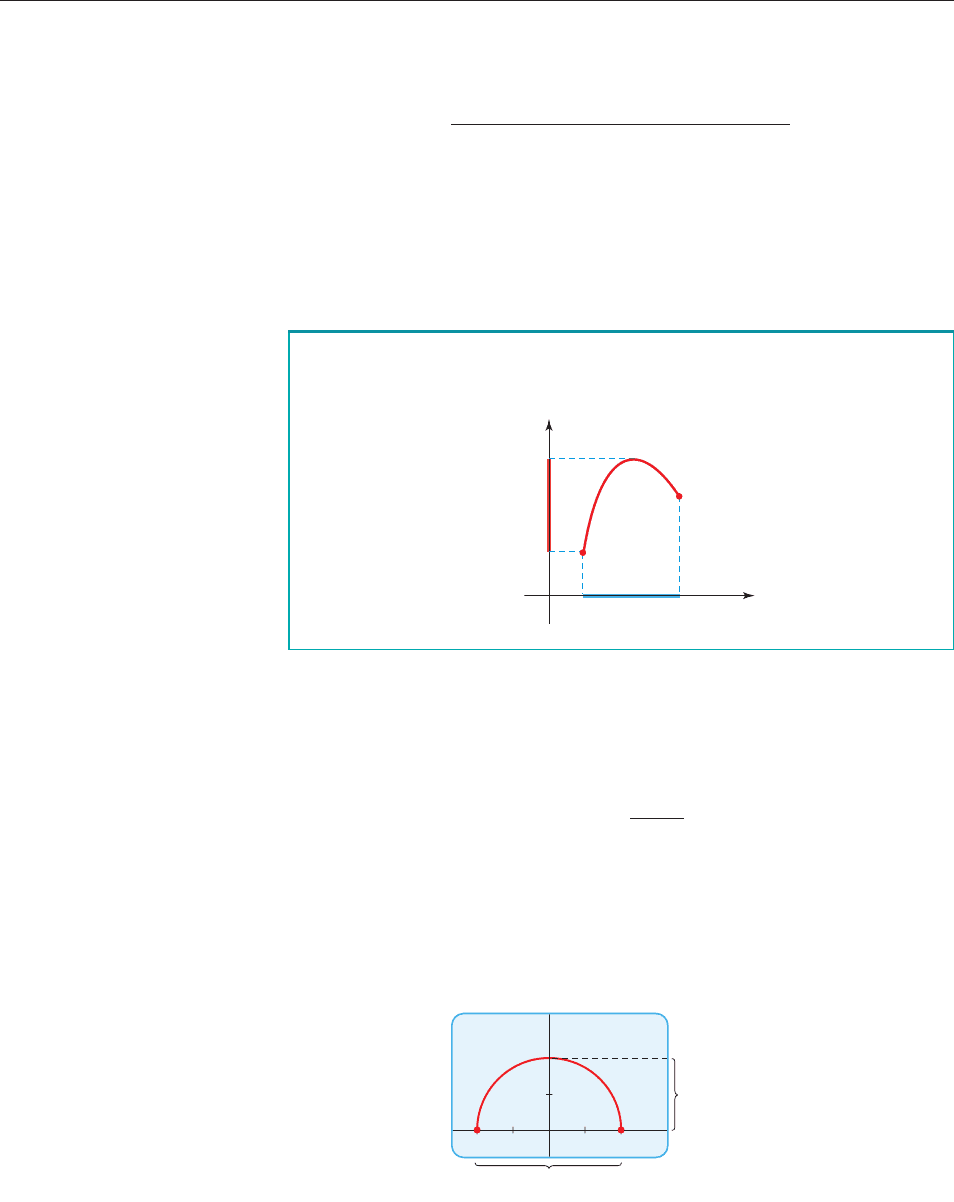
(a) The graph is shown in Figure 4.
f 1x 2= 24 - x
2
_2
2
0
Domain=[_2, 2]
Range=[0, 2]
figure 4
■
The function f is increasing if the values of increase as x increases.
That is, f is increasing on an interval I if whenever in I.
■
The function f is decreasing if the values of decrease as x increases.
That is, f is decreasing on an interval I if whenever in I.a 6 bf 1a27 f 1b 2
f 1x 2
a 6 bf 1a 26 f 1b2
f 1x 2
(b) From the graph we see that the domain is the interval and the range is
the interval .
■ NOW TRY EXERCISE 19 ■
30, 24
3- 2, 24
2
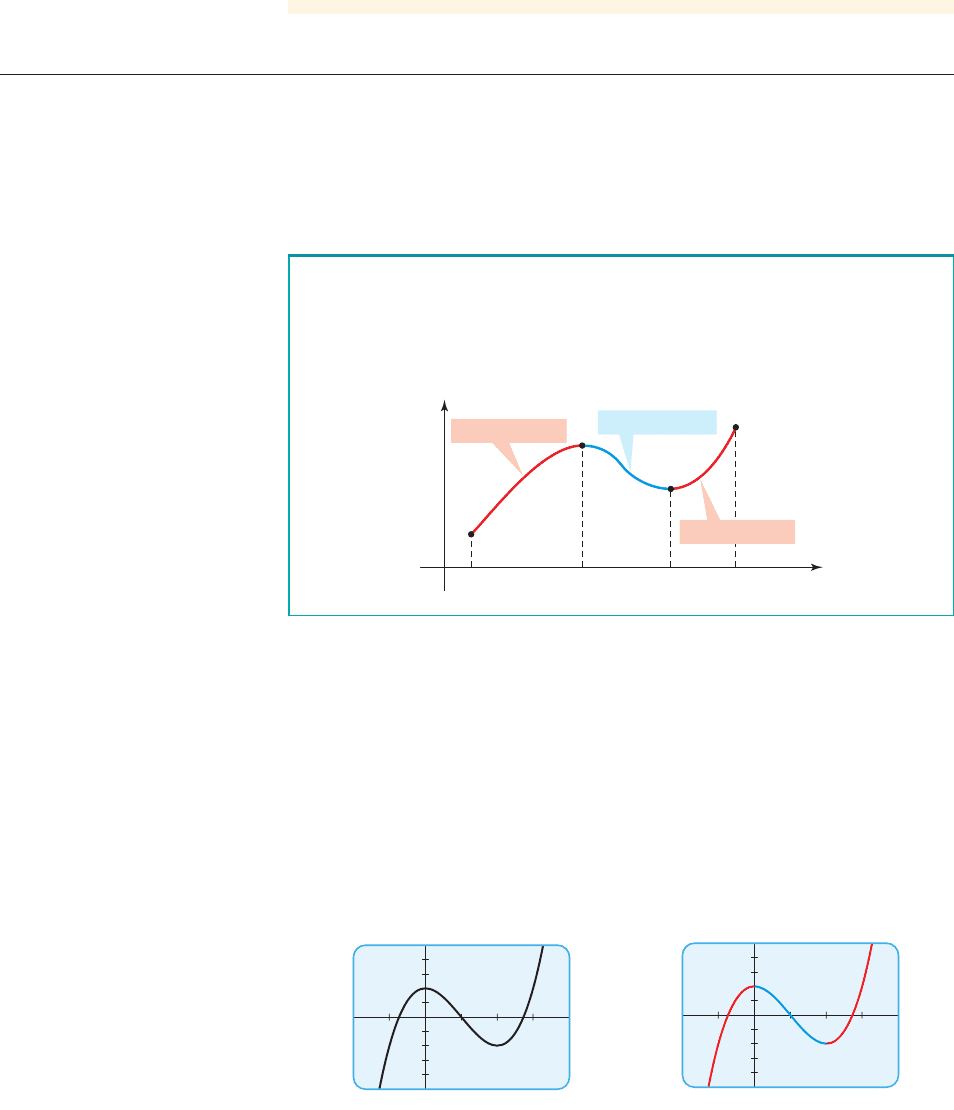
■ Increasing and Decreasing Functions
At the beginning of this section we saw that the graph of Mr. Hector’s weight rises
when his weight increases and falls when his weight decreases. In general, a func-
tion is said to be increasing when its graph rises and decreasing when its graph falls.
Increasing and Decreasing Functions
0
x
y
f
f is increasing
f is increasing
f is decreasing
78 CHAPTER 1
■
Data, Functions, and Models
example
5
Increasing and Decreasing Functions
Use a graphing calculator to draw a graph of .
(a) Find the intervals on which f is increasing.
(b) Find the intervals on which f is decreasing.
Solution
Using a graphing calculator, we draw a graph of the function f as shown in Figure 5.
(a) From the graph we see that f is increasing on and on (repre-
sented in red in Figure 6).
32, q 21- q, 04
f 1x 2= x
3
- 3x
2
+ 2
5
_5
_2
4
figure 5
5
_5
_2
4
figure 6
SECTION 1.7
■
Working with Functions: Getting Information from the Graph 79
(b) From the graph we see that f is decreasing on (represented in blue in
Figure 6).
■ NOW TRY EXERCISE 27 ■
30, 24
2
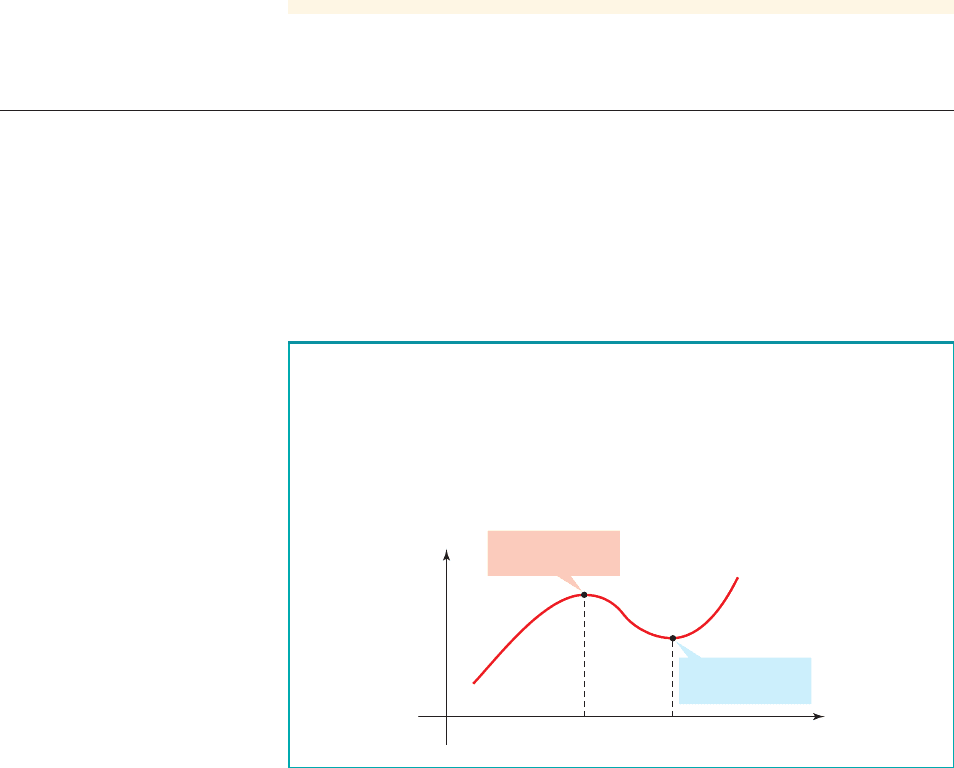
■ Local Maximum and Minimum Values
Finding the largest or smallest values of a function is important in many applications.
For example, if a function represents profit, then we are interested in its maximum
value. For a function that represents cost, we would be interested in its minimum
value. We can find these values from the graph of a function. We first define what we
mean by a local maximum or minimum.
Local Maximum and Minimum Values
The statement “ for values of x near a” means that for
all x in some open interval containing a. Similarly, the statement “ for
values of x near a” means that for all x in some open interval con-
taining a.
f 1a 2… f 1x2
f 1a 2… f 1x2
f 1a2Ú f 1x 2f 1a 2Ú f 1x2
■
The function value is a local maximum value of f if
for values of x near a
■
The function value is a local minimum value of f if
for values of x near af 1a 2… f 1x2
f 1a 2
f 1a 2Ú f 1x2
f 1a 2
0
xba
y
f
Local maximum
value f(a)
Local minimum
value f(b)
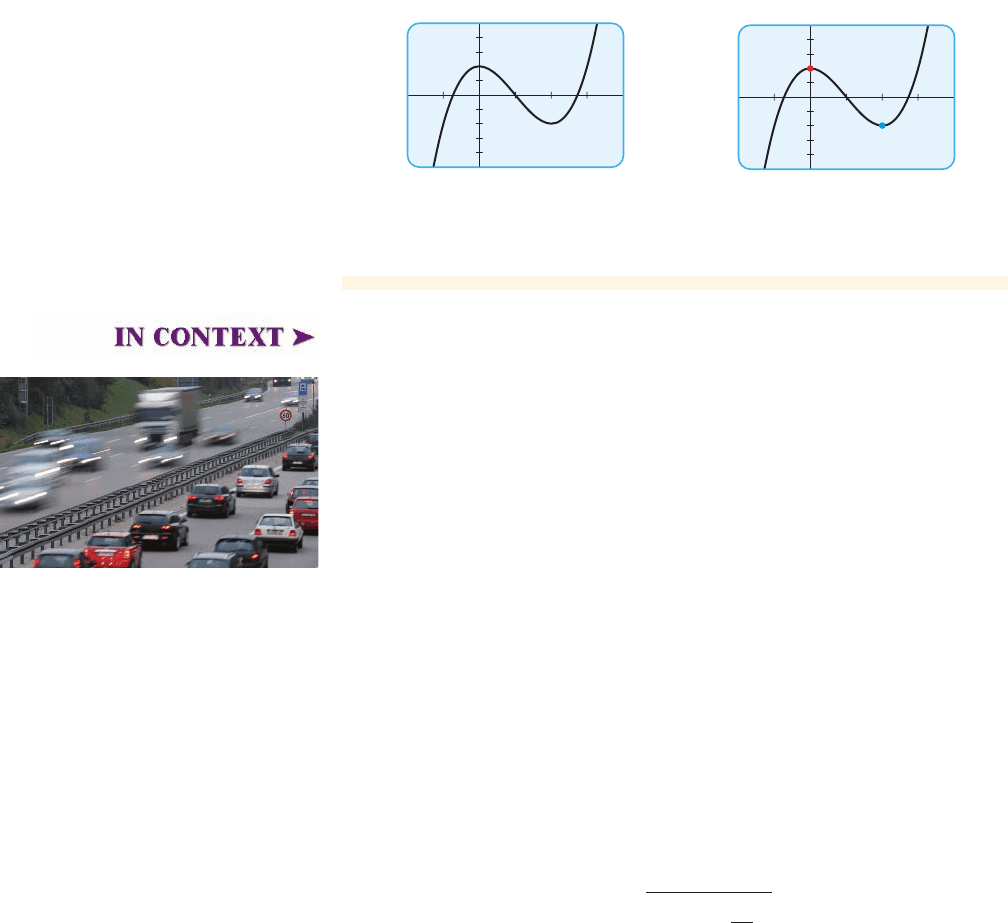
example
6
Local Maximum and Minimum Values of Functions
Find the local maximum and minimum values of .
Solution
The graph of f is shown in Figure 7 on the next page. From the graph we see that f has
a local maximum value 2 at the x-value 0. In other words, is a local maximumf 10 2= 2
f 1x2= x
3
- 3x
2
+ 2
Intervals are studied in Algebra
Toolkit A.2, page T7.
80 CHAPTER 1
■
Data, Functions, and Models
value (represented by the red dot on the graph in Figure 7). Similarly, is a
local minimum value (represented by the blue dot on the graph in Figure 8).
f 12 2=-2
■ NOW TRY EXERCISE 37 ■
Highway engineers use mathematics to study traffic patterns and relate them to
different road conditions. One feature that they are interested in is the carrying ca-
pacity of a road—that is, the maximum number of cars that can safely travel along a
certain stretch of highway. If the cars drive very slowly past a given point on the road,
only a few can pass by every minute. On the other hand, if the cars are zooming
quickly past that point, safety concerns require them to be spaced much farther apart,
so again not many can pass by every minute. Between these two extremes is an op-
timal speed at which these two competing tendencies balance to allow as many cars
as possible to drive down this stretch of road.
In the next example we use a graphing calculator to analyze the graph of a func-
tion developed by an engineer to model the carrying capacity of a highway. (See
Exploration 3 on page 560 to learn how this model is obtained.) The model assumes
that all drivers observe the “safe following distance” guidelines; in reality, the ma-
jority of drivers do not, resulting in traffic congestion and accidents.
5
_5
_2
4
figure 7
5
_5
_2
4
figure 8
IN CONTEXT ➤
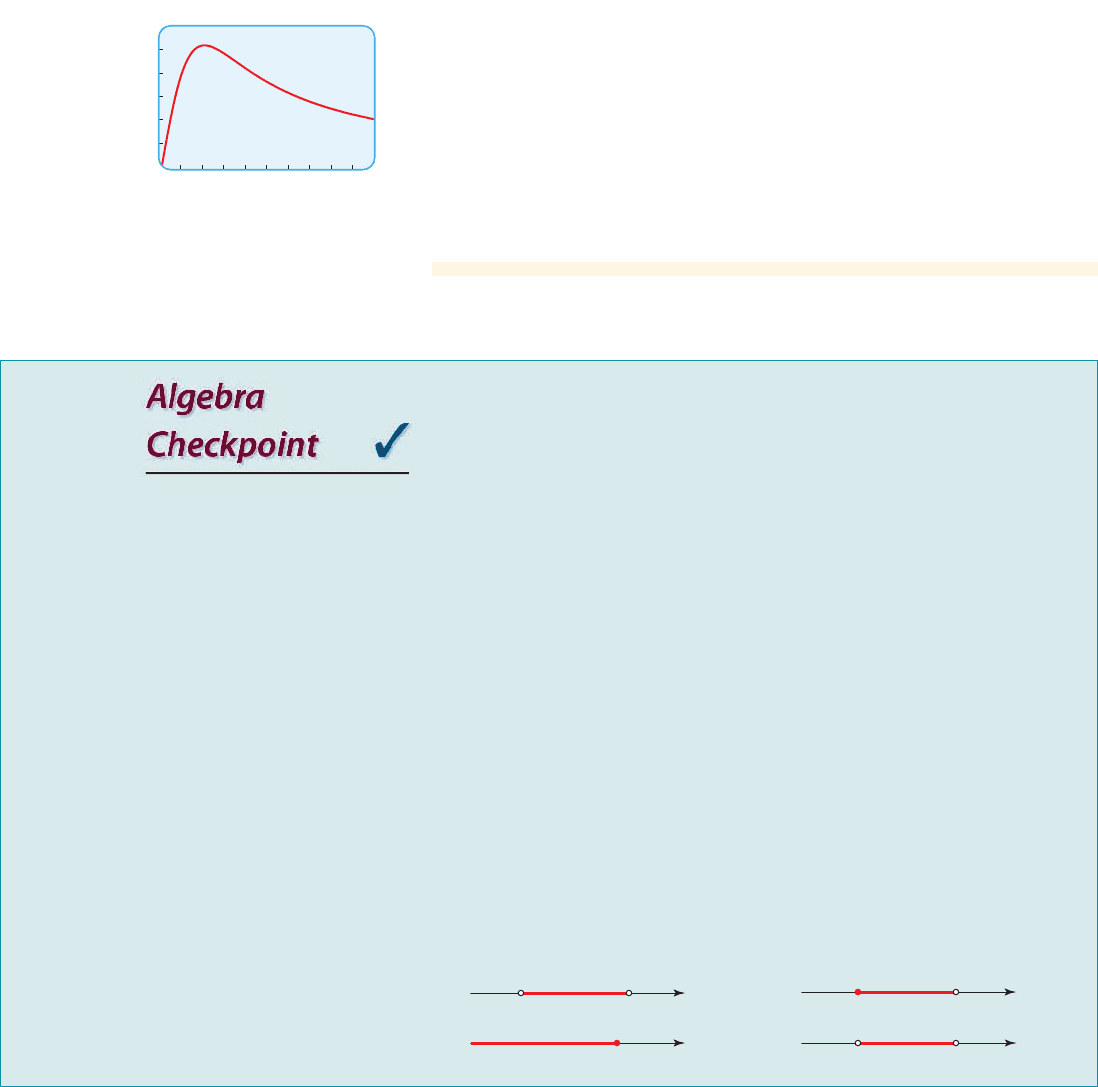
example
7
Highway Engineering
A highway engineer develops a formula to estimate the number of cars that can
safely travel a particular highway at a given speed. She assumes that each car is
17 feet long, travels at a speed of x mi/h, and follows the car in front of it at the
safe following distance for that speed. She finds that the number N of cars that
can pass a given point per minute is modeled by the function
Graph the function in the viewing rectangle [0, 100] by [0, 60].
(a) Where is the function N increasing? Decreasing?
(b) What is the local maximum value of N? At what x-value does this local
maximum occur?
(c) At what speed is the maximum carrying capacity of the road achieved?
N 1x2=
88x
17 + 17 a
x
20
b
2
Manfred Steinbach/Shutterstock.com 2009
SECTION 1.7
■
Working with Functions: Getting Information from the Graph 81
Solution
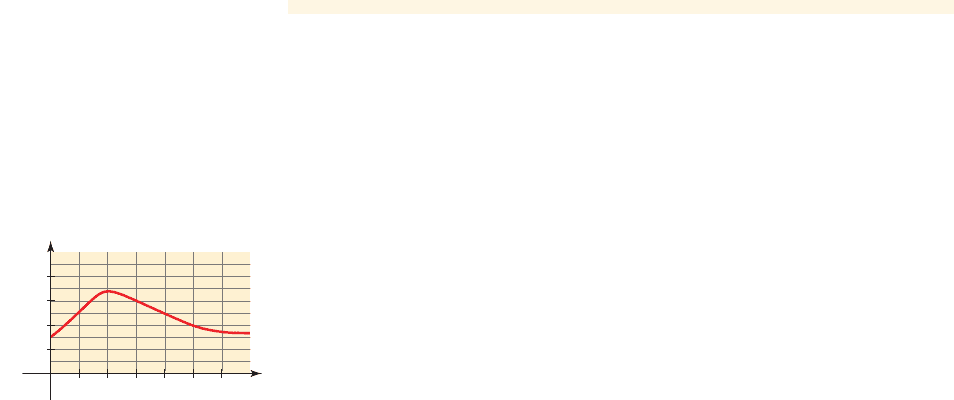
The graph is shown in Figure 9.
(a) From the graph we see that the function N is increasing on and
decreasing on .
(b) From the graph we see that N has a local maximum value of about 52 at the
x-value 20. So the highway can accommodate more cars at about 20 mi/h than
at higher or lower speeds.
(c) Since N has a local maximum value at the x-value 20, the maximum carrying
capacity of the road is achieved at 20 mi/h.
■ NOW TRY EXERCISE 49 ■
320, 1004
30, 204
60
0
100
figure 9 Highway capacity at
speed x
Test your skill in working with interval notation. Review this topic in
Algebra
Toolkit A.2
on page T7.
1–4 A set of numbers is given.
(a) Give a verbal description of the set.
(b) Express the set in interval notation.
(c) Graph the set on the number line.
1.
2.
3.
4.
5–8 An interval is given.
(a) Give a verbal description of the interval.
(b) Express the interval in set-builder notation.
(c) Graph the interval on the number line.
5. (2, 6) 6. 7. 8.
9–12 The graph of an interval is given.
(a) Give a verbal description of the interval.
(b) Express the interval in set-builder notation.
(c) Express the graphed interval in interval notation.
9. 10.
11. 12.
3- 1, q 21- q, 221- 4, 34
5x 冨 x Ú 06
5x 冨 - 10 6 x 6-36
5x 冨 - 3 … x 6 26
5x 冨1 … x … 46
_2
15
_1 1
_3 0
1.7 Exercises
CONCEPTS
Fundamentals
1–4 ■ These exercises refer to the graph of the function f shown at the left.
1. To find a function value from the graph of f, we find the height of the graph above
the x-axis at x ⫽
_______. From the graph of f we see that _______.
2. The domain of the function f is all the _______-values of the points on its graph, and
the range is all the corresponding
_______-values. From the graph we see that the
domain of f is the interval
_______ and the range of f is the interval _______.
3. (a) If f is increasing on an interval, then the y-values of the points on the graph
_______ (increase/decrease) as the x-values increase. From the graph we see that f
is increasing on the intervals
_______ and _______.
(b) If f is decreasing on an interval, then the y-values of the points on the graph
_______ (increase/decrease) as the x-values increase. From the graph we see that f
is decreasing on the intervals
_______ and _______.
4. (a) A function value is a local maximum value of f if is the
_______ value
of f on some interval containing a. From the graph we see that one local maximum
value of f is
_______ and that this value occurs when x is _______.
(b) A function value is a local minimum value of f if is the
_______ value
of f on some interval containing a. From the graph we see that one local minimum
value of f is
_______ and that this value occurs when x is _______.
Think About It
5. In Example 7 we saw a real-world situation in which it is important to find the
maximum value of a function. Name several other everyday situations in which a
maximum or minimum is important.
6. Draw a graph of a function f that is defined for all real numbers and that satisfies the
following conditions: f is always decreasing and for all x.
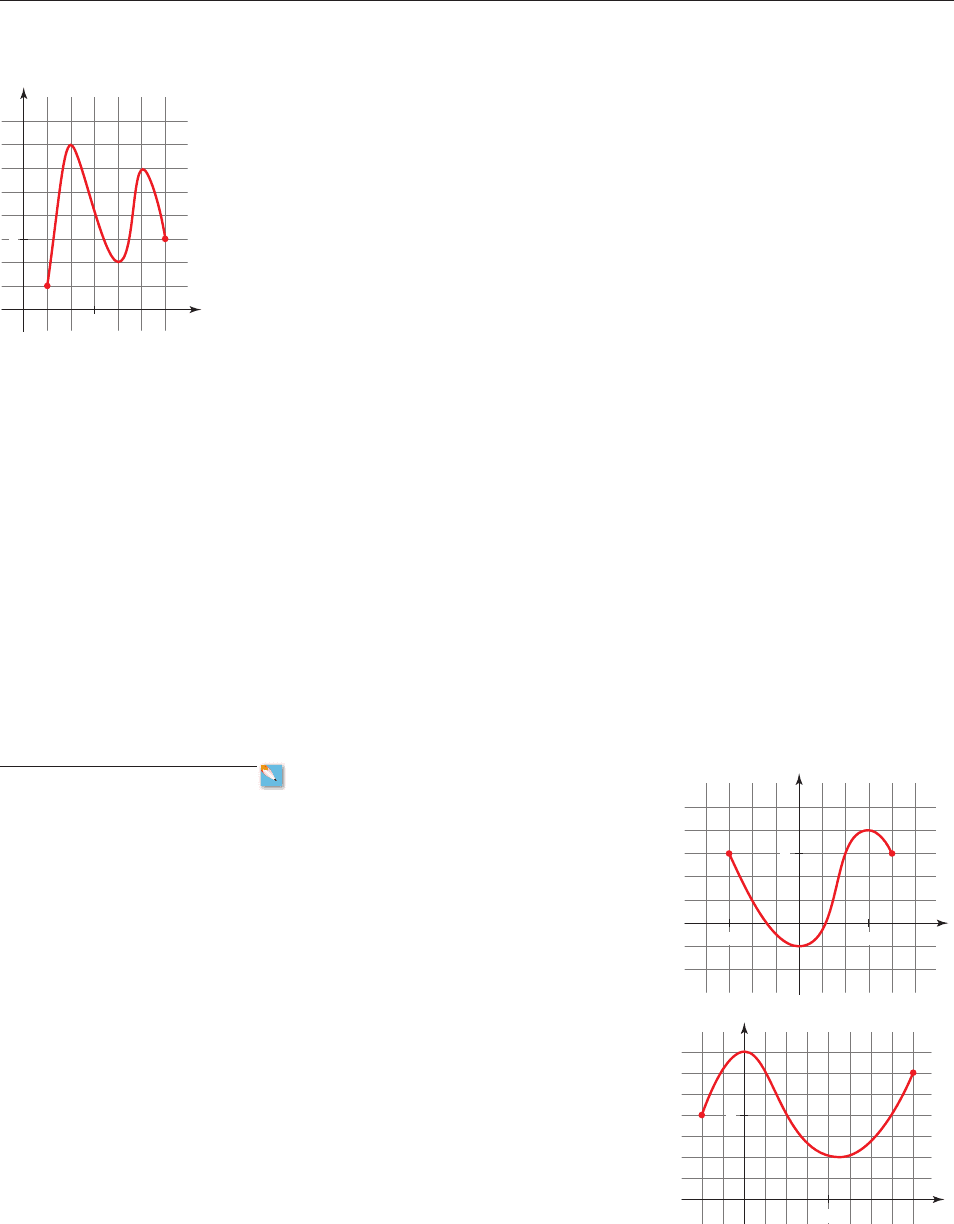
7. The graph of a function h is given.
(a) Find , and .
(b) Find the domain and range of h.
(c) Find the values of x for which .
(d) Find the values of x for which .
(e) Find the net change in the value of h when
x changes from .
8. The graph of a function is given.
(a) Find , and .
(b) Find the domain and range of .
(c) Find the values of x for which .
(d) Find the values of x for which .
(e) Find the net change in the value of when
x changes from 2 to 7.
g
g1x 27 4
g1x 2= 4
g
g172g1- 22, g10 2
g
- 2 to 4
h 1x 2… 3
h 1x 2= 3
h 13 2
h 1- 22, h 102, h 122
f 1x 27 0
f 1a 2f 1a 2
f 1a 2f 1a 2
f 132=
f 1a 2
SKILLS
0
x
f
y
3
3
82 CHAPTER 1
■
Data, Functions, and Models
0
x
g
y
4
4
0
x
h
y
3_3
3
SECTION 1.7
■
Working with Functions: Getting Information from the Graph 83
9. The graph of a function is given.
(a) Find , , , , and .
(b) Find the domain and range of .
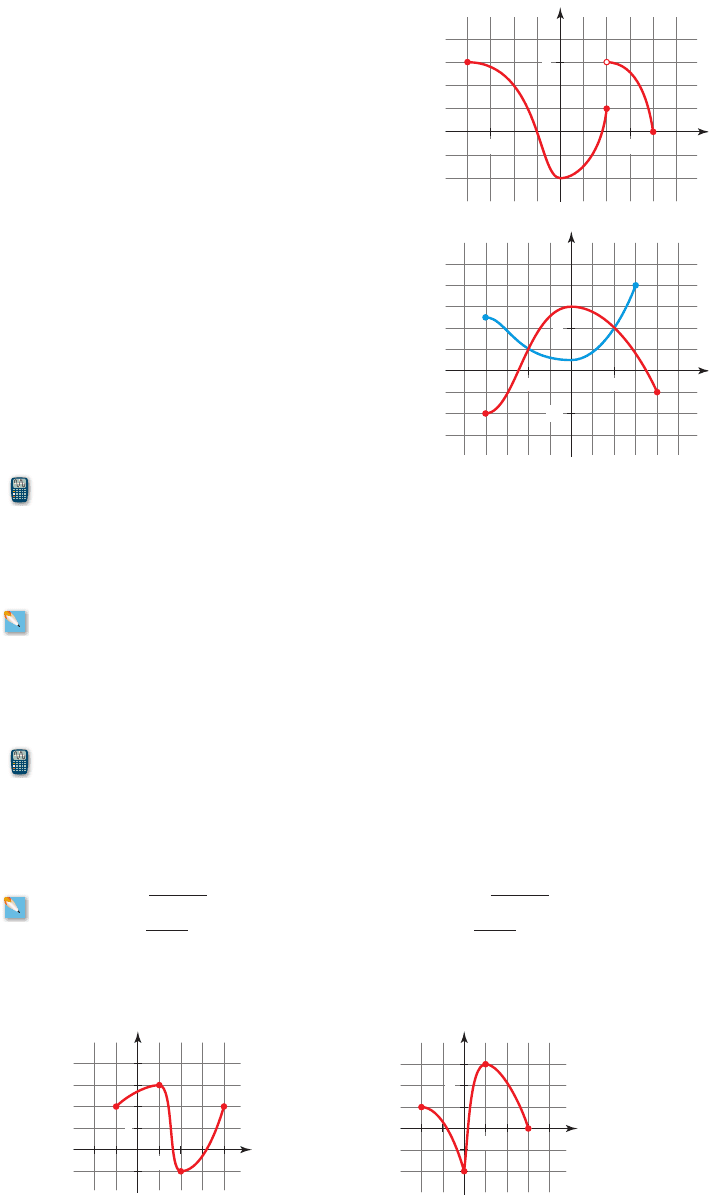
10. Graphs of the functions f and are given.
(a) Which is larger, ?
(b) Which is larger, ?
(c) For which values of x is ?
11–14
■ Graph the functions f and with a graphing calculator. Use the graphs to find the
indicated values or intervals; state your answer correct to two decimal places.
(a) Find the value(s) of x for which .
(b) Find the values of x for which .
(c) Find the values of x for which .
11.
12.
13.
14.
15–22
■ A function f is given.
(a) Use a graphing calculator to draw the graph of f.
(b) Find the domain and range of f from the graph.
15. 16.
17. 18.
19. 20.
21. 22.
23–26
■ The graph of a function is given. Determine the intervals on which the function is
(a) increasing and (b) decreasing.
23. 24.
f 1x 2= 1x + 2
f 1x 2= 1x - 1
f 1x 2=-225 - x
2
f 1x 2= 216 - x
2
f 1x 2= 4 - x
2
f 1x 2=-x
2
f 1x 2= 4f 1x 2= x - 1
f 1x 2= 1 - x
2
,g1x 2= x
2
- 2x - 1
f 1x 2= 2x
2
+ 3,g1x2=-x
2
+ 3x + 5
f 1x 2=-2x
2
+ 3x - 1,g1x2= 3x - 9
f 1x 2= x
2
- 5x + 1,g1x2=-3x + 4
f 1x 26 g1x 2
f 1x 2Ú g1x 2
f 1x 2= g1x 2
g
f 1x 2= g1x 2
f 1- 32 or g1- 32
f 102 or g102
g
g
g142g122g102g1- 22g1- 42
g
0
x
g
y
3_3
3
0
x
g
f
y
2_2
2
_2
x
y
1
1
0
x
y
1
1