Stewart J. College Algebra: Concepts and Contexts
Подождите немного. Документ загружается.


example
3
Finding a Formula for Average
In a mathematics course there are three exams during the semester.
(a) Find a formula for a student’s average score for the three exams.
(b) Jim’s test scores are 78, 81, and 93. Find Jim’s average test score.
Thinking About the Problem
To find the average of two numbers, we add them and divide by 2. For example,
the average of 10 and 30 is
right in the middle between 10 and 30. To find the average of three numbers, we
add them and divide by 3. So the average of three test scores is
For example, the average of 10, 30, and 80 is
Solution
(a) To express the average as a formula, we need to assign symbols to the
variables involved. Let’s use subscripts and write the three test scores as , ,
and .s
3
s
2
s
1
10 + 30 + 80
3
= 40
average =
Score 1 + Score 2 + Score 3
3
10 + 30
2
= 20
2
■ Variables with Subscripts
In writing a formula, the goal is to express the relationship between the variables
as clearly and concisely as possible. One way we do this is to use letters that
clearly remind us of the quantities the letters denote—for example, A for area,
for volume, P for pressure, S for surface area, and so on. Sometimes two or more
variables of the same “type” occur in a formula. In this case we use the same let-
ter with different subscripts to denote these variables. For example, the formula for
the gravitational force between two objects involves the two masses of these ob-
jects. We could use a different letter for each mass (such as M and N), but it’s much
clearer to denote the two masses using the same letter m but with different sub-
scripts. So and denote two different variables. With this notation, Newton’s
formula for the gravitational force between two objects is
where F is the gravitational force, and are the masses of the two objects,
d is the distance between them, and is the universal gravitational constant
/ . We will use this formula in Example 6.kg
2
21G L 6.673 * 10
-11
N-m
2
G
m
2
m
1
F = G
m
1
m
2
d
2
m
2
m
1
V
104 CHAPTER 1
■
Data, Functions, and Models

SECTION 1.9
■
Making and Using Formulas 105
In Words In Algebra
Score on test 1
s
1
Score on test 2
s
2
Score on test 3
s
3
Average A
We need to express the following “word” formula as an algebraic formula:
We write this as
(b) To get the average of Jim’s test scores, we use the formula we have just found.
We replace by 78, by 81, and by 93 in the formula:
Formula
Replace by 78, by 81, and by 93
Calculator
Jim’s average test score is 84.
■ NOW TRY EXERCISE 23 ■
= 84
s
3
s
2
s
1
=
78 + 81 + 93
3
A =
s
1
+ s
2
+ s
3
3
s
3
s
2
s
1
A =
s
1
+ s
2
+ s
3
3
average =
Score 1 + Score 2 + Score 3
3
2
■ Reading and Using Formulas
Since a formula is an algebraic expression, we can read what the formula is telling
us by examining its algebraic form. For example, the formula
mentioned at the beginning of this section contains the fraction . Since is in the
denominator, the larger the volume becomes, the smaller the fraction becomes
and hence the smaller the pressure P. On the other hand, the higher the temperature
T becomes the larger the fraction becomes and hence the greater the pressure P.
We can also use the rules of algebra to rewrite a formula in many different equiv-
alent ways. For example, you can check that the above formula can be written in any
of the following ways:
These four formulas are equivalent—they contain exactly the same information
about the relationship of the variables P, , and T. But the first formula is mostV
P = k
T
V
V = k
T
P
T =
1
k
PVPV = kT
T>V
T>VV
VT>V
P = k
T
V

example
5
The Height of a Box
In Example 2 we found that the formula for the surface area of a rectangular box is
(a) Solve this formula for the height h.
(b) Find the height of a box if its length is 8 in, its width is 5 in, and its surface
area is .
Solution
(a) To solve for h, we need to put h alone on one side of the equation. We proceed
as follows:
184 in
2
S = 2lh + 2wh + 2lw
example
4
The Score You Need on Test 3
Martha’s scores on her first two tests are 78 and 75. She wants to know what score
she needs on her third test to have an average of 80 for the three tests. Martha knows
the formula for average,
But she wants to know how to use this formula to answer her question.
(a) Solve the formula for the variable .
(b) Find the score Martha needs on her third test.
Solution
(a) We solve for as follows:
Formula
Multiply each side by 3
Subtract and from each side
So we can write the formula
This formula allows us to find if we know , , and A.
(b) We use the formula we found in part (a) with 78 for , 75 for , and 80 for A.
Formula
Replace by 78, by 75, and A by 80
So Martha needs to get 87 on her third test to have an average score of 80.
■ NOW TRY EXERCISE 27 ■
= 87
s
2
s
1
= 3
#
80 - 78 - 75
s
3
= 3A - s
1
- s
2
s
2
s
1
s
2
s
1
s
3
s
3
= 3A - s
1
- s
2
s
2
s
1
3 A - s
1
- s
2
= s
3
3 A = s
1
+ s
2
+ s
3
A =
s
1
+ s
2
+ s
3
3
s
3
s
3
A =
s
1
+ s
2
+ s
3
3
106 CHAPTER 1
■
Data, Functions, and Models
Solving for one variable in
terms of another is reviewed in
Algebra Toolkit C.1, page T47.
useful for calculating pressure, the second for volume, the third for temperature, and
the fourth looks the nicest. We explore these ideas in the following examples.
SECTION 1.9
■
Making and Using Formulas 107
We used the Distributive
Property to factor h. This
Property is reviewed in
Algebra Toolkit A.1, page T1.
Formula
Subtract 2lw from each side
Factor h from the right-hand side
Divide each side by
So we can write the formula as
This formula allows us to find h if we know l, w, and S.
(b) We use the formula we found in part (a) with l replaced by 8, w by 5, and S by
184:
Formula
Replace l by 8, w by 5, and S by 184
Calculator
The height of the box is 4 ft.
■ NOW TRY EXERCISE 25 ■
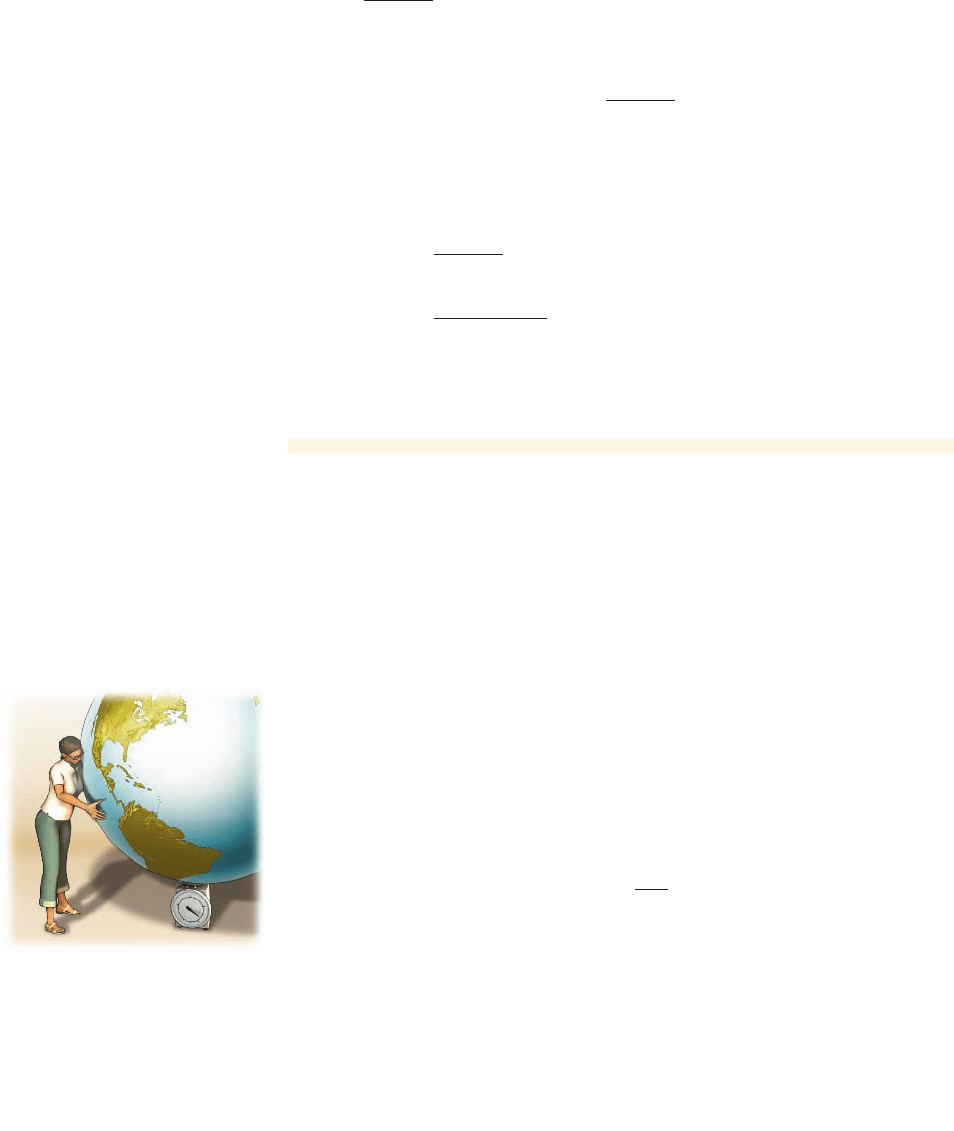
Have you ever wondered how much the world weighs? In the next example we
answer this question without having to put the world in oversized scales. We sim-
ply use Newton’s formula for gravitational force. The fact that we can answer such
a question using a simple formula shows the stupendous power of reasoning with
formulas.
= 4
=
184 - 2
#
8
#
5
2
#
8 + 2
#
5
h =
S - 2lw
2l + 2w
h =
S - 2lw
2l + 2w
2l + 2w
S - 2lw
2l + 2w
= h
S - 2lw = h12l + 2w2
S - 2lw = 2lh + 2wh
S = 2lh + 2wh + 2lw
example
6
Weighing the Whole World
Sammy wants to find out how much the world weighs; more precisely, she wants to
find the mass of the world. She knows two of Newton’s formulas. The first gives the
force F required to move an object of mass m at acceleration a:
The second gives the gravitational force F between two objects a distance d apart
with masses m and M:
where is the gravitational constant /kg
2
(in the metric system).
(a) Let M be the mass of the earth and m be the mass of a lead ball. Use the fact
that the force F is the same in each formula to find a formula for M.
(b) The distance d between the lead ball and the earth is the radius of the earth, so
, and the acceleration due to gravity at the surface of the
earth is 9.8 m/s. Use these facts to find the mass of the earth.
d L 6.38 * 10
6
m
6.67 * 10
-11
N-m
2
G
F = G
mM
d
2
F = ma
1.9 Exercises
CONCEPTS
Fundamentals
1. The model gives the total number of legs that S animals have, where each
animal has n legs. Using this model, we find that 12 spiders have L ⫽
____ ⫻ ____ ⫽
____ legs, whereas 20 chickens have L ⫽ ____ ⫻ ____ ⫽ ____ legs.
2. The formula models the distance d in miles that you travel in t hours at a speed
of r miles per hour. So the formula that models the time t it takes to go a distance d at a
speed r is given by . We use this formula to find how long it takes to go
350 miles at a speed of 55 miles per hour:
_____________.t =
=
t =
d = rt
L = nS
Solution
(a) We equate the two different expressions for F and solve for M:
Because and
Divide by m
Multiply by and divide by
So we can write a formula for the mass of the earth:
This formula allows us to find M if we know a, d, and .
(b) We use the formula we found in part (a):
Formula
Substitute the value of each quantity
Calculator
So the mass of the earth is just a bit less than . Written out in full,
this is about
or 6 septillion kilograms.
■ NOW TRY EXERCISE 33 ■
6,000,000,000,000,000,000,000,000 kg
6 * 10
24
kg
L 5.98 * 10
24
=
19.8216.38 * 10
6
2
2
6.67 * 10
-11
M =
ad
2
G
G
M =
ad
2
G
Gd
2
ad
2
G
= M
a = G
M
d
2
F = G
mM
d
2
F = ma ma = G
mM
d
2
108 CHAPTER 1
■
Data, Functions, and Models
Scientific notation is studied in
Exploration 1, page 312.
SECTION 1.9
■
Making and Using Formulas 109
SKILLS
CONTEXTS
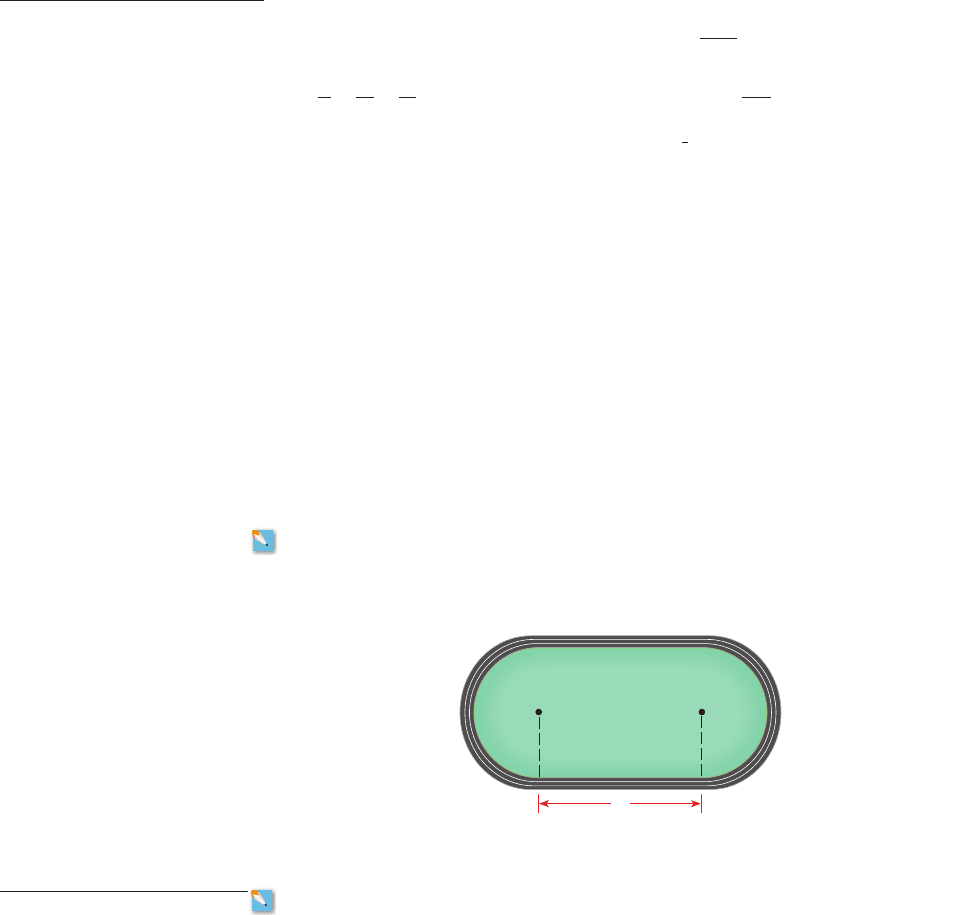
20. The area A enclosed by the race track in the preceding figure.
21. Emissions Many scientists believe that the increase of carbon dioxide in
the atmosphere is a major contributor to global warming. The Environmental Protection
Agency estimates that one gallon of gasoline produces on average about 19 pounds of
when it is combusted in a car engine.
(a) Find a formula for the amount A of a car produces in terms of the number n of
miles driven and the gas mileage of the car.
(b) Debbie owns an SUV that has a gas mileage of 21 mi/gal. Debbie drives 15,000
miles in one year. Use the formula you found in part (a) to find how much
Debbie’s car produces in one year.
(c) Debbie’s friend Lisa owns a hybrid car that has a gas mileage of 55 mi/gal. Lisa
also drives 15,000 miles in one year. Use the formula you found in part (a) to find
how much Lisa’s car produces in one year.CO
2
CO
2
G
CO
2
CO
2
1CO
2
2CO
2
3–8 ■ Solve the equation to find a formula for the indicated variable.
3. ; for R 4. ; for d
5. ; for 6. ; for i
7. ; for w 8. ; for r
9–16
■ Find a formula that models the quantity described.
9. The average A of two numbers and .
10. The average A of three numbers , , and .
11. The sum S of the squares of n and m.
12. The sum S of the square roots of n and m.
13. The product P of an integer n and two times an integer m.
14. The product P of the squares of n and m.
15. The time t it takes an airplane to travel d miles if its speed is r miles per hour.
16. The speed r of a boat that travels d miles in t hours.
17–20
■ Find a formula that models the quantity described. You may need to consult the
formulas for area and volume listed on the inside back cover of this book.
17. The surface area A of a box with an open top of dimensions l, w, and h.
18. The surface area A of a cylindrical can with height h and radius r.
19. The length L of the race track shown in the figure.
a
3
a
2
a
1
a
2
a
1
V =
1
3
pr
2
hS = 2lw + 2wh + 2lh
A = P a1 +
i
100
b
2
R
1
1
R
=
1
R
1
+
1
R
2
F = G
m
1
m
2
d
2
PV = nRT
x
r
x10 m
2 m
6 m
110 CHAPTER 1
■
Data, Functions, and Models
22. Prehistoric Vegetation Gasoline is refined from crude oil, which was formed from
prehistoric organic matter buried under layers of sediment. High pressures and temperatures
transformed this material into the hydrocarbons that we call crude oil. Scientists estimate
that it takes about 98 tons of prehistoric vegetation to produce one gallon of gasoline.
(Today, it takes about 40 acres of farmland to produce 98 tons of vegetation in one season.)
(a) Find a formula for the amount of prehistoric vegetation it took to produce the
gasoline needed to drive a car in terms of the number n of miles driven and the gas
mileage of the car.
(b) Sonia owns an SUV that has a gas mileage of 18 mi/gal. Sonia drives 10,000 miles
a year. Use the formula you found in part (a) to find the amount of prehistoric
vegetation it took to produce the gas that Sonia’s SUV uses in one year.
23. Investing in Stocks Some investors buy shares of individual stocks and hope to make
money by selling the stock when the price increases.
(a) Find a formula for the profit P an investor makes in terms of the number of shares n
she buys, the original price of a share, and the selling price of a share.
(b) Silvia plans to make money by buying and selling shares of stock in her favorite
retail store. She buys 1000 shares for $21.50 and waits patiently for many months
until the price finally increases to $25.10. Use the formula found in part (a) to find
the profit Silvia will make on her investment if she sells at $25.10.
24. Growth of a CD If you invest in a 24-month CD (certificate of deposit), then the
amount A at maturity is given by the formula
where P is the principal and the interest rate is r%.
Carlos invests $2000 in a 24-month CD that has a 2.75% interest rate. Use the
formula to find how much Carlos’ CD is worth at maturity.
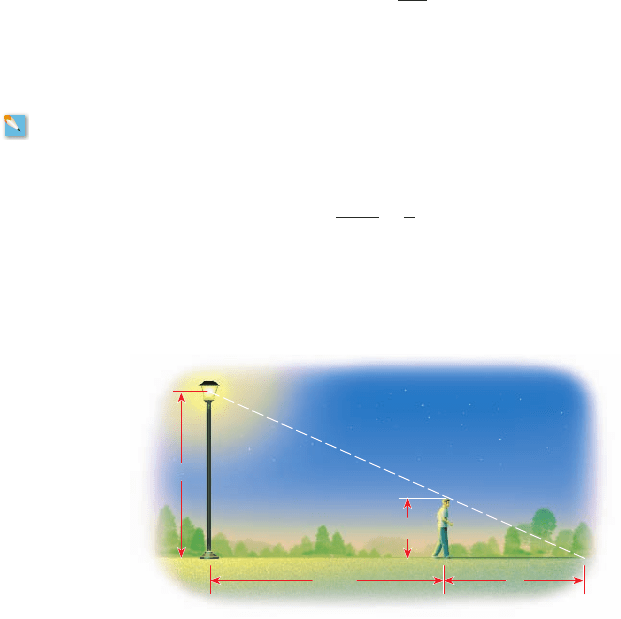
25. Length of Shadow A man is walking away from a lamppost with a light source 6 m
above the ground. If the man is h meters tall and y meters from the lamppost, then the
length x of his shadow satisfies the equation
(a) Find a formula for x.
(b) The figure shows a 2-meter-tall man walking away from the lamppost. Use the
formula to find the length of his shadow when he is 10 m from the lamppost.
y + x
6
=
x
h
A = P a1 +
r
100
b
2
p
s
p
0
G
V
SECTION 1.9
■
Making and Using Formulas 111
26. Printing Costs The cost of printing a magazine depends on the number p of pages in
the magazine and the number m of copies printed. The cost C is given by the formula
where k depends on per page printing price.
(a) Find a formula for k.
(b) Find the value of k using the fact that it costs $12,000 to print 4000 copies of a
120-page magazine.
(c) Use the formula to determine how many copies of a 92-page magazine can be
printed if the cost must be no more than $40,000.
27. Electrical Resistance When two resistors with resistances and are connected in
parallel, their combined resistance R is given by the formula
Suppose that an 8- resistor is connected in parallel with a 10- resistor. Use the
formula to find their combined resistance R.
28. Temperature of Toaster Wire The resistance R of the heating wire for a toaster
depends on temperature. The resistance R at temperature T is given by the formula
where is the resistance at the initial temperature (in degrees Celsius). If the initial
temperature of a toaster is and the resistance at that temperature is 147 , find the
resistance when the heating wire reaches a temperature of 360°C.
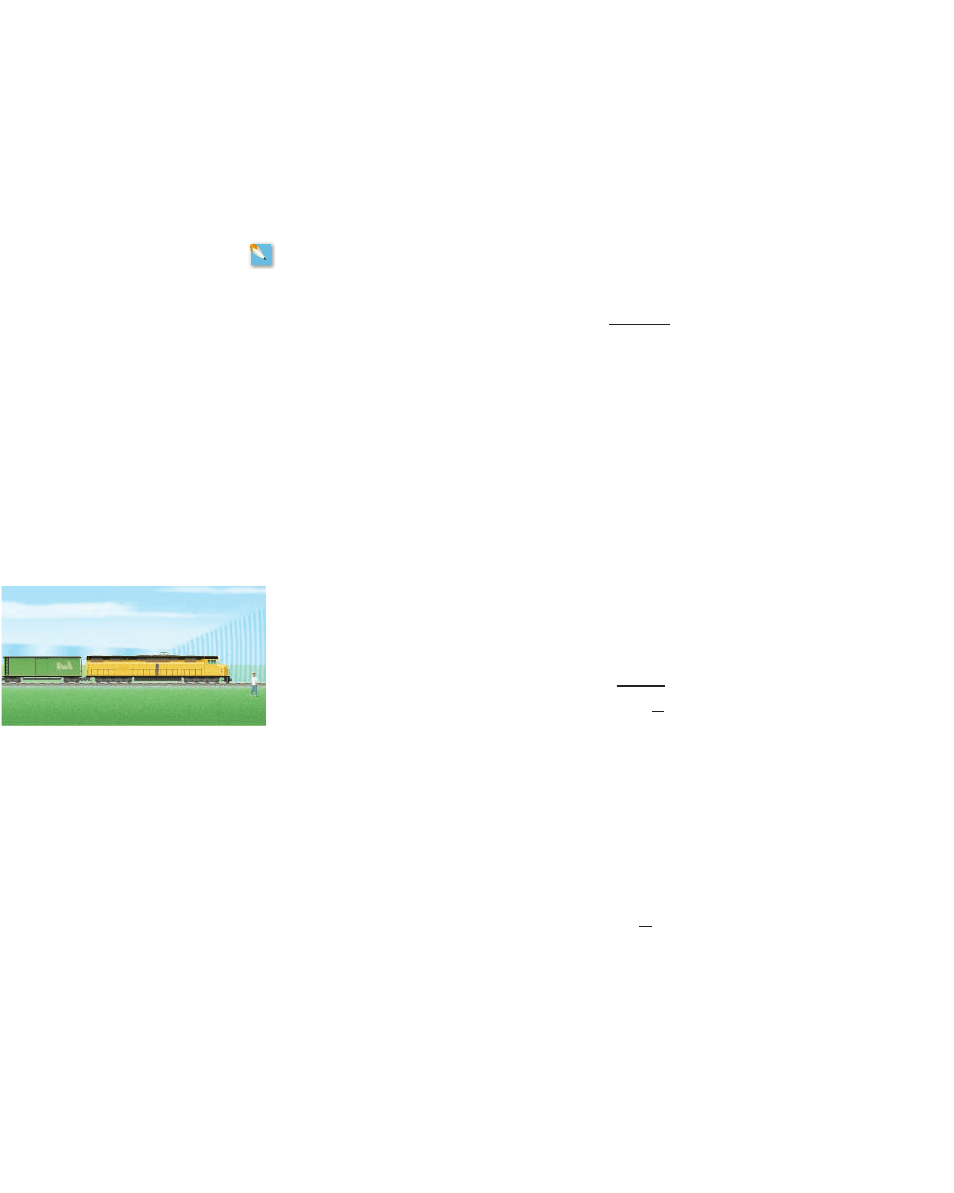
29. The Doppler Effect As a train moves toward an observer (see the figure), the pitch of
its whistle sounds higher to the observer than it would if the train were at rest. This
phenomenon is called the Doppler effect. The observed pitch is given by the formula
where is the actual pitch of the whistle at the source, is the speed of the train, and
m/s is the speed of sound in air. Suppose the train has a whistle pitched at
Hz. Find the pitch of the whistle as perceived by an observer if the speed of
the train is 44.7 m/s.
30. Boyle’s Law Boyle’s Law states that the pressure P in a sample of gas is related to the
temperature T and the volume by the formula
where k is a constant.
(a) A certain sample of gas has a volume of 100 L and exerts a pressure of 33.2 kPa at
a temperature of 400 K (absolute temperature measured on the Kelvin scale). Use
these facts to determine the value of k for this sample.
(b) If the temperature of this sample is increased to 500 K and the volume is decreased
to 80 L, use the formula to find the pressure of the gas.
(c) If the volume is quadrupled and the temperature is halved, does the pressure
increase or decrease? By what factor?
P = k
T
V
V
P
s
= 440
s
o
= 332
√
s
P
s
P
o
=
P
s
1 -
√
s
s
o
P
o
⍀20°C
T
0
R
0
R = R
0
31 + 0.000451T - T
0
24
⍀⍀
R =
R
1
R
2
R
1
+ R
2
R
2
R
1
C = kpm
Bird w (lb)
S (in
2
)
w/S
v (mi/h)
Common tern 0.26 76
Black-headed gull 0.52 120
Common gull 0.82 180
Royal tern 1.1 170
Herring gull 2.1 280
Great skua 3.0 330
Sooty albatross 6.3 530
Wandering albatross 19.6 960
112 CHAPTER 1
■
Data, Functions, and Models
31. Spread of a Disease The rate r at which a disease spreads in a population of size P is
related to the number x of infected people and the number of those who are not
infected, by the formula
where k is a constant that depends on the particular disease. An infection spreads in a
town with a population of 5000.
(a) Compare the rate of spread of this infection when 10 people are infected to the rate
of spread when 1000 people are infected. Which rate is larger?
(b) Calculate the rate of spread when the entire population is infected. Why does your
answer make intuitive sense?
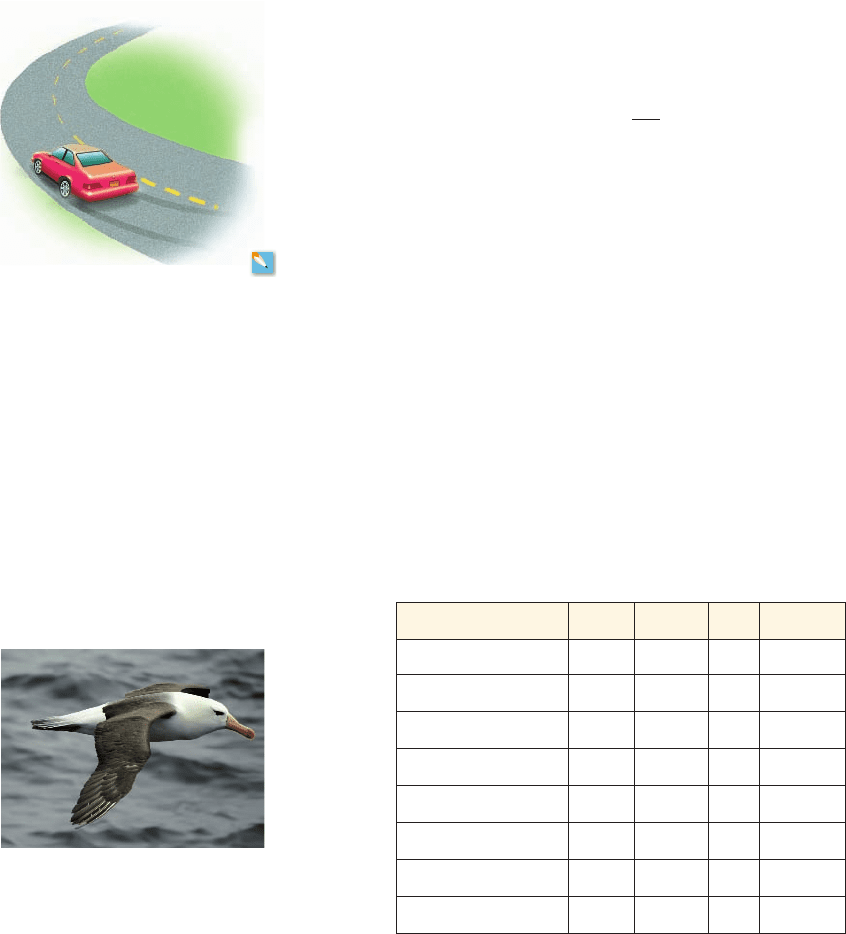
32. Skidding in a Curve A car is traveling on a curve that forms a circular arc. The force
F needed to keep the car from skidding is related to weight w of the car and the speed s
and the radius r of the curve by the formula
where k is a constant that depends on the friction between the tires and the road. A car
weighing 1600 lb travels around a curve at 60 mi/h. The next car to round this curve
weighs 2500 lb and requires the same force as the first car to keep from skidding. How
fast is the second car traveling?
33. Flying Speeds of Migrating Birds Many birds migrate thousands of miles each year
between their winter feeding grounds and their summer nesting sites. For instance, the
15-gram blackpoll warbler travels 12,000 miles from western Alaska to South America.
The air speed at which a migrating bird flies depends on its weight w and the surface
area S of its wings; these quantities satisfy the equation
where w is measured in pounds, S in square inches, and in miles per hour.
(a) Find a formula for in terms of w and S.
(b) Complete the table to find the ratio w/S and the migrating air speed for the
indicated sea birds.
(c) The ratio w/S is called the wing loading; the greater a bird’s wing loading, the faster
it must fly. A certain bird has a wing loading twice that of the sooty albatross. What
is its migrating air speed?
√
√
√
S√
2
= 94,700w
√
F = k
ws
2
r
r = kx1P - x2
P - x
Armin Rose/Shutterstock.com 2009

CHAPTER 1
■
Review 113
CHAPTER 1
REVIEW
CONCEPT CHECK
Make sure you understand each of the ideas and concepts that you learned in this chapter,
as detailed below, section by section. If you need to review any of these ideas, reread the
appropriate section, paying special attention to the examples.
1.1 Making Sense of Data
A set of one-variable data is a list of numbers, usually obtained by recording val-
ues of a varying quantity. The average of a list of n numbers is their sum divided
by n. If the list is written in order, then its median is either the middle number (if n
is odd) or the average of the two middle numbers (if n is even).
A set of two-variable data involves two varying quantities that are related to
each other. For example, recording the heights and weights of all the students in a
class gives a set of two-variable data. We can use a table with two columns or two
rows to record two-variable data.
1.2 Visualizing Relationships in Data
Two-variable data are sets of related ordered pairs of numbers. Any set of ordered
pairs is a relation. The first element in each ordered pair is the input, and the sec-
ond is the corresponding output. The domain of the relation is the set of all inputs,
and the range is the set of all outputs.
To see patterns and trends in two-variable data, we can graph the ordered pairs
in the relation given by the data, on a coordinate plane. Such a graph is called a scat-
ter plot.
1.3 Equations: Describing Relationships in Data
A mathematical model is an equation that describes the relationship between the
variables in a real-world situation. Data can often be modeled by using a linear
model, which is an equation of the form
In this equation, A is the initial value of y (the value when ), and B is the
amount by which y changes for every unit increase in x. A scatter plot can often tell
us whether data are best modeled with a linear model. If a set of data has equally
spaced inputs, then we can use the first differences of the outputs to determine
whether a linear model is appropriate for the data.
Using a model, we can predict output values for any input by substituting the in-
put into the equation and solving for the output.
1.4 Functions: Describing Change
A function is a relation in which each input gives exactly one output. We say that y
is a function of x if for every input x there is exactly one output y, and we refer to x
as the independent (input) variable and y as the dependent (output) variable.
x = 0
y = A + Bx
CHAPTER
1