Stewart J. College Algebra: Concepts and Contexts
Подождите немного. Документ загружается.

84 CHAPTER 1
■
Data, Functions, and Models
25. 26.
27–32
■ A function f is given.
(a) Use a graphing device to draw the graph of f.
(b) State approximately the intervals on which f is increasing and on which f is
decreasing.
27. 28.
29. 30.
31. 32.
33–36
■ The graph of a function is given.
(a) Find all the local maximum and minimum values of the function and the value of x
at which each occurs.
(b) Find the intervals on which the function is increasing and on which the function is
decreasing.
33. 34.
35. 36.
37–40
■ A function is given. Use a graphing calculator to draw a graph of the function.
(a) Find all the local maximum and minimum values of the function and the value of x
at which each occurs. State each answer correct to two decimals.
(b) Find the intervals on which the function is increasing and on which the function is
decreasing. State each answer correct to two decimal places.
37. 38.
39. 40. G 1x 2= x 2x - x
2
F 1x 2= x 16 - x
g1x 2= 3 + x + x
2
- x
3
f 1x 2= x
3
- x
f 1x 2= x
4
- 4x
3
+ 2x
2
+ 4x - 3f 1x 2= x
3
+ 2x
2
- x - 2
f 1x 2= x
4
- 16x
2
f 1x 2= 2x
3
- 3x
2
- 12x
f 1x 2= x
3
- 4xf 1x 2= x
2
- 5x
0
x
y
1
1
x
y
1
1
x
y
1
1
0
x
y
1
1
0
x
y
1
1
x
y
1
1
SECTION 1.7
■
Working with Functions: Getting Information from the Graph 85
CONTEXTS
P (MW)
0
Source: Pacific Gas & Electric.
181512963
t (h)
21
400
600
800
200
41. Power Consumption The figure shows the power consumption in San Francisco for
September 19, 1996. (P is measured in megawatts; t is measured in hours starting at
midnight.)
(a) What was the power consumption at 6:00
A.M.? At 6:00 P.M.?
(b) When was the power consumption a maximum?
(c) When was the power consumption a minimum?
(d) What is the net change in the values of P as the value of x changes from 0 to 12?
Source: California Department of Mines and Geology.
a (cm/s
2
)
5
50
−50
10 15 20 25
t (s)
100
30
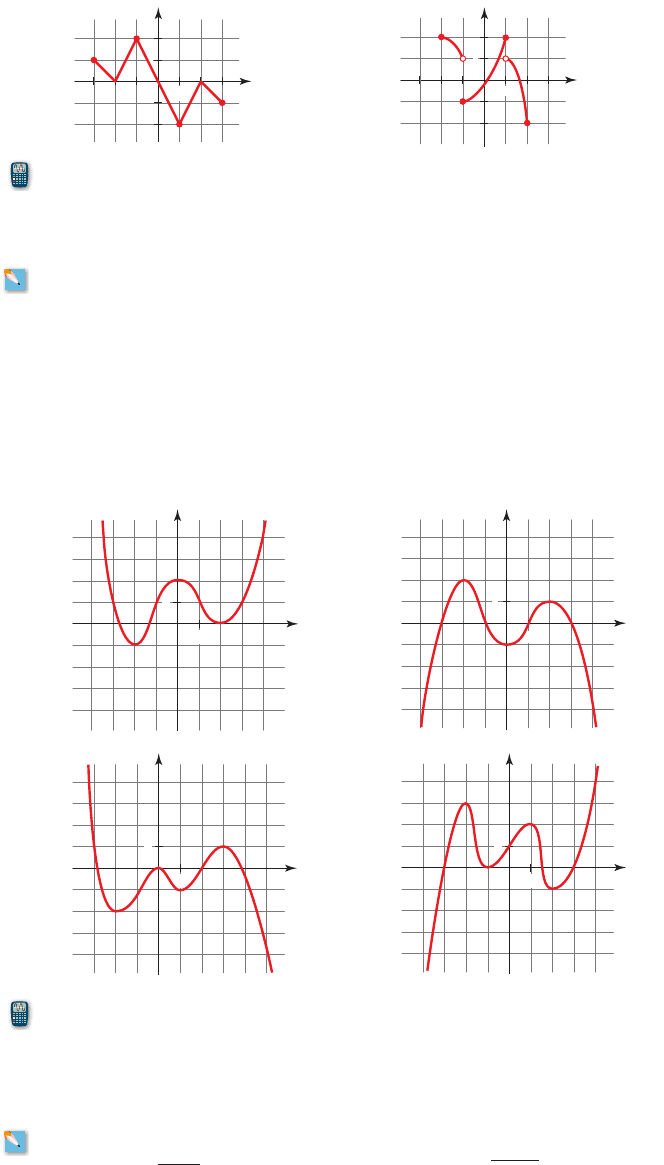
42. Earthquake The graph shows the vertical acceleration of the ground from the 1994
Northridge earthquake in Los Angeles, as measured by a seismograph. (Here t
represents the time in seconds.)
(a) At what time t did the earthquake first make noticeable movements of the earth?
(b) At what time t did the earthquake seem to end?
(c) At what time t was the maximum intensity of the earthquake reached?
(d) What is the approximate net change in the intensity of the earthquake as the value
of t changes from 5 to 30?
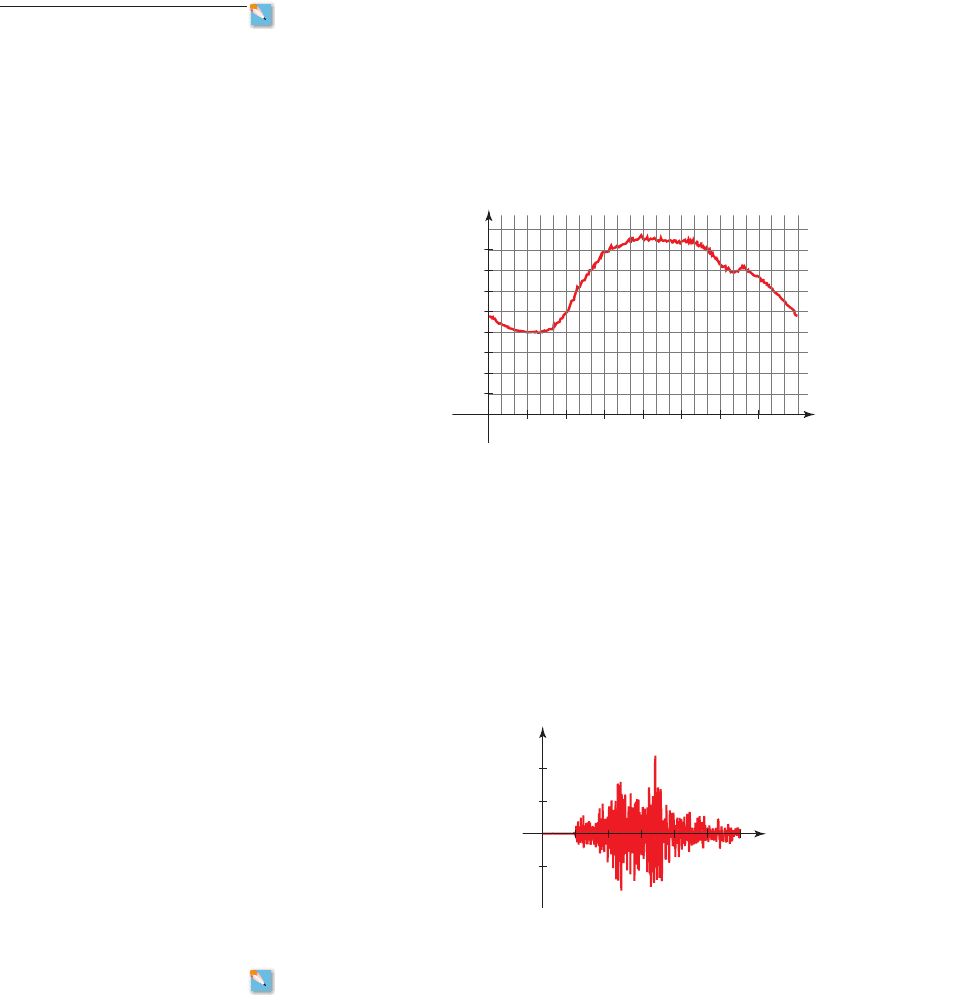
43. Low Temperatures In January 2007 the state of California experienced remarkably
cold weather. Many crops that usually thrive in California were lost because of the frost.
Orange crops just ripening in Tulare County, California, were frozen on the trees. The
table and graph on the next page show the daily low temperatures T in Tulare County
for the month of January 2007.
(a) Find and .
(b) Which is larger, ?
(c) On what day(s) was the daily low temperature below 32°F? On what day was it the
lowest?
(d) Find the net change in the daily low temperatures from January 1 to January 31.
T 115 2 or T 119 2
T 115 2T 112
44. Population of Philadelphia The table and graph below show the history of the
population P of the city of Philadelphia from 1790 to 2000.
(a) Find and .
(b) Which is larger, or ?
(c) In what year did Philadelphia have its largest population? In what year(s) did
Philadelphia have a population over 1.8 million?
(d) Find the net change in the population of Philadelphia from 1950 to 2000.
P 1210 2P 11602
P12002P 11002
45. Weight Function The graph gives the weight W of a person at age x.
(a) Determine the intervals on which the function W is increasing and on which it is
decreasing.
(b) What do you think happened when this person was 30 years old?
Years
since 1790
Population
(ⴛ 10,000)
0 2.85
10 4.12
20 5.37
30 6.38
40 8.05
50 9.37
60 12.14
70 56.55
80 67.40
90 84.72
100 104.70
Years
since 1790
Population
(ⴛ 10,000)
110 129.37
120 154.90
130 182.34
140 195.10
150 193.13
160 207.16
170 200.25
180 194.86
190 168.82
200 158.56
210 151.76
150
200
50
100
50 100 150 200
Years since 1790
0
Population
(⫻ 10,000)
x
W
0
50
100
Weight
(lb)
150
200
10 20 30 40 50 60 70
Age (yr)
86 CHAPTER 1
■
Data, Functions, and Models
30
40
50
20
10 20 30
Day
0
*F
Day
Daily low
temperature
(°F)
1 32
2 30
3 32
4 35
5 33
6 28
7 28
8 28
9 28
10 30
11 33
Day
Daily low
temperature
(°F)
12 24
13 23
14 21
15 20
16 23
17 26
18 26
19 24
20 26
21 28
22 26
Day
Daily low
temperature
(°F)
23 28
24 28
25 30
26 32
27 33
28 46
29 37
30 39
31 39
SECTION 1.7
■
Working with Functions: Getting Information from the Graph 87
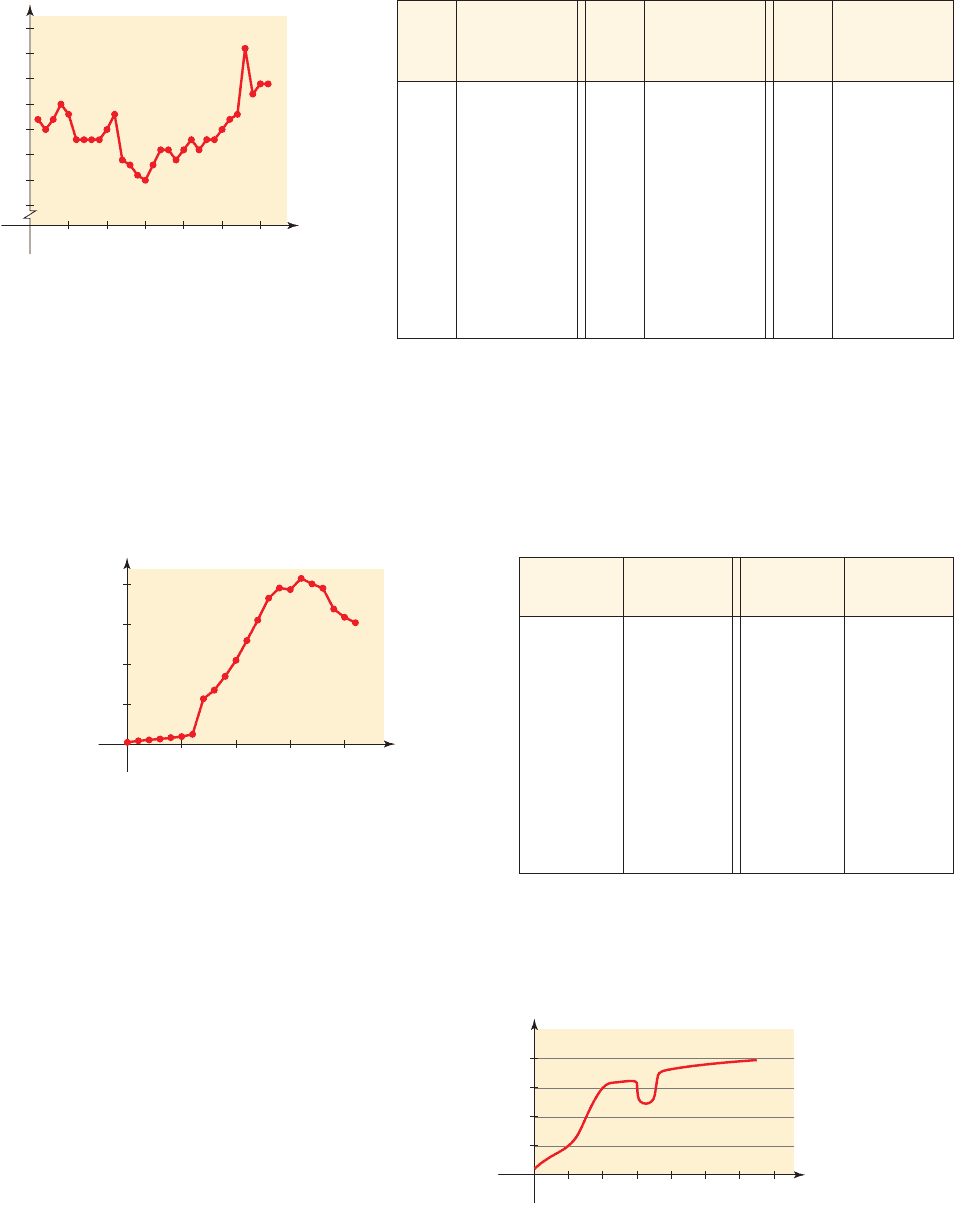
46. Distance Function The graph gives a sales representative’s distance from his home
as a function of time on a certain day.
(a) Determine the time intervals on which his distance from home was increasing and
on which it was decreasing.
(b) Describe in words what the graph indicates about his travels on this day.
x
y
Distance
from home
(mi)
8:00
A.M. 6:00 P.M.10:00 NOON 2:00 4:00
Time
(
h
)
47. Running Race Two runners compete in a 100-meter race. The graph in the margin
depicts the distance run as a function of time for each runner.
(a) Did each runner finish the race? Who won the race?
(b) At what time did one runner overtake the other?
(c) On what time interval was Runner A leading?
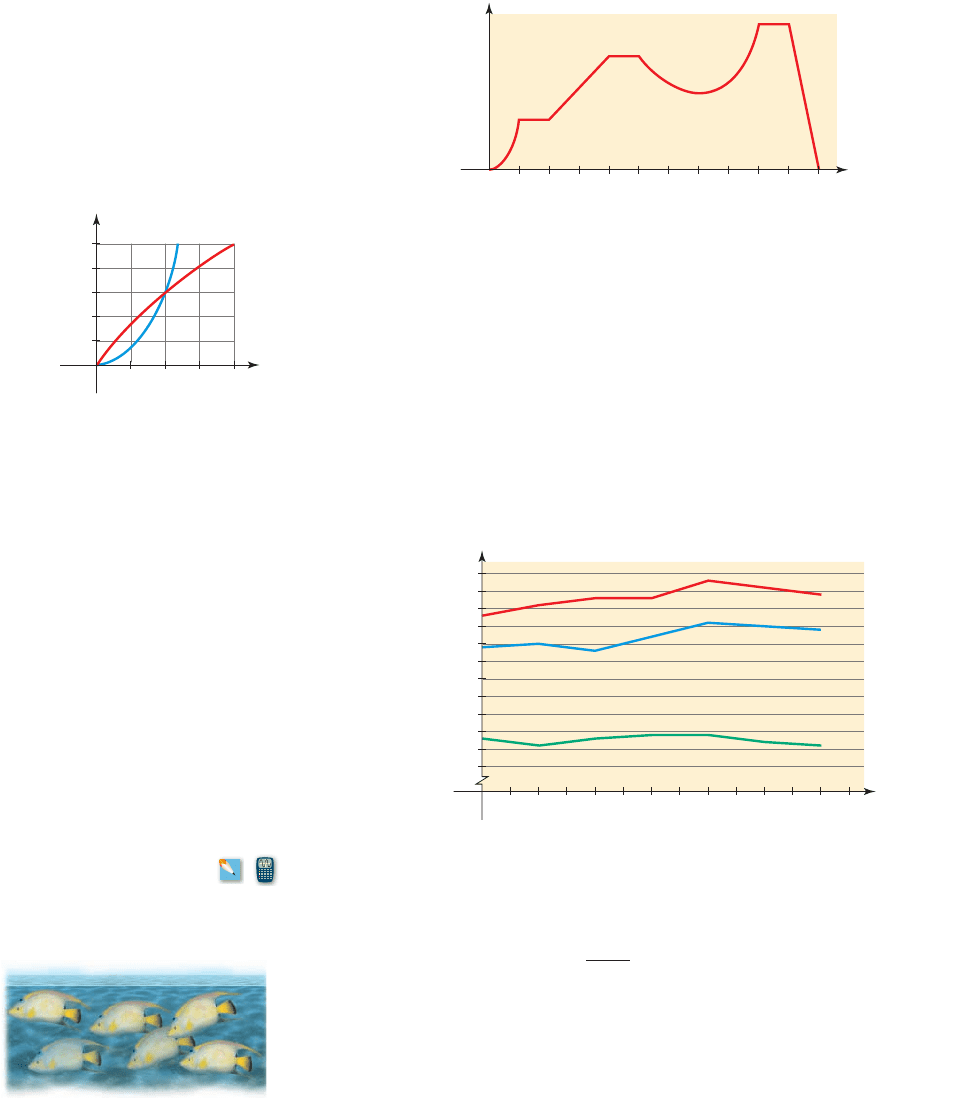
48. Education and Income The graph shows the yearly median income H for Americans
with a high school diploma, the yearly median income B of Americans with a bachelor’s
degree, and the yearly median income M of Americans with a master’s degree, all in the
time period 1991 to 2003 (with corresponding to 1991).
(a) Find the interval on which all three functions are decreasing.
(b) Find the net change of each function from 1995 to 1999. Which function had the
most net change in this time period?
x = 0
0
100
5
A
B
t (s)
y (m)
Distance
Time
30
40
50
60
70
80
123456789101112
Year
M
B
H
0
13
Income
(⫻ $1000)
x
y
49. Migrating Fish Suppose a fish swims at a speed relative to the water, against a
current of 5 mi/h. Using a mathematical model of energy expenditure, it can be shown
that the total energy E required to swim a distance of 10 mi is given by
Biologists believe that migrating fish try to minimize the total energy required to swim
a fixed distance.
(a) Graph the function E in the viewing rectangle [5.1, 10] by [4000, 13,000].
(b) Where is the function E increasing and where is the function E decreasing?
E 1√2= 2.73√
3
10
√ - 5
5.1 … √ … 10
√
0.2
0.1
Alcohol
consumption
(mg/mL)
0.5 1.0 1.5 2.0 2.5 3.0
Time (h)
x
y
88 CHAPTER 1
■
Data, Functions, and Models
(c) Find the local minimum value of E. For what velocity is the energy E minimized?
[Note: This result has been verified; migrating fish swim against a current at a speed
50% greater than the speed of the current.]
50. Coughing When a foreign object that is lodged in the trachea (windpipe) forces a
person to cough, the diaphragm thrusts upward, causing an increase in pressure in the
lungs. At the same time, the trachea contracts, causing the expelled air to move faster
and increasing the pressure on the foreign object. According to a mathematical model of
coughing, the velocity of the air stream through an average-sized person’s trachea is
related to the radius r of the trachea (in centimeters) by the function
(a) Graph the function .
(b) Where is the function increasing and where is the function decreasing?
(c) What is the local maximum value of and at what value of r does the local
maximum occur?
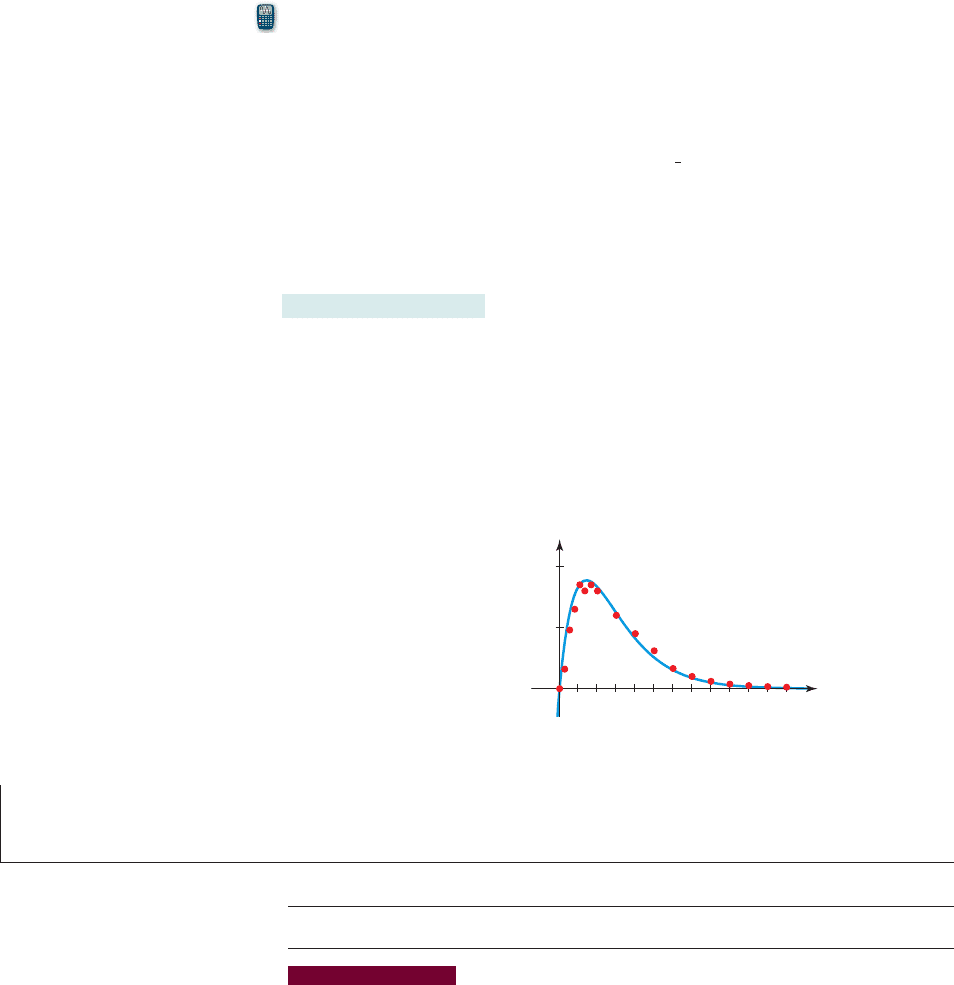
51. Algebra and Alcohol The first two columns of the table in the Prologue (page P2)
give the alcohol concentration at different times in a three-hour interval following the
consumption of 15 mL of alcohol. The data are modeled by the function A, which is
graphed below together with a scatter plot of the data. (In Chapter 5 we learn how to
find an algebraic expression for the function A.)
(a) Use the graph of A to determine at what time the alcohol concentration is at its
maximum level.
(b) On what time interval is the alcohol concentration increasing?
(c) On what time interval is the alcohol concentration decreasing?
√
√√
√
√ 1r 2= 3.211 - r2r
2
1
2
… r … 1
√
√
1.8 Working with Functions:
Modeling Real-World Relationships
■
Modeling with Functions
■
Getting Information from the Graph of a Model
IN THIS SECTION... we make real-world models, not from data but from a verbal
description. This includes models for cost, revenue, or depletion of resources and models
that depend on some geometrical property. Once a model has been found, we use it to get
information about the thing being modeled.
In Section 1.3 we learned how to find equations that model real-world data. In
Sections 1.5–1.7 we used functions to model the dependence of one changing quan-
tity on another. In this section we explore the process of making a model from a ver-
bal description of a real-world situation.

SECTION 1.8
■
Working with Functions: Modeling Real-World Relationships 89
Recall that a model is a mathematical representation (such as an equation or a
function) of a real-world situation. Modeling is the process of making mathematical
models. Why make a mathematical model? Because we can use the model to answer
questions and make predictions about the thing being modeled. The process is de-
scribed in the following diagram.
2
■ Modeling with Functions
We observed in Section 1.3 that many real-world situations can be described by lin-
ear models. It is useful to express a linear model in function form; this helps us to
obtain information more easily from the model. We begin by creating a linear model
for a situation that is described verbally.
example
1
A Model for Cost
A company manufactures baseball caps with school logos. The company charges their
customers a fixed fee of $500 for setting up the machines and $8 for each cap produced.
(a) Find a linear model for the cost of purchasing any number of caps from this
company. Express the model in function form.
(b) Use the model to find the cost of purchasing 225 caps.
Solution
(a) To find a linear model, we need to assign letters to the quantities involved. Let
n represent the number of caps to be purchased. The model we want is a
function C that gives the cost of purchasing n caps. From the information
given, we can write
We put this model in function form:
(b) To find the cost of purchasing 225 caps, we need to find C(225):
Model
Replace n by 225
Calculator
The cost is $2300.
■ NOW TRY EXERCISE 17 ■
= 2300
C12252= 500 + 812252
C1n2= 500 + 8n
C 1n2= 500 + 8n
C = 500 + 8n
ModelReal world
Making a model
Usin
g
the model
Fixed cost Add $8 for each cap
r
r

IN CONTEXT ➤
90 CHAPTER 1
■
Data, Functions, and Models
The state of the environment has played an important role in the rise and fall of
civilizations throughout history. For example, deforestation is thought to have played
a significant role in the decline of the once-flourishing Easter Island culture in the
South Pacific. The decline of the world’s rain forests is a controversial topic fre-
quently discussed in the news. Fortunately, wise forest management practices are
now common in many parts of the world, promising a healthier environment for gen-
erations to come. The next example illustrates the impact that paper usage has on our
forests.
example
2
A Function Model for Paper Consumption
The average U.S. resident uses 650 lb of paper a year. The average pine tree produces
4130 lb of paper.
(a) Find a function N that models the number of trees used for paper in one year
by x U.S. residents.
(b) The city of Cleveland Heights, Ohio, had a population of about 49,000 in
2003. Use the model to find the number of trees required to make the paper
used by the residents of Cleveland Heights in 2003.
Solution
(a) Since each resident uses an average of 650 lb of paper a year and each tree
produces 4130 lb of paper, the number of trees each person uses per year is
So each resident uses about 0.157 tree per year. Thus, x residents use 0.157x tree
per year.
The model we want is a function N that gives the number of trees used by
x residents. We can now describe this function as follows:
Model
N1x 2= 0.157x
L 0.157 tree
=
650 lb
4130 lb
trees used by each resident =
amount of paper used by each resident 1lb 2
amount of paper each tree produces 1lb
Deforested Easter IslandLong-leaf pine forest
James Thew/Shutterstock.com 2009
Vladimir Korostyshevskiy/Shutterstock.com
/tree)
/tree)

SECTION 1.8
■
Working with Functions: Modeling Real-World Relationships 91
(b) For Cleveland Heights the number of residents x is 49,000. Using the model,
we have
Model
Replace x by 49,000
Calculator
So the Cleveland Heights residents used about 7693 trees in 2003.
■ NOW TRY EXERCISE 19 ■
= 7693
N149,0002= 0.157149,0002
N1x2= 0.157x
example
3
Irrigating a Garden
A gardener waters his vegetable plot using a drip irrigation system. Water flows
slowly from a 1200-gallon tank through a perforated hose network to keep the soil
appropriately moist. During the spring planting season, the garden requires 80 gal-
lons of water per day.
(a) Find a function W that gives the amount of water in the tank x days after it has
been filled.
(b) Use the function W to find the water remaining in the tank after 3 days and
after 12 days.
(c) Calculate W(20). What does your answer tell you?
(d) How many days will it take for the tank to empty?
(e) The gardener prefers not to let the tank empty completely. Instead, he decides
to refill it when the level has dropped to 200 gallons. How many days will it
take for the water level to drop to this level?
Thinking About the Problem
Let’s try a simple case. If the garden has been watered for 10 days after the
tank has been filled, how much water is left in the tank? Since the garden re-
quires 80 gal of water per day, the number of gallons used in 10 days is
/
So the number of gallons left in the tank is
/
So the amount left in the tank is the number of gallons in a full tank minus the
amount of water used per day times the number of days since the tank was
filled.
Solution
(a) We need to find the rule W that takes the input x (the number of days since the
tank was filled) and gives as output the number of gallons of water W(x)
remaining in the tank. We know that the gardener starts out with 1200 gallons
and uses 80 gallons per day, so we must subtract the total water usage after
x days from the initial amount in the tank to find the number of gallons left in
the tank. Let’s express these quantities in symbols.
day2110 days2= 1200 - 800 = 400 gal1200 gal - 180 gal
day2110 days2= 800 gal180 gal

In Words In Algebra
Days since fill-up x
Gallons used each day 80
Gallons used since fill-up 80x
Gallons left in tank
1200 - 80x
So the function W that models the amount of water left in the tank is
Model
(b) To find the water level in the tank after 3 days and after 12 days, we evaluate
the function W at 3 and at 12:
Replace x by 3
Replace x by 12
So the water level after 3 days is 960 gal, and after 12 days is 240 gal.
(c) When x has value 20, the value of the function W is
Replace x by 20
We get a negative value for W(20). It is impossible for the tank to contain a neg-
ative amount of water, so this must mean that the gardener would run out of wa-
ter before 20 days have passed.
(d) An empty tank means that the water level has dropped to zero; that is,
.
Model
Replace W(x) by 0 and switch sides
Add 80x to each side
Divide by 80 and switch sides
Calculator
The tank will empty after 15 days.
(e) We need to find how many days x it takes for the water level W(x) to drop to
200.
Model
Replace W(x) by 200 and switch sides
Subtract 200 from each side
Add 80x to each side
Divide by 80, switch sides
Calculator
The gardener needs to refill the tank every days.
■ NOW TRY EXERCISE 21 ■
12
1
2
x = 12.5
x =
1000
80
1000 = 80x
1000 - 80x = 0
1200 - 80x = 200
W1x2= 1200 - 80x
x = 15
x =
1200
80
1200 = 80x
1200 - 80x = 0
W1x2= 1200 - 80x
W1x 2= 0
W1202= 1200 - 801202=-400
W1122= 1200 - 801122= 240
W132= 1200 - 80132= 960
W1x 2= 1200 - 80x
92 CHAPTER 1
■
Data, Functions, and Models
Solving equations is reviewed in
Algebra Toolkit C.1, page T47.

SECTION 1.8
■
Working with Functions: Modeling Real-World Relationships 93
2
■ Getting Information from the Graph of a Model
We now model real-world phenomena by a function, then use the graph of the func-
tion to get information about the thing being modeled.
example
4
Modeling the Volume of a Box
A breakfast cereal company manufactures boxes to package their product. For aes-
thetic reasons, the box must have the following proportions: Its width is 3 times its
depth, and its height is 5 times its depth.
(a) Find a function that models the volume of the box in terms of its depth, and
graph the function.
(b) Find the volume of the box if the depth is 1.5 in.
(c) For what depth is the volume 90 ?
(d) For what depth is the volume greater than 60 ?
Thinking About the Problem
Let’s experiment with the problem. If the depth is 1 in., then the width is 3 in.
and the height is 5 in. So in this case the volume is .
The table gives other values. Notice that all the boxes have the same shape, and
the greater the depth, the greater the volume.
V = 1 * 3 * 5 = 15 in
3
in
3
in
3
Depth Volume
1
1 * 3 * 5 = 15
2
2 * 6 * 10 = 120
3
3 * 9 * 15 = 405
4
4 * 12 * 20 = 960
3x
5x
x
Solution
(a) To find the function that models the volume of the box, we first recall the
formula for the volume of a rectangular box.
There are three varying quantities: depth, width, and height. Because the func-
tion we want depends on the depth, we let
Then we express the other dimensions of the box in terms of x.
x = depth of the box
volume = depth * width * height
In Words In Algebra
Depth x
Width 3x
Height 5x