Stewart J. College Algebra: Concepts and Contexts
Подождите немного. Документ загружается.

24 CHAPTER 1
■
Data, Functions, and Models
Year
Median income
of men (ⴛ $1000)
Median income
of women (ⴛ $1000)
1965 28.599 9.533
1975 33.148 12.697
1985 42.847 27.720
1995 39.186 27.990
2005 41.386 31.858
44. Health Care Coverage The table shows the percentage of U.S. residents that were
unemployed and the percentage that did not have health insurance from 1999 to 2004.
(a) On the same graph, make a scatter plot of the yearly percentages of unemployed
and the yearly percentages of uninsured Americans.
(b) In what year(s) did the percentage of uninsured Americans go up while
unemployment went down?
(c) Describe any trends you detect from the graph in part (a).
Year
Percentage
unemployed
Percentage with no
health insurance
1999 4.2 13.1
2000 4.0 13.3
2001 4.7 14.0
2002 5.8 14.7
2003 6.0 15.2
2004 5.5 15.3
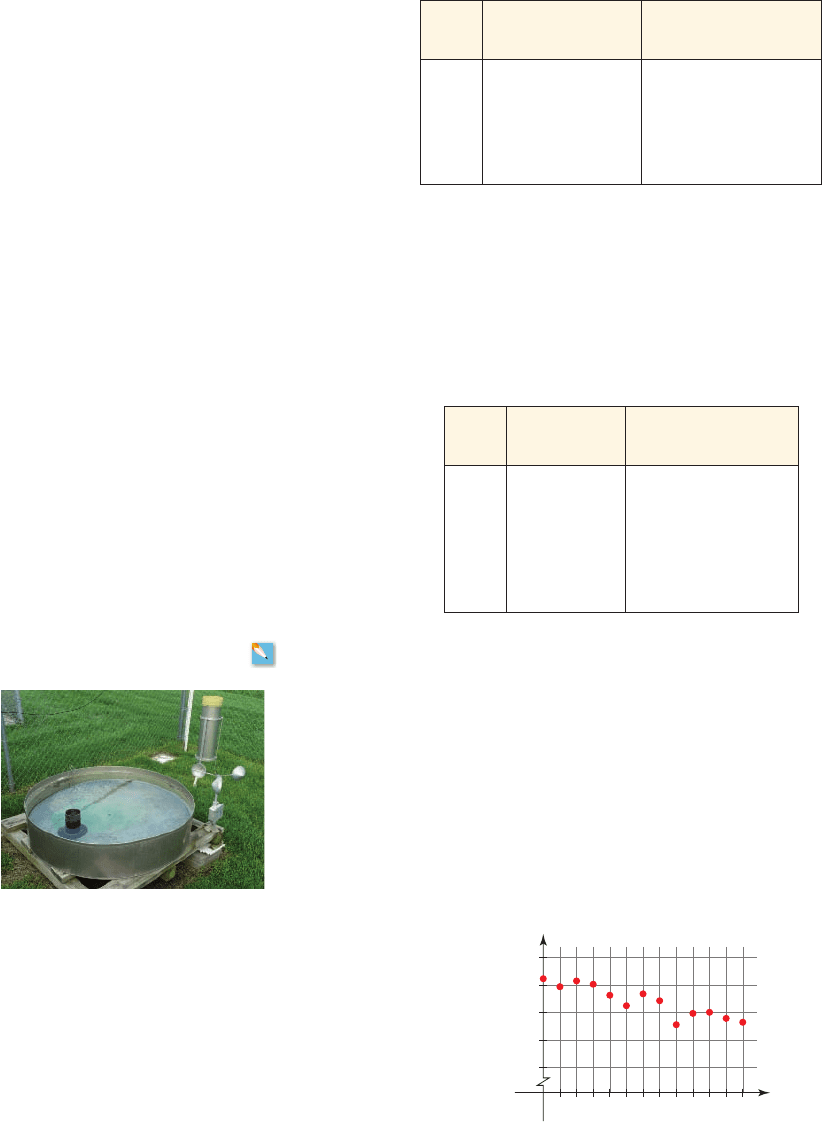
45. Pan Evaporation and Climate Change For decades, water evaporation rates have
been measured worldwide by using a system called pan evaporation. Pan evaporation is
the measurement of the amount of water that evaporates from a standard pan in a given
period of time. Historically (and still today), pan evaporation data were used in planning
irrigation schedules for crops. The availability of long-term pan evaporation data makes
it possible to detect global climate trends. The following graph plots the yearly pan
evaporation (in./year) for Fresno, California, from 1940 to 2000.
(a) What was the pan evaporation in 1940?
(b) What year had a pan evaporation of 65 inches?
(c) What years had a pan evaporation above 80 inches?
(d) What trend do you detect in your graph?
80
90
60
50
70
2010 40
Years since 1940
50 6030
0
x
y
(in./yr)
NOAA
(b) In what year did the median income of men go down and the median income of
women go up?
(c) Describe any trends you detect from the graphs.
SECTION 1.3
■
Equations: Describing Relationships in Data 25
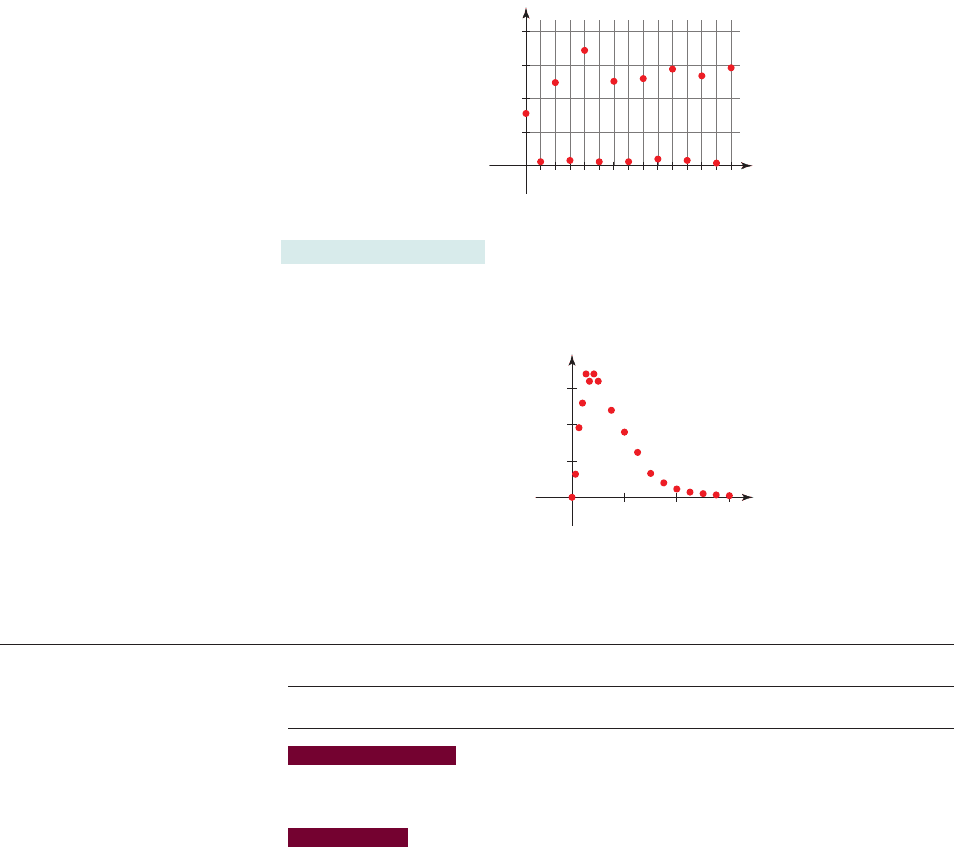
46. Wintering Habits of the Common Redpoll The common redpoll is one of those
species of birds that shift from their typical winter region when there is a lack of food in
their wintering grounds. They “irrupt” from their normal winter habitat in Canada into
areas where food is more plentiful; their irruptions range as far south as the Middle
Atlantic states. The graph below shows the percentage of feeders visited by common
redpolls in the Mid-Atlantic states in the years between 1990 and 2005.
(a) What percentage of feeders was visited in 2002?
(b) In what year(s) were over 75% of the feeders visited?
(c) In what years did the common redpoll irrupt from its wintering grounds?
(d) Do you detect a trend in the common redpoll wintering habits? If so, describe the
trend.
100
50
428
Years since 1990
10 12 146
0
x
y
47. Algebra and Alcohol A scatter plot of the data in the Prologue (page P2) for the
average concentration of alcohol in an individual after a 15-mL dose is shown in the
graph. What pattern or trend do you see in these data? Compare with your answer to
Exercise 31 of Section 1.1.
0.15
0.10
0.05
y
(mg/mL)
13
Time
(
h
)
2
0
x
2
1.3 Equations: Describing Relationships in Data
■
Making a Linear Model from Data
■
Getting Information from a Linear Model
IN THIS SECTION… we learn how to model data by an equation and how the equation
allows us to predict data points whose input is outside the domain of our data. This begins
our study of modeling—a theme that we encounter throughout this book.
GET READY… by reviewing how to graph two-variable equations in Algebra Toolkit
D.2. Test your graphing skills by doing the Algebra Checkpoint at the end of this section.
In the preceding sections we described patterns in data using words or graphs. If we
use letters to represent the variables, we can sometimes find an equation that de-
scribes or “models” the data precisely.
26 CHAPTER 1
■
Data, Functions, and Models
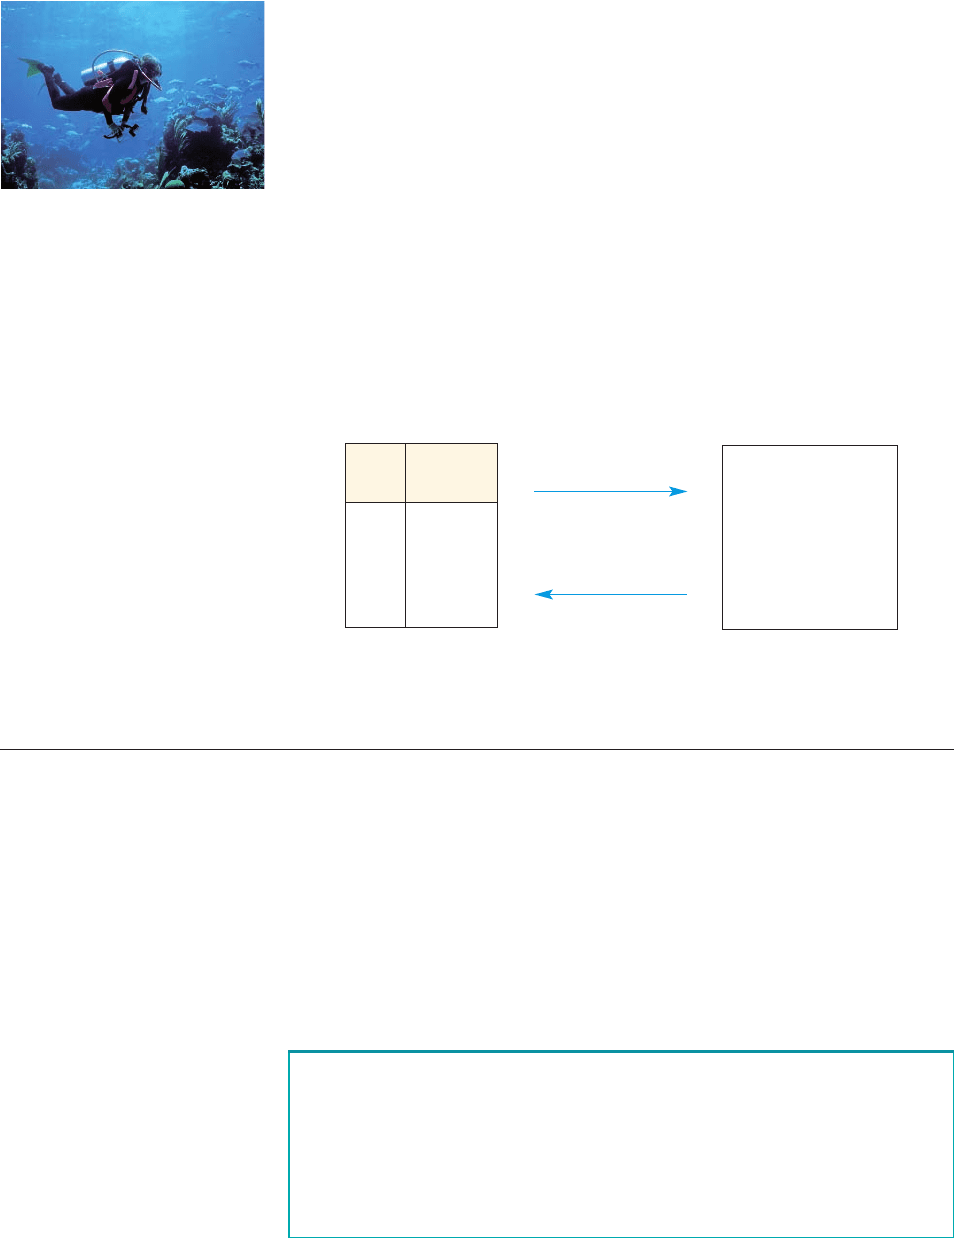
For example, an ocean diver observes that the deeper she dives, the higher the
water pressure—she can feel the water pressing on her ears. How deep can she dive
before the pressure becomes dangerously high? To answer this question, she must be
able to predict what the pressure is at different depths without having to endanger
her life by diving to these depths. So she begins by diving to safe depths and mea-
suring the water pressure. The data she obtains help her find a model (or equation)
that she can use to predict the pressure at depths to which she cannot possibly dive.
This situation is summarized as follows.
■
The data give the water pressure at different depths.
■
The model is an equation that represents the data.
■
Our goal is to use the model to predict the pressure at depths that are not in
the data.
The pressure-depth data and model are given below. Note that the single equation
contains all the data and more. For instance, we can use this equa-
tion to predict the pressure at a depth of 200 ft, a value that is not available from the data.
P = 14.7 + 0.45d
Depth
(ft)
Pressure
(lb/in
2
)
0 14.7
10 19.2
20 23.7
30 28.2
200 ?
Data Model
In this section we learn how to make such models for data. The depth-pressure model
is obtained in Example 3.
P = 14.7 + 0.45d
2
■ Making a Linear Model from Data
A model is a mathematical representation (such as an equation) of a real-world sit-
uation. Modeling is the process of finding mathematical models. Once a model is
found, it can be used to answer questions about the thing being modeled.
Many real-world data start with an initial value for the output variable, and then
a fixed amount is added to the output variable for each unit increase in the input vari-
able. For example, the production cost for manufacturing a certain number of cars con-
sists of an initial fixed cost for setting up the equipment plus an additional unit cost for
manufacturing each car. In these cases we use a linear model to describe the data.
A linear model is an equation of the form . In this model, A is the
initial value of y, that is, the value of y when x is zero, and B is the constant
amount by which y changes (increases or decreases) for each unit increase in x.
y = A + Bx
y = A + Bx
Initial value Add B for each
of y unit change in x
r
r
Linear equations are studied in more
detail in Section 2.2.
Linear Models
Dennis Sabo/Shutterstock.com 2009
Making a model
Using the model

SECTION 1.3
■
Equations: Describing Relationships in Data 27
In the next three examples we find some linear models from data.
example
1
Data, Equation, Graph
x
(chairs)
C
(dollars)
0 80
1 92
2 104
3 116
4 128
table 1
A furniture maker collects the data in Table 1, giving his cost C of producing x chairs.
(a) Find a linear model for the cost C of making x chairs.
(b) Draw a graph of the equation you found in part (a).
(c) What does the shape of the graph tell us about his cost of making chairs?
Solution
(a) The initial cost (the cost of producing zero chairs) is $80. We can see from the
table that each chair produced costs an additional $12. That is, the unit cost is
$12. So an equation that models the relationship between C and x is
To check that this equation correctly models the data, let’s try
some values for x. If four chairs are produced, then we can use the equation to
calculate the cost.
Model
Replace x by 4
Calculate
This matches the cost given in the table for making four chairs. You can check
that the other values in the table also satisfy this equation.
(b) The ordered pairs in the table are solutions of the equation, so we plot them in
Figure 1(a). We can see that the points lie on a straight line, so we complete
the graph of the equation by drawing the line containing the plotted points as
in Figure 1(b).
= 128
C = 80 + 12142
C = 80 + 12x
✓ CHECK
C = 80 + 12x
Initial cost Add $12 for each
(or fixed cost) chair produced
r
r
Graphing equations is reviewed
in Algebra Toolkit D.2, page T71.
150
140
130
120
110
100
90
80
2143
(
a
)
Gra
p
h from table
65
0
x
150
140
130
120
110
100
90
80
C
2143
(
b
)
Gra
p
h of e
q
uation
65
0
x
C
figure 1
(c) From the graph, it appears that cost increases steadily as the number of chairs
produced increases.
■ NOW TRY EXERCISES 7 AND 19 ■
28 CHAPTER 1
■
Data, Functions, and Models
For data with evenly spaced inputs:
■
The first differences are the differences in successive outputs.
■
If the first differences are constant, then there is a linear model for
the data.
The next example illustrates how we make and use a first difference table.
How can we tell whether a given set of data has a linear model? Let’s consider
data sets whose inputs are evenly spaced. For instance, the inputs in
Example 1 are evenly spaced—successive inputs are one unit apart. For data with
evenly spaced inputs, there is a linear model for the data if the outputs increase (or
decrease) by a constant amount between successive inputs. We can test whether data
satisfy this condition by making a table of first differences. Each entry in the first
difference column of the table is the difference between an output and the immedi-
ately preceding output.
First Differences
0, 1, 2, 3, . . .
example
2
A Model for Temperature and Elevation
A mountain climber knows that the higher the elevation, the colder is the tempera-
ture. Table 2 gives data on the temperature at different elevations above ground level
on a certain day, gathered by using weather balloons.
(a) Show that a linear model is appropriate for these data.
(b) Find a linear model for the relationship between temperature and elevation.
(c) Draw a graph of the equation you found in part (b).
Solution
(a) We first observe that the inputs for these data are evenly spaced. To see
whether a linear model is appropriate, let’s make a table of first differences.
The entries in the first difference column are obtained by subtracting from
each output the preceding output.
- 30 - 1- 202=-10
- 20 - 1- 102=-10
- 10 - 0 =-10
0 - 10 =-10
10 - 20 =-10
Elevation
(km)
Temperature
(°C)
0 20
1 10
2 0
3
- 10
4
- 20
5
- 30
First
difference
—
- 10
- 10
- 10
- 10
- 10
Elevation
(km)
Temperature
(°C)
0 20
1 10
2 0
3
- 10
4
- 20
5
- 30
table 2
We see that the first differences are constant (each is ), so there is a linear
model for these data.
(b) The linear model we seek is an equation of the form
where T represents temperature and h elevation.
T = A + Bh
- 10

SECTION 1.3
■
Equations: Describing Relationships in Data 29
When h is zero (ground level), the temperature is 20°C, so the initial value
A is 20. The first differences are the constant , so the number B in the model
is . We can now express the model as
Notice how this equation fits the data. From the data we see that for each 1-km
increase in elevation, the temperature decreases by 10°C. So at an elevation of
h km we must subtract 10h degrees from the ground temperature.
To check that this equation correctly models the data, we try
some values for h from the table. For example, if the elevation is 5 km, we re-
place h by 5 in the model:
Model
Replace h by 5
Calculate
This matches the temperature given in the table for an elevation of 5 km. You
can check that the other values in the table also satisfy this equation.
(c) We plot the points in the table and then complete the graph by drawing the
line that contains the plotted points. (See Figure 2.)
■ NOW TRY EXERCISES 11 AND 21 ■
T =-30
T = 20 - 10152
T = 20 - 10h
✓ CHECK
T = 20 - 10h
- 10
- 10
Temperature Subtract 10 for each
at elevation 0 kilometer of elevation
r
r
20
10
_10
_20
_30
_40
214365
0
h
T
figure 2
Graph of T = 20 - 10h
example
3
A Model for Depth-Pressure Data
A scuba diver obtains the depth-pressure data shown in Table 3.
(a) Show that a linear model is appropriate for these data.
(b) Find a linear model that describes the relationship between depth and pressure.
Solution
(a) The inputs for these data are evenly spaced. We make a table of first differences.
Depth
(ft)
Pressure
(lb/in
2
)
First
differences
0 14.7 —
10 19.2 4.5
20 23.7 4.5
30 28.2 4.5
40 32.7 4.5
50 37.2 4.5
table 3
Depth
(ft)
Pressure
(lb/in
2
)
0 14.7
10 19.2
20 23.7
30 28.2
40 32.7
50 37.2
We see that the first differences are constant (each is 4.5), so there is a linear
model for these data.
(b) The linear model we seek is an equation of the form
where P represents pressure and d represents depth.
P = A + Bd

30 CHAPTER 1
■
Data, Functions, and Models
2
■ Getting Information from a Linear Model
The point of making a model is to use it to predict conditions that are not directly ob-
served in our data.
In the next example we use the depth-pressure model of Example 3 to find the
pressure at depths to which no human can dive unaided. This illustrates the power of
the modeling process: It allows us to explore properties of the real world that are be-
yond our physical experience. In the first-ever attempt to explore the ocean depths,
Otis Barton and William Beebe built a steel sphere (see the photo) with a diameter
of 4 ft 9 in., which they called the bathysphere (bathys is the Greek word for deep).
They needed to build their craft to be strong enough to withstand the crushing water
pressure at the great depths to which they planned to descend. They used the depth-
pressure model to estimate the pressure at those depths and then built the bathy-
sphere accordingly. On August 15, 1934, they successfully descended to a depth of
3028 ft below the surface of the Atlantic. From the bathysphere’s portholes they ob-
served exciting new marine species that had never before been seen by humans.
example
4
Using the Depth-Pressure Model
The bathysphere described above is lowered to the bottom of a deep ocean trench.
Use the depth-pressure model to predict the pressure at a depth
of 3000 ft.
Solution
Since the depth is 3000 ft, we replace d by 3000 in the model and solve for P:
Model
Replace d by 3000
Calculate
So the pressure is lb/in
2
.
■ NOW TRY EXERCISE 25 ■
1364.7
P = 1364.7
P = 14.7 + 0.45130002
P = 14.7 + 0.45d
P = 14.7 + 0.45d
Pressure at Add 0.45 lb/in
2
for
depth 0 each foot of depth
If d is 30, then P = 14.7 + 0.451302= 28.2.
If d is 10, then P = 14.7 + 0.451102= 19.2.
If d is 0, then P = 14.7 + 0.45102= 14.7.
IN CONTEXT ➤
When the depth d is 0, the pressure is 14.7 lb/in
2
, so the initial value A is
14.7. From the first difference column in the table we see that pressure increases
by 4.5 lb/in
2
for each 10-ft increase in depth. So for each 1-ft increase in depth
the pressure increases by
lb/in
2
So the number B in the model is 0.45. We can now express the model as
Let’s check whether this model fits the data. For instance, when
d is 20, we get , which agrees with the table. In the
margin we check the model against other entries in the table.
■ NOW TRY EXERCISE 23 ■
P = 14.7 + 0.451202= 23.7
✓ CHECK
P = 14.7 + 0.45d
4.5
10
= 0.45
© Ralph White/CORBIS
r
r

SECTION 1.3
■
Equations: Describing Relationships in Data 31
x 0 1 2 3 4 5
y 2
x
- 2 - 1
0 1 2 3
y 7
x 0 1 2 3 4 5
y
- 7
x
- 3 - 2 - 1
0 1 2
y 3
1.3 Exercises
CONCEPTS
Fundamentals
1. (a) What is a model? Give some examples of models you use every day.
(b) If you work for $15 an hour, describe the relation between your pay and the number
of hours you work, using (i) a table, (ii) a graph, (iii) an equation.
2. For data with evenly spaced inputs, if the first differences are
_______, then a linear
model is appropriate for the data. In the data shown in the margin, x represents the input
and y represents the output. What are the first differences? Is a linear model appropriate?
3. The equation is a linear model for the total number of legs L that S sheep have.
Using the model, we find that 12 sheep have legs.
4. Suppose digital cable service costs $49 a month with an initial installation fee of $110.
We make a linear model for the total cost C of digital cable service for x months by
writing the equation
______________.
Think About It
5. What is the purpose of making a model? Support your answer by examples.
6. Explain how data, equations, and graphs work together to describe a real-world situation.
Give an example of a real-world situation that can be described in these three ways.
L = 4 *
ⵧ
=
ⵧ
L = 4S
x y First difference
0 45 —
1 39
2 33
3 27
4 21
5 15
Test your skill in graphing equations in two variables. You can review this topic
in
Algebra Toolkit D.2
on page T71.
1. An equation is given. Determine whether the given point (x, y) is a solution
of the equation.
(a) ; (3, 12) (b) ; (2, 3)
(c) ;
2. An equation is given. Determine whether the given point (x, y) is on the
graph of the equation.
(a) ; (b) ; (2, 0)
(c) ;
3. An equation is given. Complete the table and graph the equation.
(a) (b)
(c) (d)
4. Find the x- and y-intercepts of the given equation.
(a) (b) (c) (d)
5. Graph the given equation, and find the x- and y-intercepts.
(a) (b) (c) (d)
3y = 6 - 2xy =-6 + 3xy = 6 + 2xy = 2x
4x - 5y = 82x - 6y = 122y = 3x + 2y = x - 2
y =-3 - 2xy =-7 + 4x
y = 1 - 3xy = 2 + x
1- 1, 32y = 2x
2
+ 1
3y - x =-612, - 12y = 3x - 7
1- 2, 12y = 25 - 3x
3
5x - 2y = 4y = 5x - 3
32 CHAPTER 1
■
Data, Functions, and Models
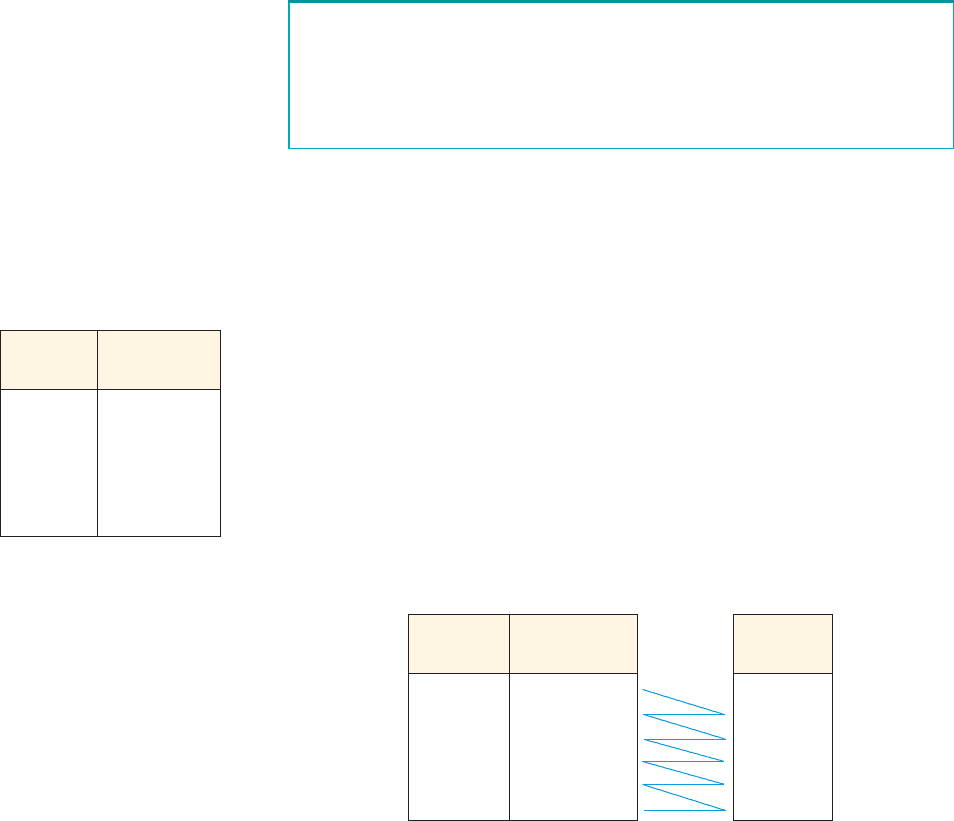
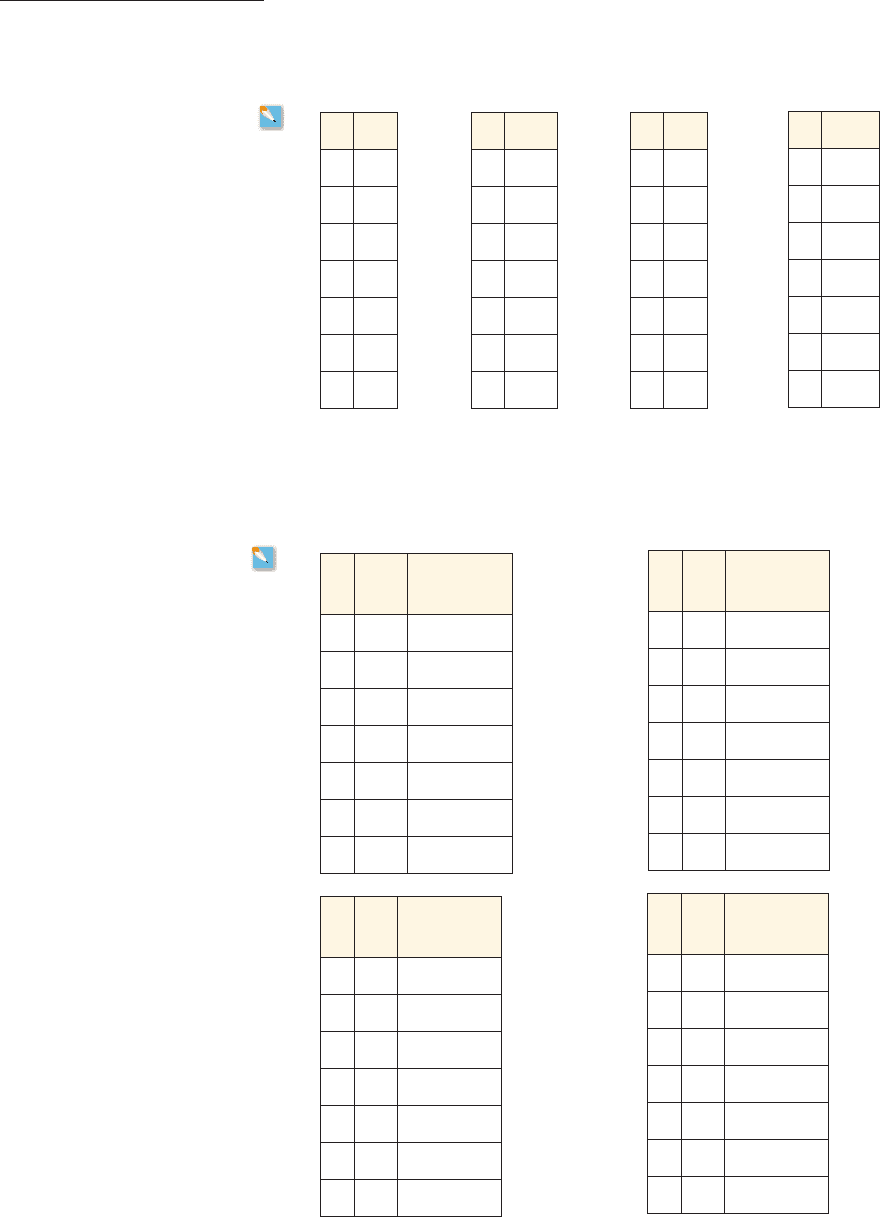
7–10
■ A set of data is given.
(a) Find a linear model for the data.
(b) Use the model to complete the table.
(c) Draw a graph of the model.
7. 8. 9. 10.
A B
0 55
1 52
2 49
3 46
4
5
6
u
v
0 110
1 98
2 86
3 74
4
5
6
x y
0 5
1 12
2 19
3 26
4
5
6
SKILLS
a b
0
- 10
1
- 4
2 2
3 8
4
5
6
11–14 ■ A set of data is given.
(a) Find the first differences.
(b) Is a linear model appropriate? If so, find a linear model for the data.
(c) If there is a linear model, use it to complete the table.
11. 12.
x y
First
difference
0 205
1 218
2 231
3 244
4
5
6
x y
First
difference
0 60
1 54
2 48
3 42
4
5
6
13. 14.
x y
First
difference
0 23
1 19
2 16
3 11
4
5
6
x y
First
difference
0 17
1 38
2 59
3 80
4
5
6
SECTION 1.3
■
Equations: Describing Relationships in Data 33
20
30
10
2143
0
x
y
40
60
80
100
20
2143
0
x
y
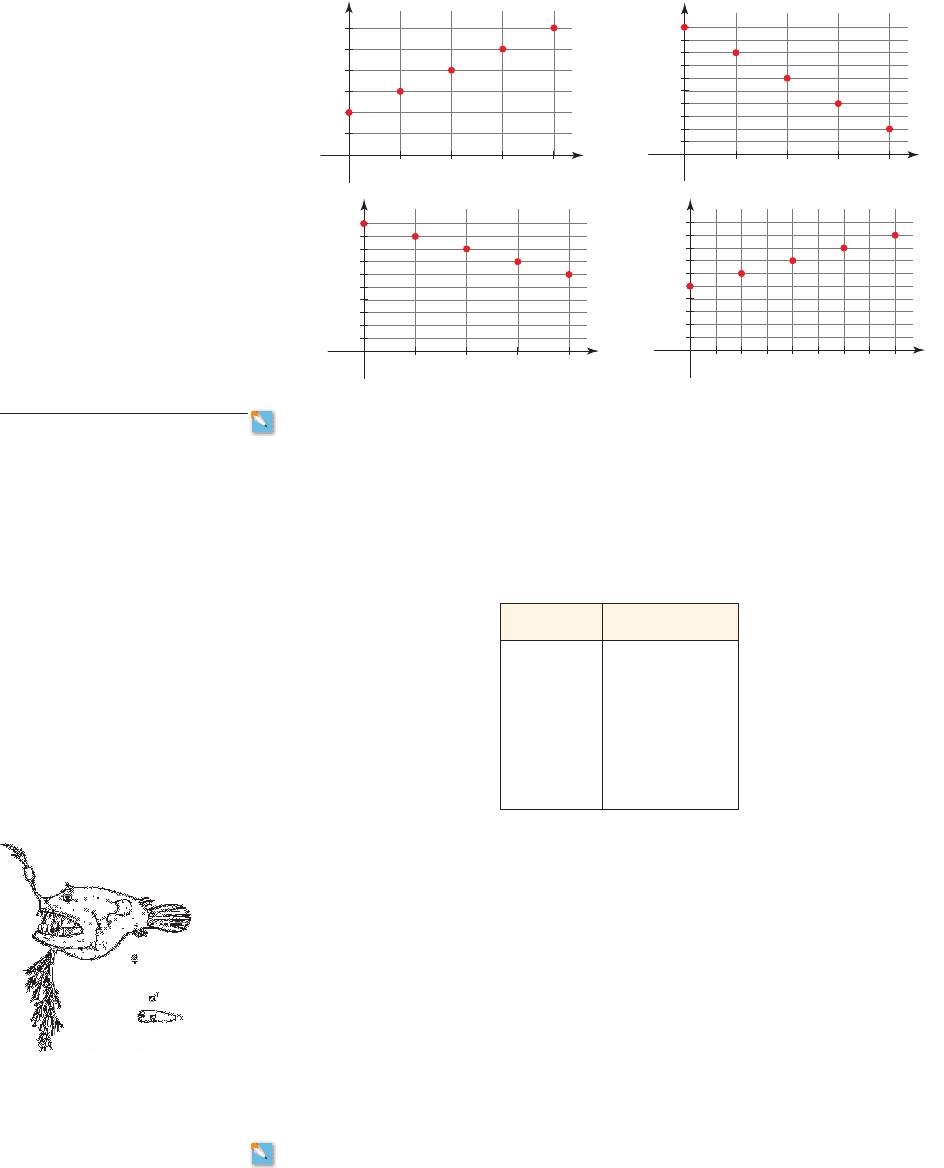
15–18 ■ Find a linear model for the data graphed in the scatter plot.
15. 16.
17. 18.
19. Truck Rental A home improvement store provides short-term truck rentals for their
customers to take large items home. The store charges a base rate of $19 plus a time
charge for every half hour that the truck is used. The table gives rental rate data for
different rental periods.
(a) Find a linear model for the relation between the rental cost and rental period (in hours).
(b) Draw a graph of the equation you found.
(c) Use the model to predict the rental cost for 5 hours.
400
600
800
1000
200
0.20.1 0.40.3
0
x
y
1.00
1.50
2.00
2.50
0.50
2010 40301553525
0
x
y
CONTEXTS
Period (h) Rental cost ($)
0.0 19.00
0.5 24.00
1.0 29.00
1.5 34.00
2.0 39.00
2.5 44.00
3.0 49.00
20. Aquatic Life in the Midnight Zone In Example 6 we used the model
to find the pressure (lb/in
2
) at various ocean depths. The deepest
ocean trenches plunge to an astounding 7 miles below sea level, far too deep for
sunlight to penetrate. Yet our planet is so teeming with life that even at these depths
there are living creatures. Anglerfish can live at depths up to 11,000 ft and are
characterized by luminescent appendages, which they use to lure their prey. The
scientific name of the bizarre-looking anglerfish shown here, linophryne arborifera,
means, roughly, “toad that fishes with a tree-like net.”
(a) Use the model to predict the pressure at the 11,000-ft depth where anglerfish can live.
(b) One atmosphere (atm) is defined as a pressure of 14.7 lb/in
2
, which is the normal
air pressure we experience at sea level. Convert your answer in part (a) to
atmospheres. How many times greater is the pressure under which anglerfish live
than the pressure under which we live?
21. Boiling Point Most high-altitude hikers know that cooking takes longer at higher
elevations. This is because the atmospheric pressure decreases as the elevation increases,
causing water to boil at a lower temperature, and food cooks more slowly at that lower
P = 14.7 + 0.45d
Tony Ayling
Male and female angler fish