Stewart J. College Algebra: Concepts and Contexts
Подождите немного. Документ загружается.


4 CHAPTER 1
■
Data, Functions, and Models
In Example 2 the median seems to be a better indicator of “central tendency”
than the average. This is because one of the incomes in the data is much greater than
all the other incomes. In general, when the data have some “way out” numbers called
outliers, the median is a better measure of central tendency than the average is. For
this reason, for instance, the National Association of Realtors publishes yearly data
on the median price of a home, and not the average price. Some homes are valued at
tens of millions of dollars (like the house on the beach pictured here). It seems hardly
fair to average the price of such a house with that of a typical $250,000 home!
example
3
Median Price of a House
The table gives the selling prices of houses sold in 2007 in a neighborhood of
Austin, Texas.
(a) Find the average selling price of a house in this neighborhood.
(b) Find the median selling price of a house in this neighborhood.
IN CONTEXT ➤
Solution
(a) Since we are finding the average income of five college graduates, we find the
sum of all the incomes and divide by 5.
So the average income of the five graduates is $102,000.
(b) To find the median income, we first order the list of incomes:
Since there are five numbers in this list and the number five is odd, the median
is the middle number 59. So the median income of the five graduates is $59,000.
(c) There are two data points above the median: 62 and 280. There is only one
data point above the average, that is, 280.
(d) We can see from parts (a) and (b) that the average and the median can be very
different. The average income of the five graduates is $102,000, but this is not
the typical income. In fact, not one of the graduates had an income close to
$102,000. However, the median income of $59,000 is a more typical income
for these five graduates. So the median income is a better description of the
central tendency of the incomes in this case.
■ NOW TRY EXERCISE 7 ■
53, 56, 59, 62, 280
280 + 56 + 59 + 62 + 53
5
= 102
Ricardo Miguel/Shutterstock.com 2009
SECTION 1.1
■
Making Sense of Data 5
Selling price (ⴛ $1000)
159 195 167 172 169 216 169 172
(c) Compare the average selling price and the median selling price.
Solution
(a) Since we are finding the average of the selling prices of 8 houses, we find the
sum of all the selling prices and divide by 8:
So in 2007 the average selling price was about $177,400.
(b) To find the median selling price, we first order the list of selling prices:
Since there are eight numbers in this list and the number eight is even, the me-
dian is the average of the middle two numbers
So the median selling price was $170,500.
(c) The average and the median are different but are not as far apart as in the
previous example because there are no outliers.
■ NOW TRY EXERCISE 21 ■
169 + 172
2
= 170.5
159, 167, 169, 169, 172, 172, 195, 216
159 + 195 + 167 + 172 + 169 + 216 + 169 + 172
8
L 177.4
2
■ Analyzing Two-Variable Data
Most real-world data involve two varying quantities. For example, we might want to
match age with height, education with income, and so on. If we list the age and height
of each child in a preschool class, we obtain data about the two variable quantities age
and height. In general, data that involve two variables are called two-variable data.
Our goal is to discover any relationships that may exist between the two variables.
example
4
Age and Height
The ages and heights of children in a preschool class are given in the table.
(a) Does being older necessarily imply being taller?
(b) Is the oldest student the tallest?
Solution
(a) No. The table shows several cases in which older does not necessarily imply
taller. For example, there is a 2-year-old who is 36 in. tall and a 3-year-old
who is only 35 in. tall.
Age (yr) 2 2 2 3 3 3 4 4 4 4 4 5
Height (in.) 32 31 36 38 35 41 47 43 42 38 39 45
6 CHAPTER 1
■
Data, Functions, and Models
example
5
Time and Temperature
The table below gives the temperature in two hour intervals in Chemainus, British
Columbia, on a pleasant June day.
(a) What is the highest temperature recorded?
(b) When was the lowest temperature recorded?
Solution
(a) From the table we see that the highest temperature is 68°F.
(b) From the table we see that the lowest temperature occurred at 2:00 P.M.
■ NOW TRY EXERCISE 27 ■
example
6
Depth and Pressure
A deep sea diver measures the water pressure at different ocean depths. The results
of her measurements are listed in the table.
(a) What is the pressure at a depth of 50 ft?
(b) At what depth is the pressure 28.2 lb/in
2
?
(c) By how much does the pressure change as the depth changes from 0 ft to
10 ft? From 10 ft to 20 ft? From 20 ft to 30 ft?
(d) What pattern or trend do you see in these data?
Solution
(a) The data indicate that at a depth of 50 ft the pressure is 37.2 lb/in
2
.
(b) The pressure is 28.2 lb/in
2
at a depth of 30 ft.
(c) From a depth of 0 ft to a depth of 10 ft, the pressure changes from 14.7 lb/in
2
to 19.2 lb/in
2
, for a total increase of
lb/in
2
19.2 - 14.7 = 4.5
Time Hours since
6:00
A.M.
Temperature
(°F)
6:00 A.M. 0 59
8:00 A.M. 2 62
10:00 A.M. 4 68
12:00 P.M. 6 65
2:00 P.M. 8 58
4:00 P.M. 10 60
6:00 P.M. 12 62
Depth
(ft)
Pressure
(lb/in
2
)
0 14.7
10 19.2
20 23.7
30 28.2
40 32.7
50 37.2
60 41.7
(b) No. We see from the table that the oldest student is 5 years old and is 45 in. tall,
but there is a 4-year-old who is 47 in. tall, so the oldest student is not the tallest.
■ NOW TRY EXERCISE 25 ■
In Example 4(b) we found that a particular 2-year-old child may be taller than a
particular 3-year-old. But in general, the trend is that older children tend to be taller.
The process of finding such trends in data is discussed in the next section.
SECTION 1.1
■
Making Sense of Data 7
From a depth of 10 ft to a depth of 20 ft, the pressure changes from 19.2 lb/in
2
to 23.7 lb/in
2
, for a total increase of
lb/in
2
From a depth of 20 ft to a depth of 30 ft, the pressure changes from 23.7 lb/in
2
to
28.2 lb/in
2
, for a total increase of
lb/in
2
You can check that the increase in pressure is 4.5 lb/in
2
for each successive
10-ft increase in depth shown in the data.
(d) From the table we see that the pressure seems to increase steadily as the depth
increases.
■ NOW TRY EXERCISE 29 ■
28.2 - 23.7 = 4.5
23.7 - 19.2 = 4.5
1.1 Exercises
CONCEPTS
Fundamentals
1. (a) What are one-variable data? Give examples.
(b) What is the difference between one-variable data and two-variable data? Give
examples.
2. What is meant by central tendency for one-variable data? Measures of central tendency
for one-variable data include the average and the
_______.
3. To find the average of a list of n numbers, we first
_______ all the numbers and then
divide by
_______.
4. To find the median of a list of numbers, we first rearrange the numbers to put them in
_______. To find the median of a list of n ordered numbers, we do the following.
(a) If n is odd, the median is the
_______ number in the list.
(b) If n is even, the median is the average of the two
_______ numbers in the list.
Think About It
5. If you have a million data points (as may be available on the Internet), what technology
would you need to help you find the average or the median of the data?
6. Find several examples of two-variable data that you may be able to collect from your
classmates, for instance, height and shoe size.
7–10
■ A table of one-variable data is given.
(a) Find the average of the data.
(b) Find the median of the data.
(c) How many data points are greater than the average? How many are greater than the
median?
7.
8.
9.
A 69 71 74 73 72 73 69 69
A 132 510 119 132 141 132 121
A 113 21 16 16 19 29 21
SKILLS
8 CHAPTER 1
■
Data, Functions, and Models
CONTEXTS
10.
11–14
■ A table of two-variable data is given. What pattern or trend do you see in these data?
11.
12.
13. 14.
15. Basketball Stats The list below shows the number of points scored by Kobe Bryant
of the Los Angeles Lakers in each basketball game in which he played in February 2007.
What is the average number of points per game that Kobe Bryant scored in that month?
16. Lion Prides A wildlife biologist in the south Sahara Desert of Africa records the
number of lions in the different prides in her area. What is the average number of lions
in a pride?
17. Apgar Score Doctors use the Apgar score to assess the health of a newborn baby
immediately after the child is born. The list below shows the Apgar scores of babies
born in Memorial Hospital on March 11, 2007. What are the average and the median
Apgar scores for these babies?
18. Weights of Sextuplets The Hanselman sextuplets were born three months premature
on February 26, 2004, in Akron, Ohio, and they have all survived to this date. The list
below shows the birth weights of each child in pounds. What are the average and the
median birth weights of these sextuplets?
19. Quiz Average The table below shows Jordan’s scores on her first five algebra quizzes.
(a) What is her average quiz score?
(b) Jordan receives a score of 10 on her sixth quiz, so now what is her average quiz score?
20. Quiz Average The table below shows Chad’s scores on his first four geography
quizzes.
(a) What is his average quiz score?
(b) Chad receives a score of 5 on his fifth quiz, so now what is his average quiz score?
Score 7 9 8 9
Score 9 9 6 7 7
2.6250, 1.5625, 2.3750, 2.5000, 2.5000, 2.0625
9, 8, 10, 3, 5, 8, 10
18, 8, 14, 15, 16, 12, 17
46, 30, 6, 11, 36, 33, 31, 29, 23, 41, 17, 21, 30, 21, 33
A 0 1 2 3 4 5
B 100 50 25 12 10 10
A 0 1 2 3 4 5
B 3 10 25 26 25 25
A 0 1 2 3 4 5
B 100 95 89 82 76 71
A 0 1 2 3 4 5
B 20 40 80 250 600 1000
A 91 87 84 82 87 84 93 82
SECTION 1.1
■
Making Sense of Data 9
21. Investment Seminar The organizer of an investment seminar surveys the
participants on their yearly income. The table below shows the yearly income of the
participants.
(a) Find the average and median income of the participants.
(b) How many participants have an income above the average?
(c) A new participant joins the seminar, and her yearly income is $500,000. Now what
are the average income and median income, and how many participants have an
income above the average? Is the average or the median the better measure of
central tendency?
22. Dairy Farming A dairy farmer in Illinois records the weights of all his cows. The
table below shows his data.
(a) Find the average and median weight of the cows on the farm.
(b) How many cows have a weight above the average?
(c) The farmer purchases a young calf that weighs only 420 pounds. Now what are the
average weight and median weight of the cows on the farm, and how many cows
have a weight above the average? In this case, is the average or the median the
better measure of central tendency?
23. Home Sales A realty agency in Albuquerque, New Mexico, records the prices of
homes sold in one neighborhood.
(a) What are the average and median home prices in this neighborhood? Which is the
better indicator of central tendency?
(b) Is the house that sold for $329,000 above or below the average price? The
median price?
(c) After these data were gathered, another home in the neighborhood sold for
$2,860,000, so now what are the average and median home prices if we include the
latest price? Now what is the better indicator of central tendency?
24. Home Sales A realty agency in Napa Valley, California, records the prices of homes
sold in one neighborhood.
(a) What are the average and median home prices in this neighborhood? Which is the
better indicator of central tendency?
(b) Is the house that sold for $2,319,000 above or below the average price? The
median price?
(c) After these data were gathered, another home in the neighborhood sold for
$300,000, so now what are the average and median home prices if we include the
latest price? Now what is the better indicator of central tendency?
25. Pets per Household The home owners association of a small gated community
conducts a survey to determine trends in the number of pets in their neighborhood. The
Price ($) 299,000 329,000 355,000 316,000 330,000
Weight (lb) 880 970 930 890 980 920 900
Yearly income ($) 56,000 58,000 48,000 45,000 59,000 72,000 63,000
Price ($) 2,278,000 2,231,000 2,319,000 2,279,000 2,365,000 2,279,000 2,319,000
10 CHAPTER 1
■
Data, Functions, and Models
number of people in a household and the number of pets they own are recorded. The
table below shows the results of the survey.
(a) What is the average number of pets in a household in this community?
(b) Does the largest family have the most pets?
(c) How many people are in the household with the most pets?
26. Cars per Household The home owners association of Exercise 25 conducts another
survey to determine trends in the number of cars owned by members of their
community. The number of people in a household and the number of cars they own are
recorded. The table below shows the results of this survey.
(a) What is the average number of cars in a household in this community?
(b) Does the largest family own the most cars?
(c) How many people are in the household with the most cars?
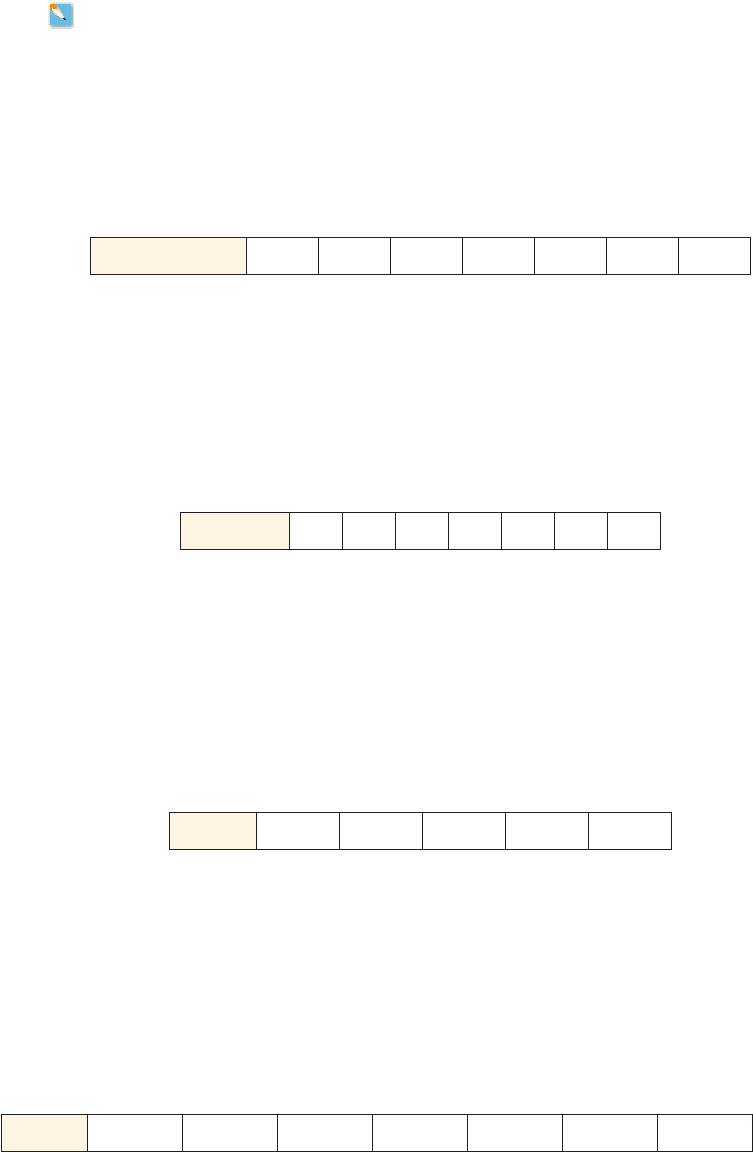
27. Snowfall The Sierra Nevada mountain range is well known for its large snowfalls,
especially in the area of Lake Tahoe. This area usually gets over 200 inches of snow a
year. The table below gives the snowfall for each month in 2006.
(a) What was the snowfall for the month of February 2006?
(b) What month had the highest snowfall? What month had 49 inches?
(c) Find the average monthly snowfall for 2006.
(d) Find the median monthly snowfall for 2006.
28. Precipitation The Olympic Peninsula in the state of Washington is home to three
temperate rain forests and receives 80 or more inches of rainfall a year. The table below
gives this area’s monthly precipitation in 2007.
(a) How many inches of rainfall were recorded in May?
(b) What month had the highest rainfall? What month had 2 inches of rain?
(c) Find the average monthly precipitation for 2007.
(d) Find the median monthly precipitation for 2007.
Month 1 2 3 4 5 6 7 8 9 10 11 12
Snowfall (in.) 49 12 83 42 2 0 0 0 0 0 8 14
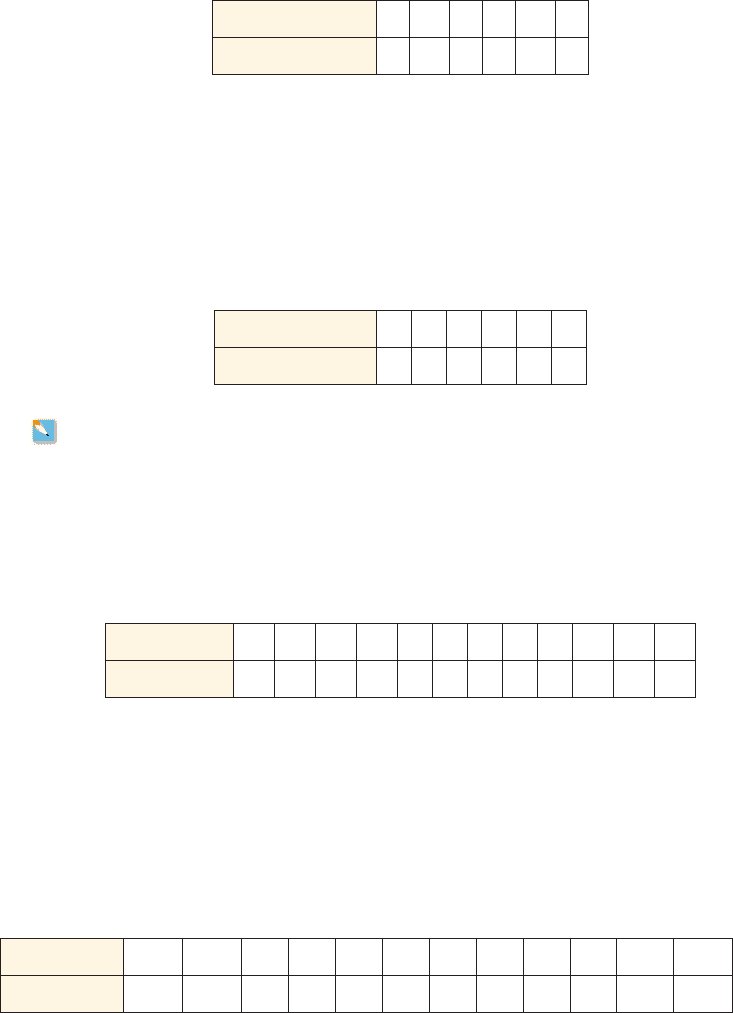
Number of people 2 1 5 3 2 3
Number of cars 1 1 3 0 5 3
Number of people 2 1 5 3 2 3
Number of pets 5 11 2 0 15 1
Month 1 2 3 4 5 6 7 8 9 10 11 12
Rainfall (in.) 15.6 10.8 9.8 4.9 3.2 2.1 2.0 1.3 2.7 8.3 14.0 14.6
SECTION 1.1
■
Making Sense of Data 11
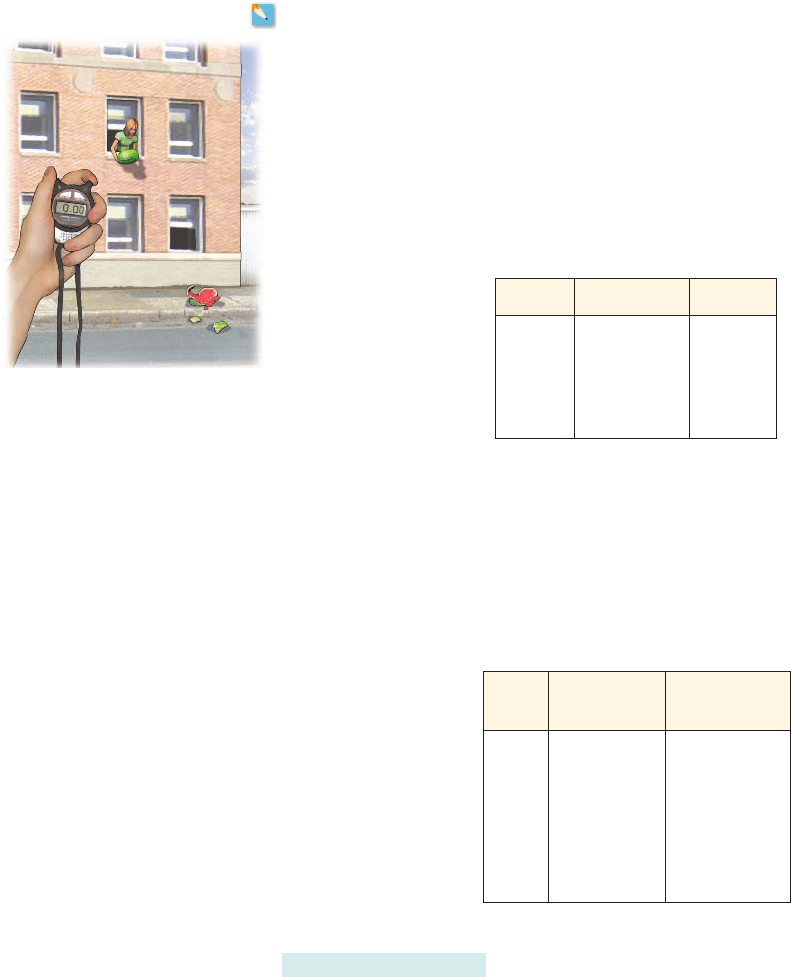
29. Falling Watermelons The fifth grade class at Wilson Elementary School performs
an experiment to determine the time it takes for a watermelon to fall to the ground.
They have access to a five-story building for their experiment. The class drops a
watermelon out of a window from each story of the building and records the time it
takes for the watermelon to fall to the ground. The table below shows the results of
their experiment.
(a) How long does it take for a watermelon to fall 5 ft from the first-story window?
(b) How much longer does it take a watermelon to fall from 15 ft than from 5 ft? From
45 ft than from 35 ft?
(c) What pattern or trend do you see in these data?
Story Distance (ft) Time (s)
First 5 0.60
Second 15 0.96
Third 25 1.26
Fourth 35 1.49
Fifth 45 1.68
30. Cooling Car Engine The operating temperature of Sofia’s car is about 180°F. When
Sofia returns home from work at 5:00
P.M., she parks her car in the garage. The table
shows the temperature of the engine at half-hour intervals.
(a) Find the temperature of the engine at 5:30
P.M. and 7:30 P.M.
(b) When does the temperature reach 100°F?
(c) What pattern or trend do you see in these data?
31. Algebra and Alcohol The data in the Prologue (page P2) give the blood alcohol
concentration following the consumption of different doses of alcohol. Consider the
data for consumption of 15 mL.
(a) Find the blood alcohol concentration (mg/mL) after 0.2, 0.5, and 1.5 hours.
(b) When does the blood alcohol concentration drop below 0.1?
(c) What pattern or trend do you see in these data?
Time
(
P.M.)
Hours since
5:00
P.M.
Temperature
(°F)
5:00 0.0 180
5:30 0.5 145
6:00 1.0 100
6:30 1.5 83
7:00 2.0 76
7:30 2.5 72
8:00 3.0 71
12 CHAPTER 1
■
Data, Functions, and Models
2
1.2 Visualizing Relationships in Data
■
Relations: Input and Output
■
Graphing Two-Variable Data in a Coordinate Plane
■
Reading a Graph
IN THIS SECTION… we learn how to represent a set of two-variable data as a “relation.”
We also learn how graphs of two-variable data help us get information about the data.
GET READY… by reviewing how to plot points in a coordinate plane in Algebra
Toolkit D.1. Test your readiness by doing the Algebra Checkpoint at the end of this
section.
When business people, sociologists, or scientists analyze data, they look for a trend
or pattern from which to draw a conclusion about the process they are studying. It is
often hard to look at a list of numbers and see any kind of pattern; this is especially
true when the lists are huge. One of the best ways to reveal a hidden pattern in data
is to draw a graph, which we do in this section.
2
■ Relations: Input and Output
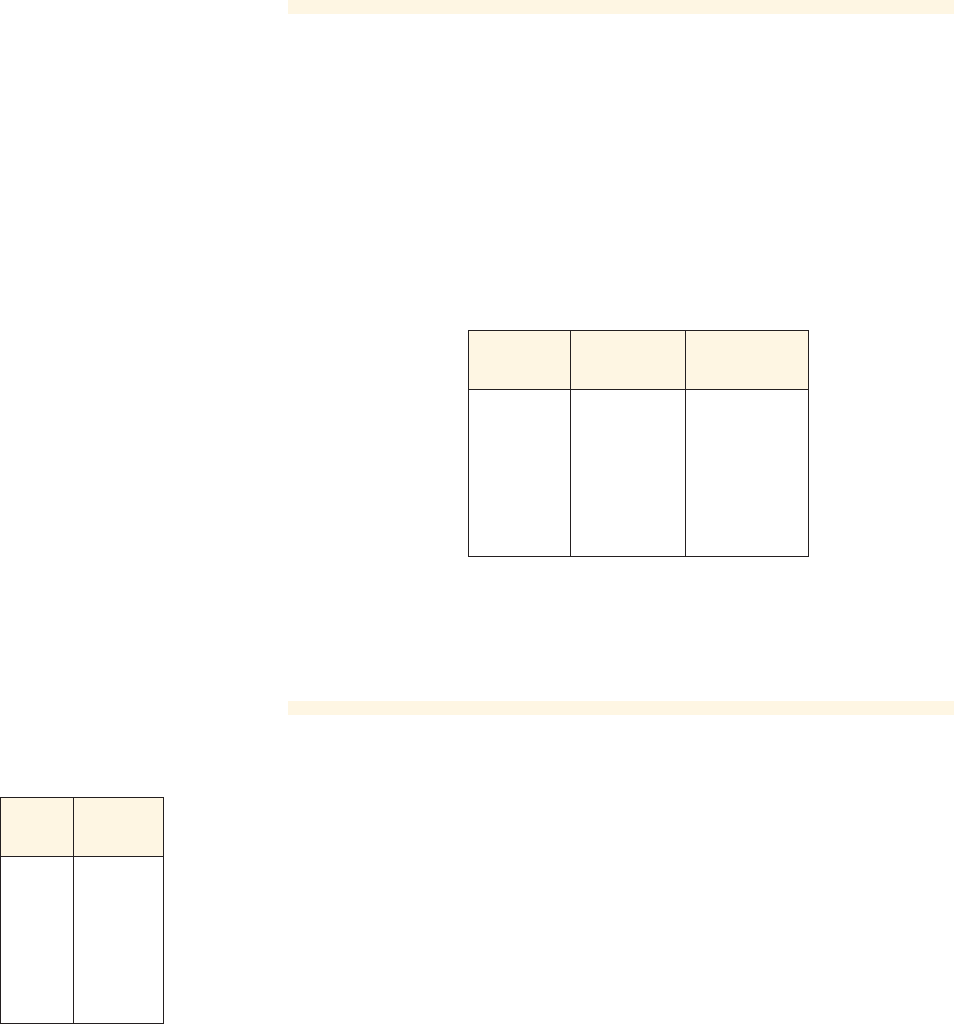
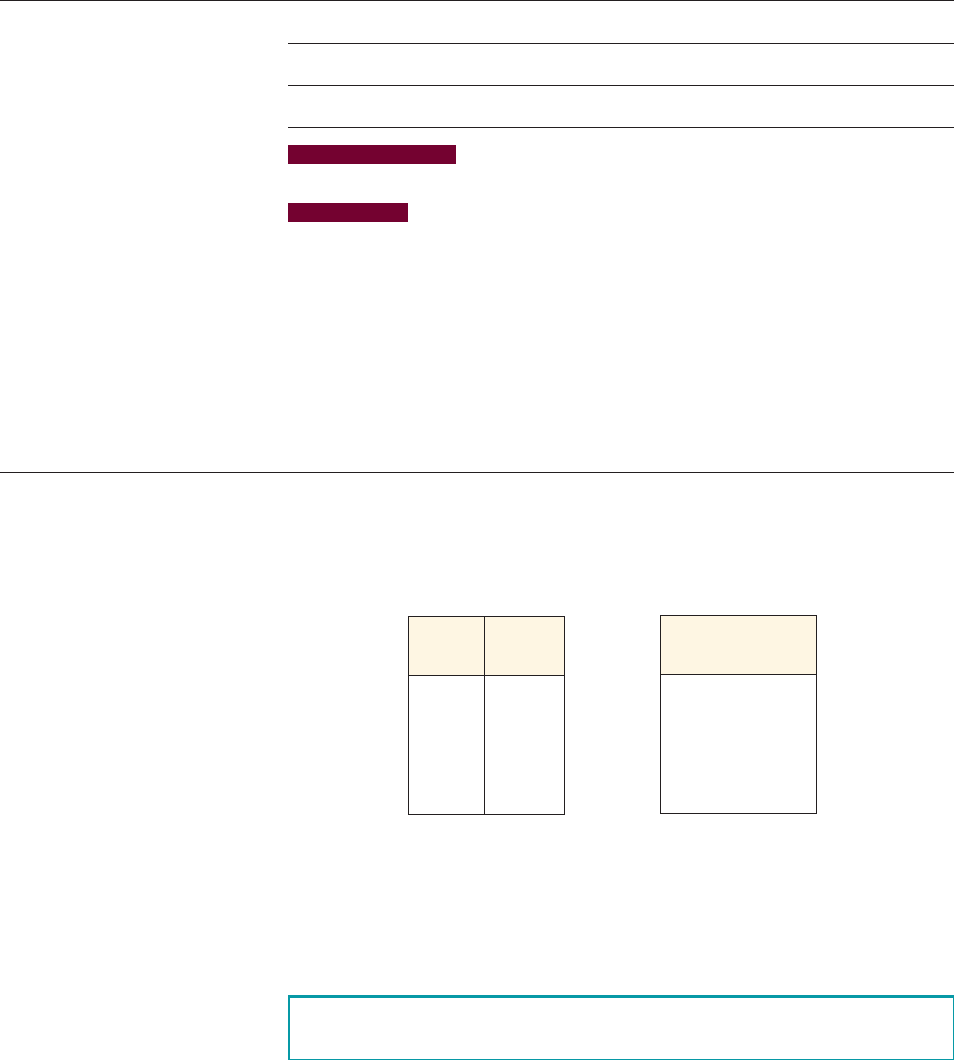
The following data give the height and weight of five college algebra students. We
can also represent the data as ordered pairs of numbers.
Data Data as ordered pairs
For example, the pair (72, 180) represents the student with height 72 inches and
weight 180 pounds. In general, if we let x stand for height and y stand for weight,
then the ordered pair (x, y) represents the student with height x and weight y. In
mathematics any collection of ordered pairs is called a relation.
Relation
Notice that by writing two numbers as an ordered pair, we are saying that the
two numbers are linked together, or related to each other. We say that the first num-
ber is an input and the second is an output of the relation. So for the ordered pair
(72, 180) the input is 72 and the output is 180. We can visualize this relation by draw-
ing a diagram as follows.
Height
(in.)
Weight
(lb)
72 180
60 204
60 120
63 145
70 184
A relation is any set of ordered pairs.
(height, weight)
(72, 180)
(60, 204)
(60, 120)
(63, 145)
(70, 184)
SECTION 1.2
■
Visualizing Relationships in Data 13
72
60
63
70
180
204
120
145
184
OutputInput
The domain of a relation is the set of all inputs, and the range is the set of all out-
puts. In this example, the domain is the set of heights and the range is the set of
weights:
Domain
Range
Notice that the domain and range are sets, so each number is listed only once. Even
though the number 60 occurs twice as an input, it is listed only once in the domain.
5120, 145, 180, 184, 2046
560, 63, 70, 726
example
1
Two-Variable Data as a Relation
The students in an algebra course gathered data on the final exam scores and the num-
ber of hours of sleep students had before the exam. The data are shown in the table.
(a) Express the data as a relation.
(b) Draw a diagram of the relation.
(c) What does the pair (80, 5) represent?
(d) Find the output(s) corresponding to the input 80.
(e) Find the domain and range of the relation.
Solution
(a) The set of ordered pairs that defines this relation is
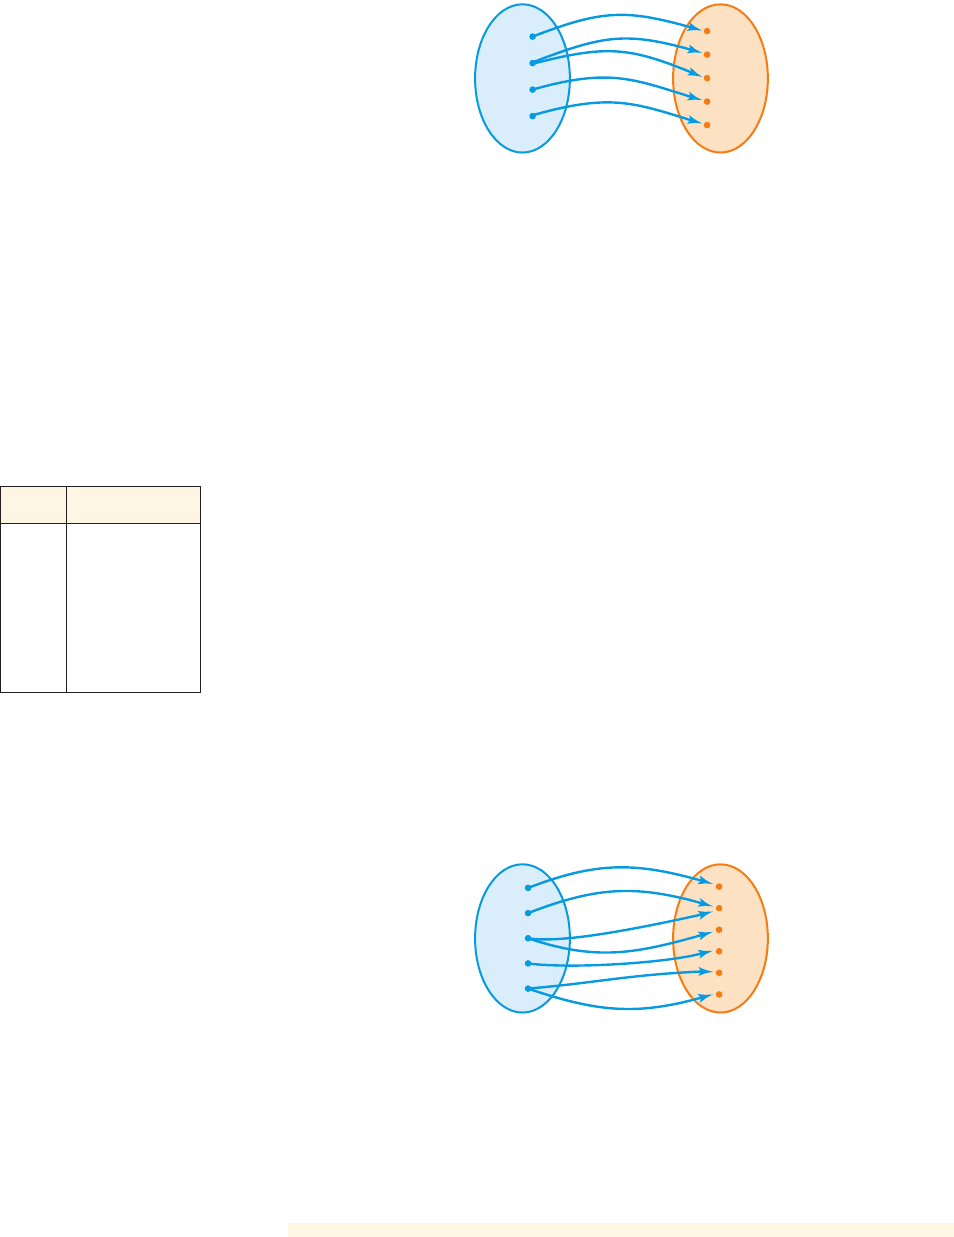
(b) A diagram of the relation is shown below.
5192, 82, 180, 52, 170, 12, 182, 92, 191, 72, 180, 72, 170, 326
Score Hours of sleep
92 8
80 5
70 1
82 9
91 7
80 7
70 3
92
91
80
82
70
8
7
5
9
3
1
Out
p
utsIn
p
uts
(c) The pair (80, 5) represents a student who received a score of 80 and had 5
hours of sleep before the exam.
(d) There are two outputs that correspond to the input 80; they are 5 and 7.
(e) The domain of this relation is the set , and the range is the
set .
■ NOW TRY EXERCISES 11 AND 35 ■
51, 3, 5, 7, 8, 96
570, 80, 82, 91, 926