Stewart J. College Algebra: Concepts and Contexts
Подождите немного. Документ загружается.


14 CHAPTER 1
■
Data, Functions, and Models
example
2
Domain and Range of a Relation
The data in the table give the number of house finches seen at a bird feeder on vari-
ous days in February 2008.
(a) Express the data as a relation.
(b) What does the pair (12, 15) represent?
(c) Find the domain and range of the relation.
Solution
(a) The set of ordered pairs that defines this relation is
(b) The pair (12, 15) tells us that 15 house finches were seen at the bird feeder on
February 12.
(c) The domain of the relation is the set , and the range is the
set .
■ NOW TRY EXERCISE 37 ■
53, 10, 15, 20, 216
52, 5, 12, 15, 21, 256
512, 212, 15, 202, 112, 152, 115, 102, 121, 152, 125, 326
2
■ Graphing Two-Variable Data in a Coordinate Plane
Two-variable data consist of ordered pairs of numbers, so to graph such data, we
graph the ordered pairs in a coordinate plane, with one variable plotted on the x-axis
and the other on the y-axis. For instance, to plot the depth-pressure data tabulated in
Example 6 of Section 1.1, we would plot the points (0, 14.7), (10, 19.2), (20, 23.7),
and so on, where the first coordinate represents depth and the second represents the
corresponding pressure. Such a graph of data is called a scatter plot. Graphs and
scatter plots are so common in everyday life (you see them in magazines, in news-
papers, on television news, and in advertising) that you may already have thought of
making a graph of the data in the preceding examples.
example
3
Graphing Two-Variable Data
Draw a scatter plot of the time-temperature data and the depth-pressure data from
Examples 5 and 6 of Section 1.1. Comment on any trends or patterns you observe
from the graphs.
Day
Number of
house finches
2 21
5 20
12 15
15 10
21 15
25 3
Hours since
6:00
A.M.
Temperature
(°F)
0 59
2 62
4 68
6 65
8 58
10 60
12 62
Depth
(ft)
Pressure
(lb/in
2
)
0 14.7
10 19.2
20 23.7
30 28.2
40 32.7
50 37.2
60 41.7
To review how we plot points in
a coordinate plane, see Algebra
Toolkit D.1, page T67.
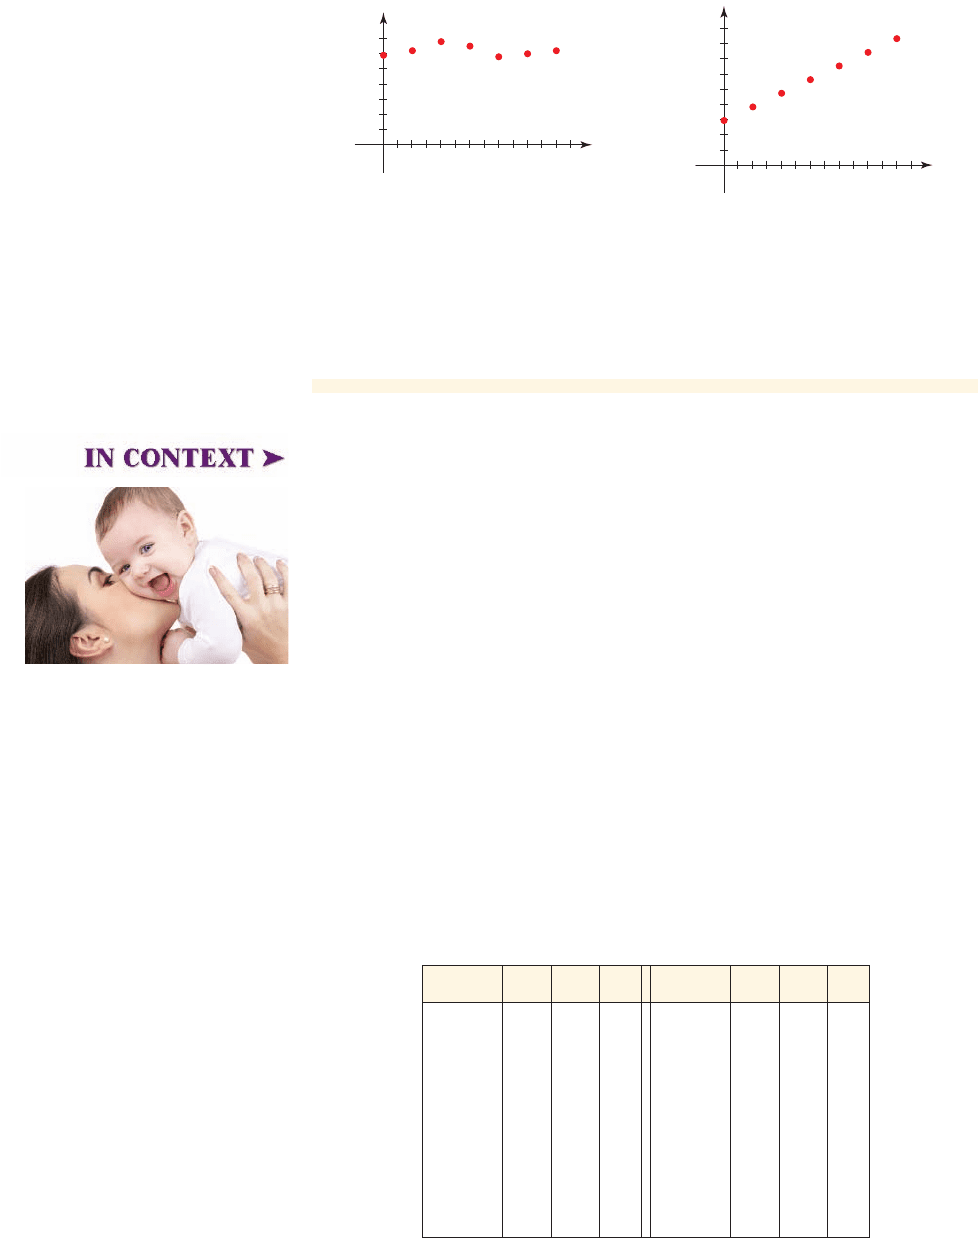
Solution
We plot the points given by the ordered pairs listed in the tables. The graphs are
shown in Figures 1 and 2.
SECTION 1.2
■
Visualizing Relationships in Data 15
In the time-temperature data we see that as time increases, the temperature first
increases, then decreases, then increases again. In the depth-pressure data there ap-
pears to be a very precise trend: As the depth increases, so does the pressure. In fact,
pressure appears to increase in proportion to the increase in depth.
■ NOW TRY EXERCISES 27 AND 39 ■
Finding relationships in two-variable data is a fundamental activity in every
branch of science. For example, scientists test different chemicals in the blood of ex-
pectant mothers to determine whether there is a relationship between the levels of
these chemicals and the chances of the baby having birth defects. Knowing the po-
tential for birth defects can sometimes give doctors a chance to intervene to repair
the defect. One way to discover such relationships is to collect data on the levels of
these chemicals for different expectant mothers. Graphing the data helps scientists
visually discover any relationships that may exist. The next example illustrates this
method.
IN CONTEXT ➤
40
60
y
(*F)
20
2468
Hours since 6:00
A.M.
10 12
0
x
figure 1 Time and temperature
20
30
40
(lb/in™)
10
10 20 30 40
x (ft)
50 60
0
figure 2 Depth and pressure
example
4
Levels of Enzymes in Expectant Mothers
A biologist measures the levels of three different enzymes (call them A, B, and C) in 20
blood samples taken from expectant mothers. The data she obtains are given in the table,
where enzyme levels are in milligrams per deciliter (mg/dL). The biologist wishes to
determine whether there is a relationship between the levels of the different enzymes.
(a) Make a scatter plot of the levels of the pairs of enzymes A and B.
(b) Make a scatter plot of the levels of the pairs of enzymes A and C.
(c) What relationships do you see in the data?
Sample A B C
11 2.2 0.6 25
12 1.5 4.8 32
13 3.1 1.9 20
14 4.1 3.1 10
15 1.8 7.5 31
16 2.9 5.8 18
17 2.1 5.1 30
18 2.7 2.5 20
19 1.4 2.0 39
20 0.8 2.3 56
Sample A B C
1 1.3 1.7 49
2 2.6 6.8 22
3 0.9 0.6 53
4 3.5 2.4 15
5 2.4 3.8 25
6 1.7 3.3 30
7 4.0 6.7 12
8 3.2 4.3 17
9 1.3 8.4 45
10 1.4 5.8 47
Lev Dolgachov/Shutterstock.com 2009
16 CHAPTER 1
■
Data, Functions, and Models
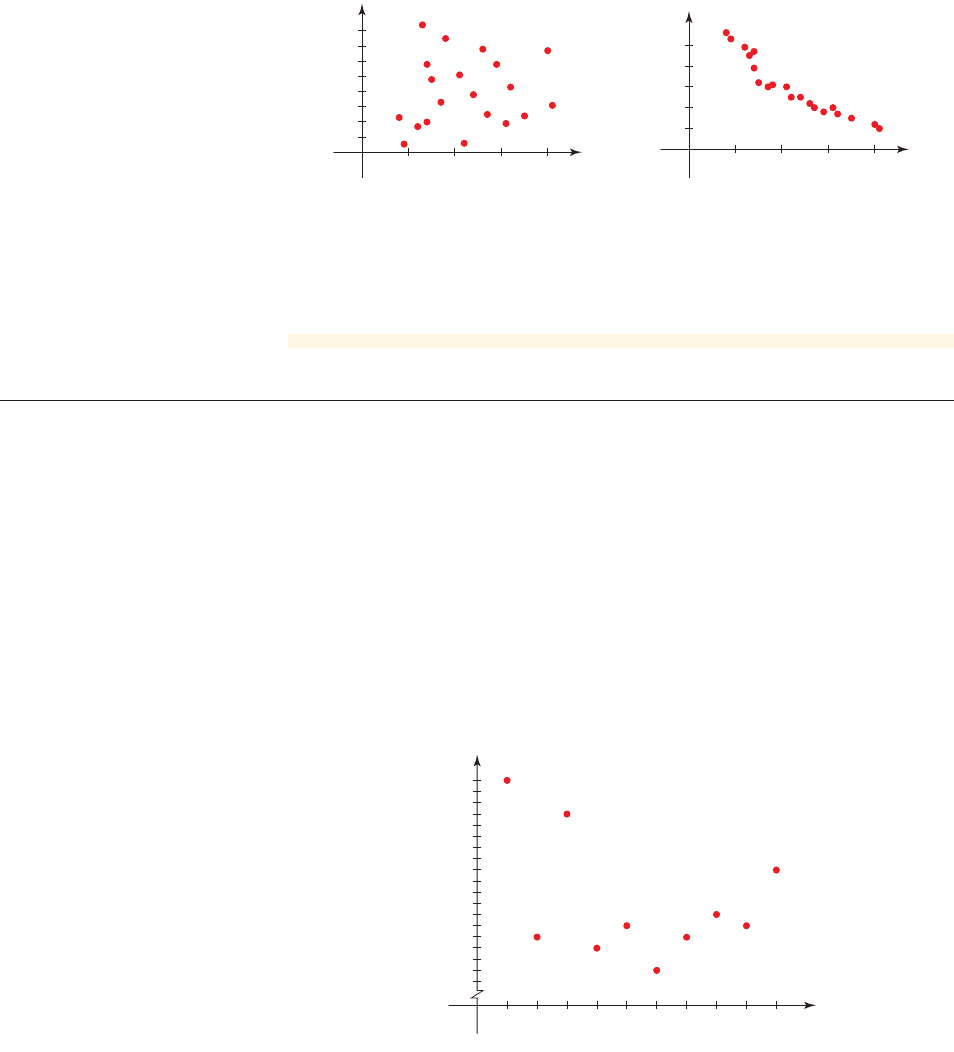
Solution
Scatter plots for parts (a) and (b) are shown in Figures 3 and 4. Note that each point
plotted represents the results for one sample; for instance, Sample 1 had 1.3 mg/dL
of enzyme A and 1.7 mg/dL of enzyme B, so we plot the point (1.3, 1.7) to represent
this data pair.
4
6
8
2
2413
0
A
B
figure 3 Enzymes A and B
40
20
2143
0
A
C
figure 4 Enzymes A and C
(c) From Figure 3 we see that there is no obvious relationship between the levels
of enzymes A and B. From Figure 4 we see that when the level of enzyme A
goes up, the level of enzyme C tends to goes down.
■ NOW TRY EXERCISES 29 AND 41 ■
2
■ Reading a Graph
Data are often presented in the form of a graph. In the next example we read the data
from a graph.
example
5
Reading a Graph
The average annual precipitation in Medford, Oregon is 21 inches. The graph in
Figure 5 shows the total annual precipitation for the ten-year period 1996–2005. In
the graph Year 1 corresponds to 1996, Year 2 to 1997, and so on.
(a) What was the precipitation in 2002?
(b) Which year(s) had a total precipitation of 29 in?
(c) Which year(s) had a total precipitation that was higher than average?
18
20
22
24
26
28
30
32
y
(in.)
14
16
21436587109
Year
0
x
figure 5 Precipitation in Medford, Oregon
SECTION 1.2
■
Visualizing Relationships in Data 17
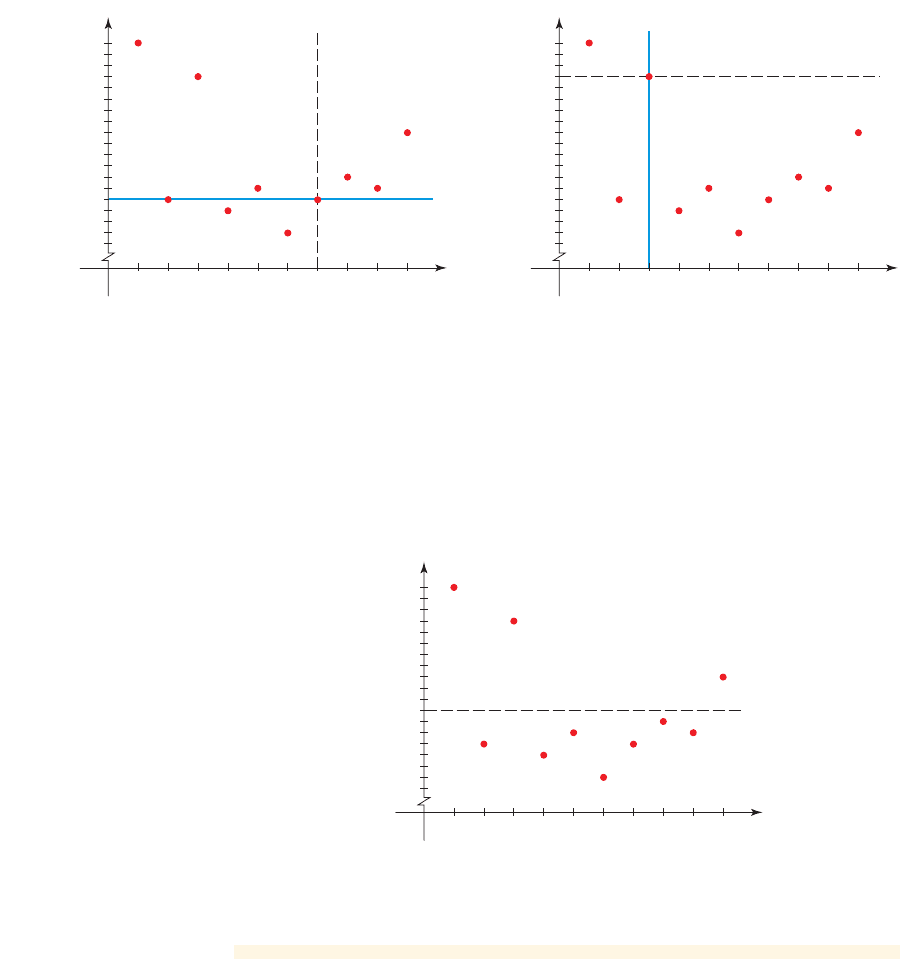
Solution
(a) The year 2002 is Year 7 on the graph. We need to find the height of the point
in the graph above Year 7. From the graph in Figure 6(a) we see that the total
rainfall was 18 in.
(b) Precipitation of 29 in. corresponds to the horizontal line in Figure 6(b). From
the graph we see that only Year 3 had this level of precipitation, that is, the
year 1998.
18
20
22
24
26
28
30
32
14
16
21436587109
Year
(a) Rainfall in Year 7
0
x
18
20
22
24
26
28
30
32
14
16
21436587109
Year
(b) Rainfall of 29 in.
0
x
y
(in.) y (in.)
figure 6
(c) Since the average precipitation for this region is 21 in, we draw a
horizontal line as in Figure 7. From Figure 7 we see that Years 1, 3, and
10 had more than 21 in. of precipitation. These years correspond to 1996,
1998, and 2005.
18
20
22
24
26
28
30
32
14
16
21436587109
Year
0
x
y
(in.)
figure 7 Average rainfall is 21 in.
■ NOW TRY EXERCISES 15 AND 45 ■
18 CHAPTER 1
■
Data, Functions, and Models
Test your knowledge of plotting points in a coordinate plane. You can review this
topic in
Algebra Toolkit D.1
on page T67.
1. Plot the ordered pair in a coordinate plane.
(a) (3, 4) (b) (5, 1) (c) (d)
(e) (f) (g) (h) (2, 1)
2. Find the coordinates of the points shown in the figure to the left.
3–4 A set of points is given.
(a) Give a verbal description of the set.
(b) Graph the set in a coordinate plane.
3. 4.
51x, y2冨 y =-1651x, y2冨 x = 26
1- 2, 5215, - 321- 2,- 42
1- 1, 121- 2, 32
x
H
G
F
E
DB
CA
0
1
1
y
1.2 Exercises
100
200
300
Wage
1052015 3025
Hours
0
x
y
CONCEPTS
Fundamentals
1. The domain of a relation is the set of all _______, and the range of a relation is the set
of all
_______.
2. To express two-variable data as a relation, we represent the data as a set of
_______
pairs.
3. To graph a relation, we graph each ordered pair by plotting the input on the
____-axis
and the output on the
____-axis.
4. The scatter plot in the margin gives the relation between a worker’s wages (in dollars)
and the number of hours he works.
(a) What does the ordered pair (10, 100) represent?
(b) How many dollars does he earn when he works 20 hours?
(c) How many hours does he need to work to earn $100?
Think About It
5. Give examples of two-variable data where some inputs have more than one output.
6. Give examples of two-variable data where several inputs give the same output.
7–10
■ A collection of ordered pairs defining a relation is given.
(a) Find the domain and range of the relation.
(b) Sketch a diagram of the relation.
7.
8.
9.
10. 514, 12, 14, 32, 15, 22, 16, 126
515, 12, 13, 22, 1- 2, 52, 15, 5 26
511, 02, 12, - 12, 13, 0 2, 13, - 126
511, 12, 12, 22, 13, 42, 14, 626
SKILLS
SECTION 1.2
■
Visualizing Relationships in Data 19
11–12 ■ Two-variable data are given.
(a) Express the data as a set of ordered pairs where x is the input and y is the
output.
(b) Find the domain and range of the relation.
(c) Sketch a diagram of the relation.
(d) Find the output(s) corresponding to the input 5.
(e) Find the inputs(s) corresponding to the output 3.
11. 12.
13–14
■ Two-variable data are given.
(a) Express the data as a relation where x is the input and y is the output.
(b) Find the domain and range of the relation.
(c) Sketch a diagram of the relation.
(d) Find the output(s) corresponding to the input 70.
(e) Find the inputs(s) corresponding to the output 20.
13. 14.
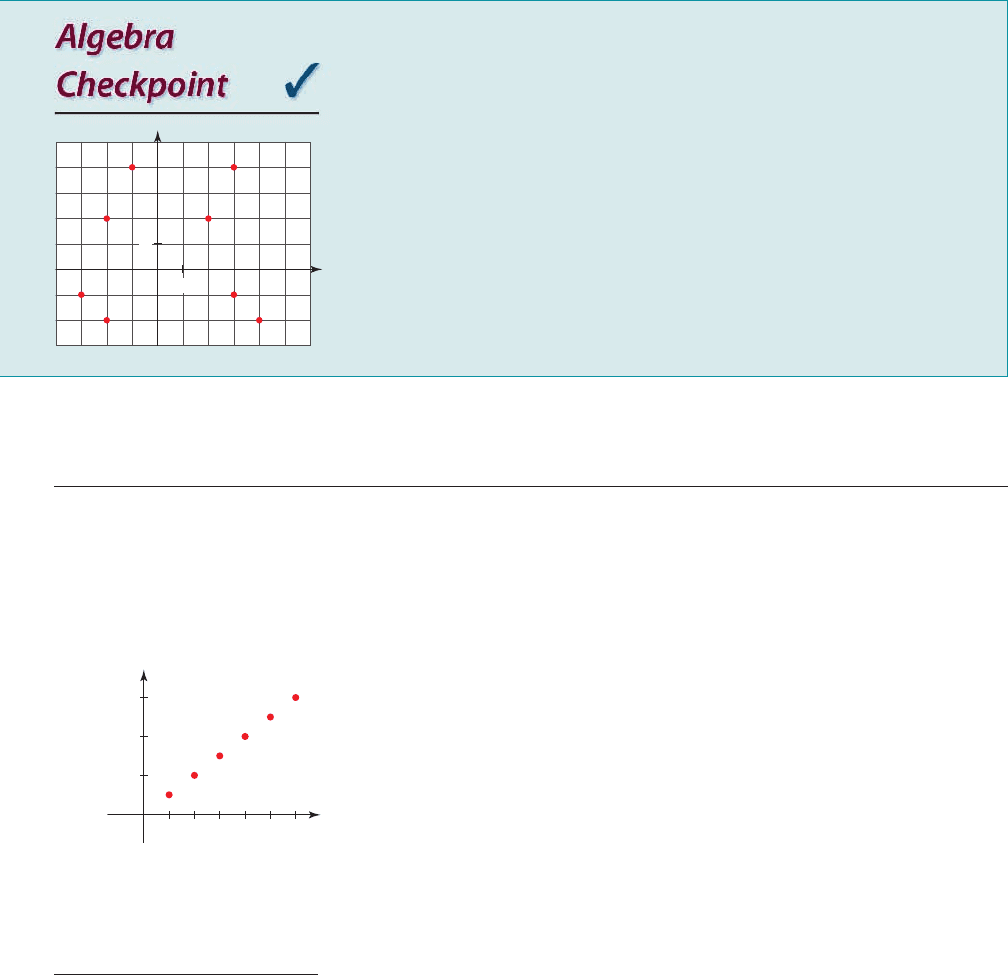
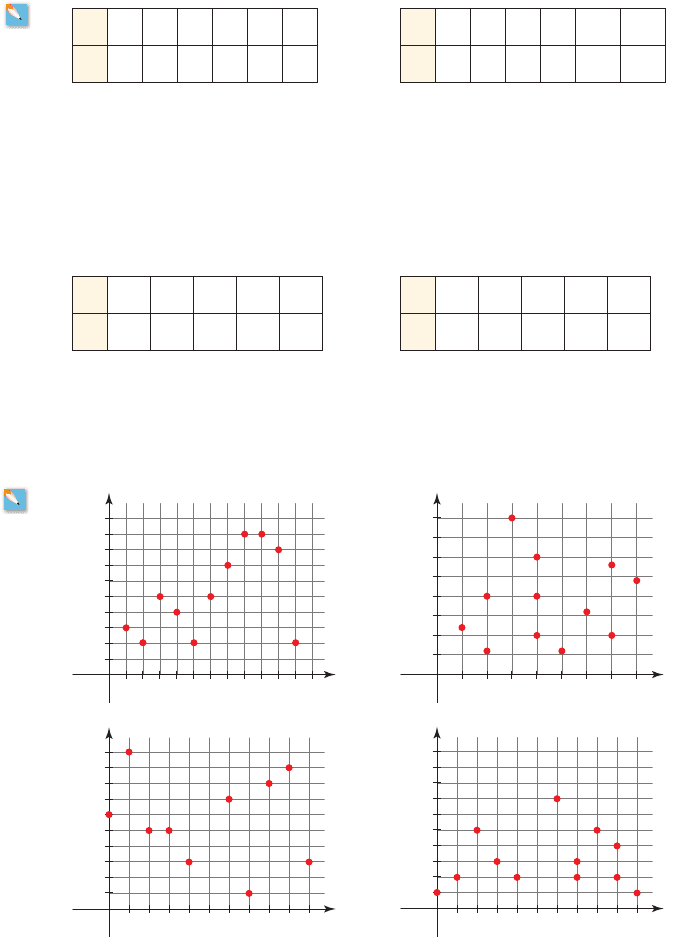
15–18
■ The graph of a relation is given.
(a) List three ordered pairs in the relation.
(b) Find the output(s) corresponding to the input 4.
(c) Find the input(s) corresponding to the output 50.
15. 16.
x 10 20 40 50 70
y 40 50 60 50 40
x 10 20 30 40 70
y 20 20 20 70 20
x 1 2 3 5 5 6
y 7 2 8 3 10 10
x 1 2 3 4 5 6
y 6 9 3 2 8 3
60
80
20
40
100
42861210
0
x
y
17. 18.
200
150
100
50
4286
0
x
y
100
80
60
40
20
428106
0
x
y
100
80
60
40
20
428106
0
x
y
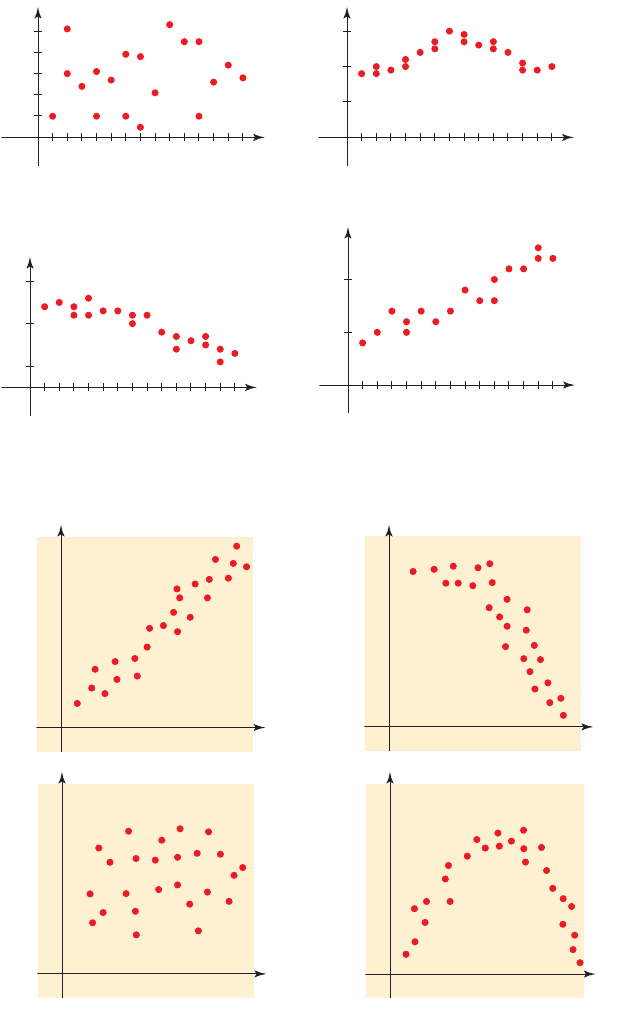
23–26 ■ For each scatter plot, decide whether there is a relationship between the variables.
If there is, describe the relationship.
23. 24.
0
x
y
0
x
y
0
x
y
20 CHAPTER 1
■
Data, Functions, and Models
19–22
■ The graph of a relation is given. Match the description of the relation to the
appropriate graph.
19. The y values get larger as the x values get larger.
20. The y values get smaller as the x values get larger.
21. The y values get larger and then get smaller as the x values get larger.
22. There is no obvious relationship between x and y.
400
200
428
Graph A
10 12 146
0
x
y
2
3
1
428
Gra
p
h B
10 12 146
0
x
y
40
50
30
428
Gra
p
h C
10 12 146
0
x
y
5
10
428
Graph D
10 12 146
0
x
y
0
x
y
25. 26.
SECTION 1.2
■
Visualizing Relationships in Data 21
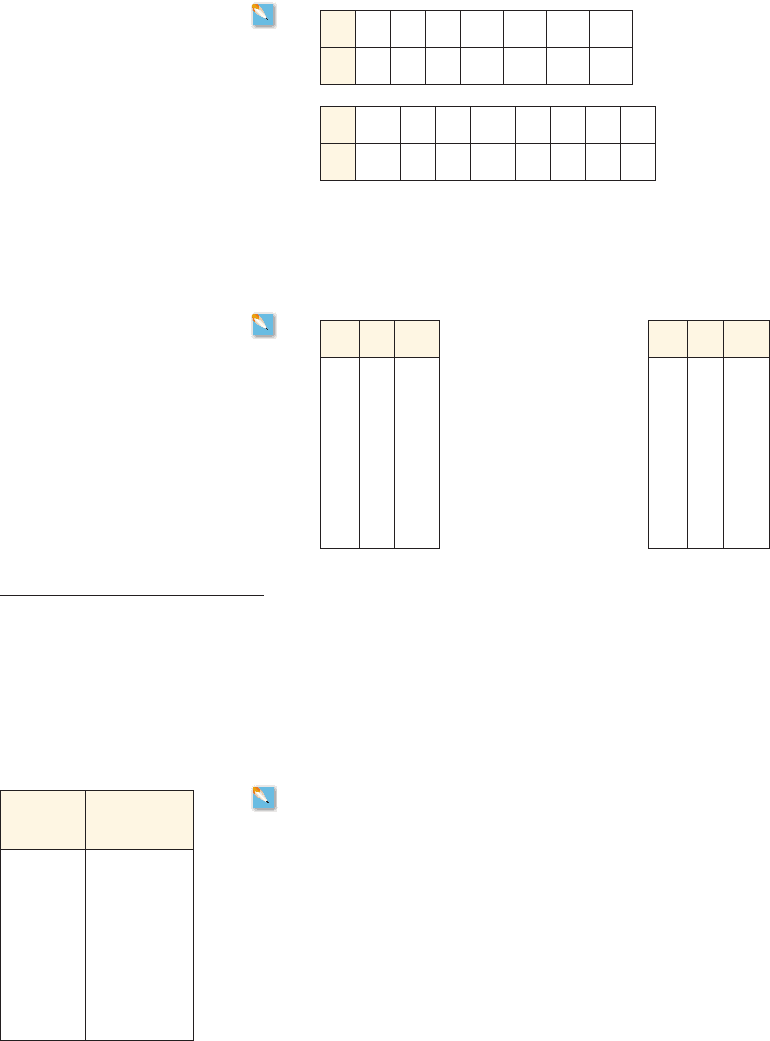
27–28 ■ A table of data is given.
(a) Make a scatter plot of the data in the given table.
(b) Determine whether there is a relationship between the variables. If there is,
describe the relationship.
27.
28.
29–30
■ A table of data is given.
(a) Make three scatter plots: one for A and B, one for B and C, and one for A and C.
(b) From each scatter plot, determine whether there is a relationship between the
variables. If there is, describe the relationship.
29. 30.
A B C
1 5 12
3 2 4
2 3 5
6 6 14
8 1 2
4 5 11
2 4 8
5 9 16
A B C
6 8 40
4 8 50
5 3 45
7 2 20
8 5 10
6 4 25
6 7 30
5 3 40
x 2 4 3 1 3 5 2 1
y 10 6 7 10 9 2 1 5
x 2 4 6 8 10 12 14
y 1 3 6 10 12 20 21
31–34 ■ Answer the following questions for the data in the indicated exercise from
Section 1.1.
(a) Express the data as a relation.
(b) Draw a diagram of the data.
(c) Find the domain and range of the relation.
31. Exercise 25 32. Exercise 26
33. Exercise 27 34. Exercise 28
35. Income and Home Prices The median incomes and median home prices in several
neighborhoods across the United States are shown in the table.
(a) Express the data as a relation.
(b) Draw a diagram of the relation.
(c) What does the ordered pair (55,000, 250,000) represent?
(d) Find the output(s) corresponding to the input 80,000.
(e) Find the domain and range of the relation.
36. Student Directory The student directory at a university lists the last four digits of
each student’s ID number and the number of years the student has completed. The table
on the next page contains some of this information.
(a) Express the data as a relation.
(b) Draw a diagram of the relation.
(c) What does the ordered pair (3371, 5) represent?
CONTEXTS
Median
income
Median
home price
80,000 400,000
30,000 250,000
70,000 300,000
55,000 250,000
80,000 450,000
60,000 300,000
55,000 300,000
150,000 1,500,000
22 CHAPTER 1
■
Data, Functions, and Models
37. Hybrid Car Sales With rising gas prices, there has been increasing interest in hybrid
cars. The table below shows the number of hybrid cars sold in some recent years.
(a) Express the data as a relation.
(b) What does the pair (2005, 213) represent?
(c) Find the domain and range of the relation.
(d) Find the output(s) corresponding to the input 6731.
(e) Find the domain and range of the relation.
ID number 8271 4357 6731 3642 3371 5291 2273 1942
Year completed 1 2 1 3 5 1 4 2
Year 2000 2004 2005 2006 2007
Hybrid cars sold (ⴛ 1000)
78 83 213 244 350
38. Women in Government Women did not have the right to vote in the United States until
1920. Since then, women have played an increasing role in government. The table shows
the number of women who served in the U.S. Senate in a given year.
(a) Express the data as a relation.
(b) What does the pair (2003, 14) represent?
(c) Find the domain and range of the relation.
Year
Women in the
U.S. Senate
1975 0
1977 3
1979 2
1981 2
1983 2
1985 2
1987 2
1989 2
1991 4
Year
Women in the
U.S. Senate
1993 7
1995 9
1997 9
1999 9
2001 14
2003 14
2005 14
2007 16
2009 17
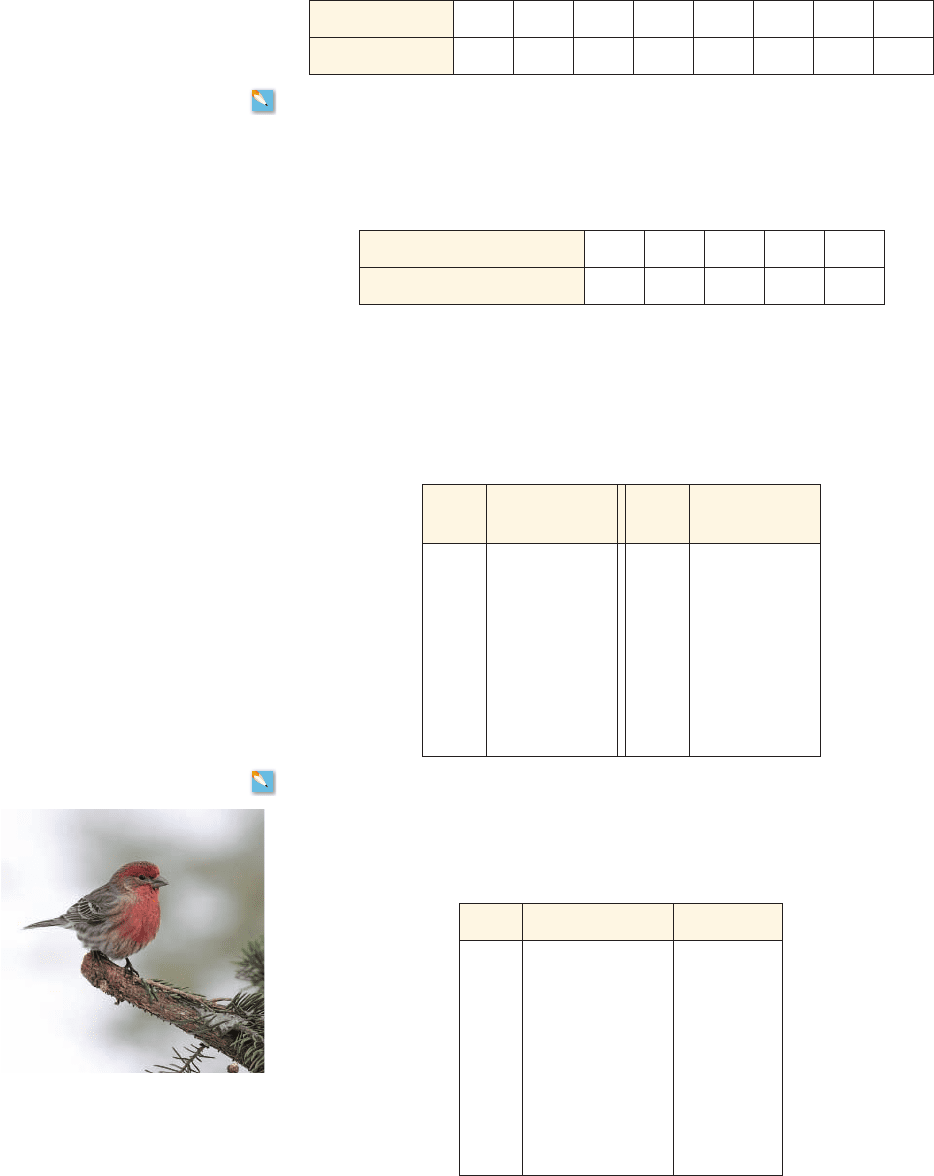
39. Christmas Bird Count For the past 100 years ornithologists have traditionally made a
worldwide bird count at Christmas time. The table below shows the number of house
finches observed in a Christmas bird count in California.
(a) Make a scatter plot of the data in the table.
(b) What trends do you detect in the house finch population of California?
Year Years since 1960 Bird count
1960 0 33,621
1965 5 44,787
1970 10 53,838
1975 15 86,507
1980 20 73,767
1985 25 91,659
1990 30 87,632
1995 35 107,190
2000 40 69,733
2005 45 61,053
Steve Byland/Shutterstock.com 2009

SECTION 1.2
■
Visualizing Relationships in Data 23
Year
Average
litter size
Coyotes
killed
1 3 310
2 4 250
3 5 360
4 4 280
5 8 570
6 9 640
7 7 550
Year 12345678910
Weight (lb) 150 152 156 162 180 183 169 166 165 162
Systolic pressure (mm Hg) 110 114 125 132 151 160 124 124 122 125
42. Life Expectancy and Demographics Over the course of the past century both
population and average life expectancy have increased in the United States. It is
interesting to see how the age distribution of the population (demographics) is affected
by these changes. The table below lists the percentage of the U.S. population that is
between the ages of 30 and 39 years, the median age of the U.S. population, and the life
expectancy at birth for a given year.
(a) Make a scatter plot of the data for the percentage of the U.S. population that is 30–39
and the life expectancy at birth. Describe any trends you detect from the graph.
(b) Make a scatter plot of median age and life expectancy of U.S. residents. Describe
any trends you detect from the graph.
43. Women in the Work Force The disparity between the median incomes of men and
women has narrowed significantly in the last two decades. The table on the next page
shows the median income of men and women over a 40-year period.
(a) On the same graph, make scatter plots of the data for the yearly median income of
men and the yearly median income of women.
Year
Years
since 1980
Percentage
age 30–39
Median
age
Life
expectancy
1980 0 6.1 34.2 73.7
1990 10 7.9 34.9 75.4
1995 15 8.4 35.2 75.8
1998 18 8.3 35.3 76.7
1999 19 8.2 34.0 76.7
2000 20 8.0 36.5 76.7
2001 21 7.8 35.6 77.2
2002 22 7.6 35.7 77.3
2003 23 7.4 35.9 77.6
2004 24 7.1 36.0 77.9
40. Coyote Reproduction Coyotes live throughout North America. They have become
a nuisance for pet owners and ranchers, and often trapping and killing them seems to
be the only solution. The table in the margin gives data in a certain county for the
average number of coyote pups in a litter in a given year and the number of coyotes
killed in that year.
(a) Make a scatter plot of the relation between litter size and number of coyotes killed.
(b) What trend do you detect from your graph?
41. Blood Pressure Data A man has his blood pressure and weight measured at his
annual physical exam. The table below shows these data for a 10-year period.
(a) Make a scatter plot of the year and the systolic pressure. Describe any trends you
detect from the graph.
(b) Make a scatter plot of the weight and systolic pressure. Describe any trends you
detect from the graph.