Stewart J. College Algebra: Concepts and Contexts
Подождите немного. Документ загружается.


Solutions Builder
This is an electronic version of the complete solutions manual available via the
PowerLecture or Instructor’s Companion Website. It provides instructors with an
efficient method for creating solution sets to homework or exams that can then be
printed or posted.
Enhanced WebAssign
®
Enhanced WebAssign is designed for students to do their homework online. This
proven and reliable system uses pedagogy and content found in Stewart, Redlin,
Watson, and Panman’s text and enhances it to help students learn college algebra
more effectively. Automatically graded homework allows students to focus on their
learning and get interactive study assistance outside of class.
Electronic Test Bank (0-495-38793-2)
April Strom—Scottsdale Community College
The Test Bank includes every problem that comes loaded in ExamView in easy-to-
edit Word
®
documents.
xviii ANCILLARIES

This textbook was written for you. With this book you will learn how you can use al-
gebra in your daily life and in your other courses. Here are some suggestions to help
you get the most out of your course.
This book tells the story of how algebra explains many things in the real-world.
So make sure you start from the beginning, and don’t miss any of the topics that your
teacher assigns. You should read the appropriate section of the book before you at-
tempt your homework exercises. You may find that you need to reread a passage sev-
eral times before you understand it. Pay special attention to the examples, and work
them out yourself with pencil and paper as you read. Then do the linked exercises re-
ferred to in the “Now Try Exercise . . .” at the end of each example. You may want to
obtain the Study Guide that accompanies this book. This guide shows you how to
read and understand the examples and explains the purpose of each step. The guide
also contains worked-out solutions to many of the exercises that are linked to the
examples.
To learn anything well requires practice. In studying algebra, a little practice
goes a long way. This is because the concepts learned in one situation apply to many
others. Pay special attention to the Context exercises (word problems); these exer-
cises explain why we study algebra in the first place.
Answers to odd-numbered exercises as well as to all Concepts exercises, Alge-
bra Checkpoints, and Chapter Tests appear at the back of the book.
Have a great semester.
The authors
TO THE STUDENT
xix

Cal Calorie
cm centimeter
dB decibel
ft foot
g gram
gal gallon
h hour
Hz Hertz
in. inch
kg kilogram
km kilometer
L liter
lb pound
lm lumen
M mole of solute
per liter of solution
m meter
mg milligram
ABBREVIATIONS
xx
MHz megahertz
MW megawatt
mi mile
min minute
mL milliliter
mm millimeter
N Newton
qt quart
oz ounce
s second
⍀ ohm
V volt
W watt
yd yard
yr year
°C degree Celsius
°F degree Fahrenheit
K Kelvin
PROLOGUE
P1
Algebra and Alcohol
Algebra helps us better understand many real-world situations. In this prologue we
preview how the topics we learn in this book can help us to analyze a major social
issue: the overconsumption of alcohol.
People have been drinking alcoholic beverages since prehistoric times to enliven
social occasions—but frequently also to ill effect. Overconsumption of alcohol is
widely perceived as a major social problem on college campuses. How can we pre-
dict the effects of different levels of drinking? How can guidelines for responsible
drinking be established? The answers to these questions involve a combination of
science, data collection, and algebra. Let’s examine the process.
Investigating the Science
Biomedical scientists study the chemical and physiological changes in the body that
result from alcohol consumption. They have found that the reaction in the human
body occurs in two stages: a fairly rapid process of absorption and a more gradual
one of metabolism.
The term absorption refers to the physical process by which alcohol passes from
the stomach to the small intestine and then into the bloodstream. After one standard
drink (defined as 12 ounces of beer, 5 ounces of wine, or 1.5 ounces of 80-proof dis-
tilled spirits, which contain equivalent amounts of alcohol), the blood alcohol con-
centration (BAC) peaks within 30 to 45 minutes. Several factors influence the rate of
absorption; the presence and type of food before drinking, medication, and the gen-
der and ethnicity of the drinker all play a role.
The term metabolism refers to chemical processes in the body through which in-
gested substances are converted to other compounds. One of these processes is oxi-
dation, in which alcohol is detoxified and removed from the blood (primarily in the
liver), preventing the alcohol from accumulating and destroying cells. Alcohol is ox-
idized to acetaldehyde by the enzyme ADH (alcohol dehydrogenase). Usually, ac-
etaldehyde is itself metabolized quite rapidly and doesn’t accumulate. But when a
person drinks large amounts of alcohol, the accumulation of acetaldehyde can cause
headaches, nausea, and dizziness, contributing to a hangover. The rate of alcohol me-
tabolism depends on the amounts of certain enzymes in the liver, and these amounts
vary from person to person.
Collecting the Data
To predict the effect of different amounts of alcohol consumption, we need to know
the rate at which alcohol is absorbed and metabolized. The starting point is to ex-
periment and collect data. For example, in a medical study, researchers measured
the BAC of eight fasting adult male subjects after rapid consumption of different
amounts of alcohol. Table 1 on the next page shows the data they obtained after av-
eraging the measurements from the eight subjects.
P2 PROLOGUE
*P. Wilkinson, A. Sedman, E. Sakmar, D. Kay, and J. Wagner,
“Pharmacokinetics of Ethanol After Oral Administration in the
Fasting State,” Journal of Pharmacokinetics and Biopharmaceutics,
5(3): 207–224, 1977.
Concentration (mg/mL) after 95%
ethanol oral dose of:
Time (h) 15 mL 30 mL 45 mL 60 mL
0.0 0.0 0.0 0.0 0.0
0.067 0.032 0.071 — —
0.133 0.096 0.019 — —
0.167 — — 0.28 0.30
0.2 0.13 0.25 — —
0.267 0.17 0.30 — —
0.333 0.16 0.31 0.42 0.46
0.417 0.17 — — —
0.5 0.16 0.41 0.51 0.59
0.667 — — 0.61 0.66
0.75 0.12 0.40 — —
0.833 — — 0.65 0.71
1.0 0.090 0.33 0.63 0.77
1.167 — — 0.59 0.75
1.25 0.062 0.29 — —
1.33 — — 0.53 0.70
1.5 0.033 0.24 0.50 0.71
1.75 0.020 0.22 0.43 0.72
2.0 0.012 0.18 0.40 0.64
2.25 0.0074 0.15 — —
2.5 0.0052 0.12 0.32 0.57
2.75 0.0034 — — —
3.0 0.0024 0.069 0.28 0.45
3.5 — 0.034 0.22 0.43
3.75 — 0.017 — —
4.0 — 0.010 0.15 0.36
4.25 — 0.0068 — —
4.5 — 0.0052 0.081 0.27
4.75 — 0.0037 0.059 0.22
5.0 — — 0.042 0.18
5.25 — — 0.021 0.15
5.5 — — 0.014 0.11
5.75 — — 0.0099 0.079
6.0 — — 0.0056 0.050
6.25 — — — 0.037
6.5 — — — 0.020
6.75 — — — 0.017
7.0 — — — 0.012
table 1
Mean fasting ethanol concentration (mg/mL) at indicated
sampling times following the oral administration of four
different doses of ethanol to eight adult male subjects*
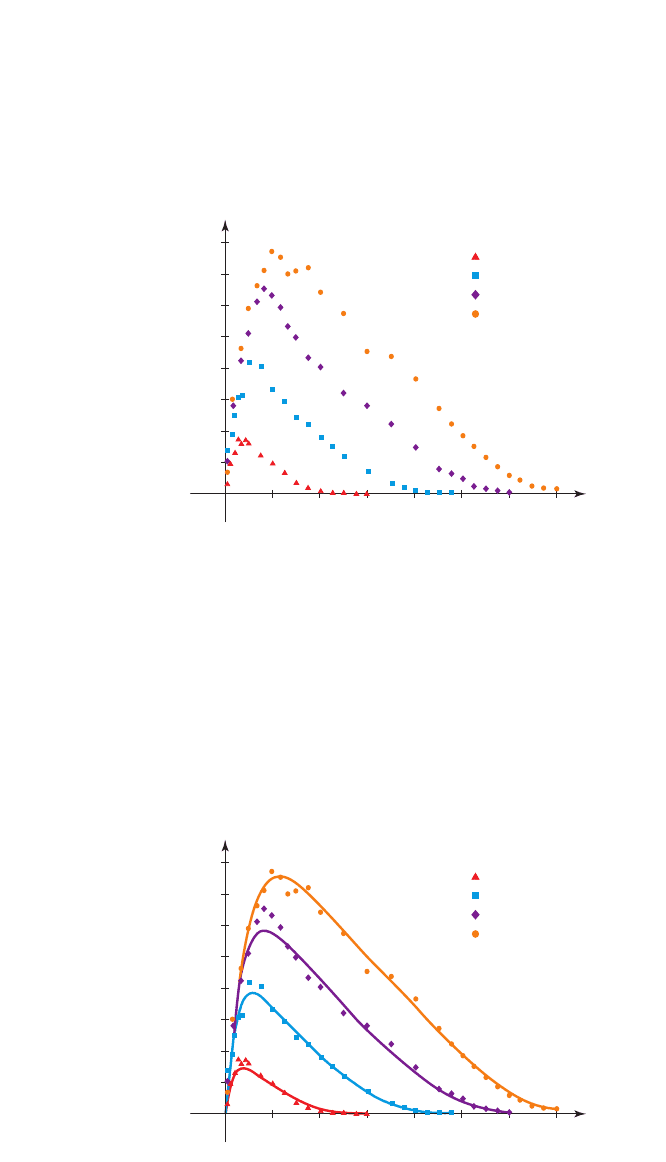
Using Algebra to Make a Model
It’s difficult to discern patterns by looking at the mass of data in Table 1. In the first
section of this book we discuss the general problem of how to make sense of nu-
merical information by visualizing data in the form of scatter plots. Figure 1 shows
a scatter plot of the data from that experiment. The horizontal axis represents time in
hours, and the vertical axis represents mean blood alcohol concentration in mil-
ligrams per milliliter.
PROLOGUE P3
y
x
0
12
Blood alcohol
(mg/mL)
3
Time
(
h
)
5764
1 Drink
2 Drinks
3 Drinks
4 Drinks
0.1
0.2
0.3
0.4
0.8
0.7
0.6
0.5
figure 1 Scatter plot of data
y
x
0
12
Blood alcohol
(mg/mL)
3
Time
(
h
)
5764
1 Drink
2 Drinks
3 Drinks
4 Drinks
0.1
0.2
0.3
0.4
0.8
0.7
0.6
0.5
figure 2 Graphs of equations that model the data
We see from the graph that the absorption of alcohol happens relatively quickly,
whereas metabolism (represented by the declining portion of the graph) is more
gradual. We also see the effects of having several drinks. In Chapter 3 we will see
how to model the metabolism part of the curves with exponential functions. As we
learn more about algebra, we will be able to improve and extend our model, so we
revisit this topic in exercises throughout the book. In Chapter 6 we will see how to
construct equations that model the entire process (absorption and metabolism). The
curves in Figure 2 are graphs of these equations. (See Exploration 4 on page 563.)

Getting Information from the Model
The purpose of making a model is to get useful information about the process being
modeled. In this case we can use the model to predict the probable effect over time
of any number of drinks. Such predictions enable social agencies to publish guide-
lines to help people make responsible choices about their drinking behavior.
This example is typical of the mathematical modeling process. We will en-
counter many other situations throughout this book in which we use algebra to con-
struct our own model and then use the model to make important conclusions.
P4 PROLOGUE
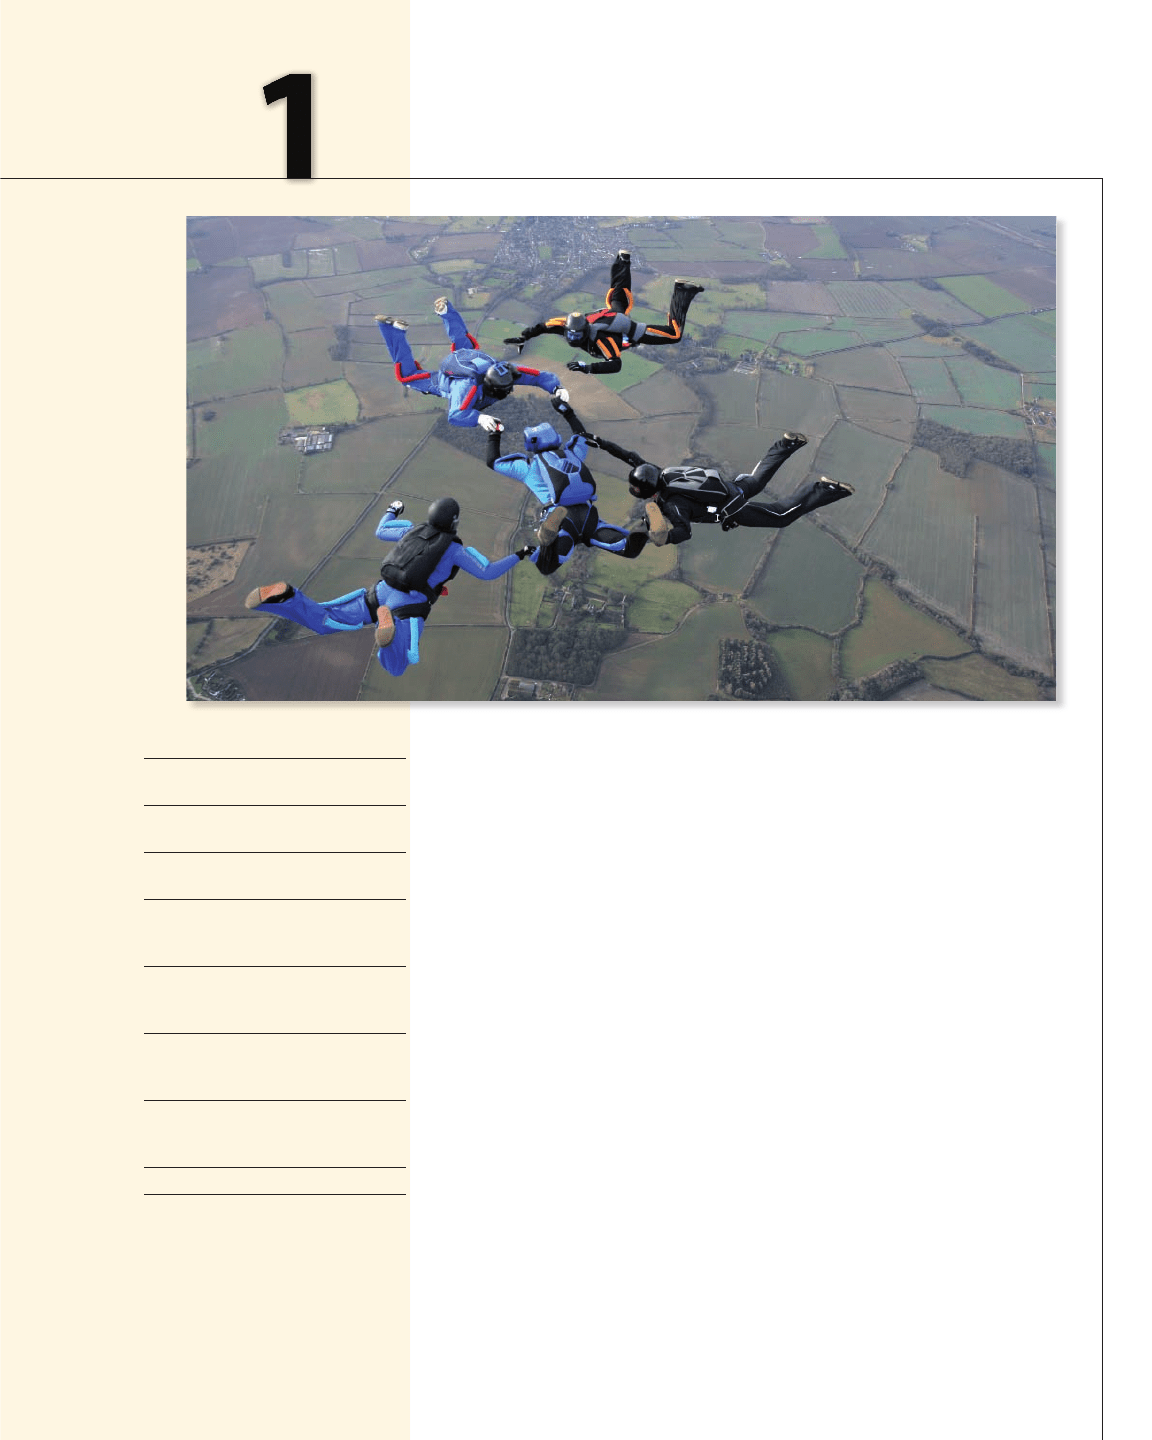
1
Do you know the rule? We need to know a lot of rules for our everyday
living—such as the rule that relates the amount of gas left in the gas tank to
the distance we’ve driven or the rule that relates the grade we get in our
algebra course to our exam scores. If we’re more adventuresome, like the
skydivers in the photo above, we may also need to know the rule that relates
the distance fallen to the time we’ve been falling. Rules like these are
expressed in algebra using functions; they are discovered by collecting data
and looking for patterns in the data. You may collect data that describe how
much gas your car uses at different speeds, how many calories you burn for
different jogging times, or how far an object falls in a given time. Once a rule
(or model) has been discovered, it allows us to predict how things will turn
out—how far we can drive before running out of gas, how much weight we
lose if we jog for so long, or how far a skydiver falls in a given length of time.
Knowing this last rule allows us to enjoy skydiving . . . safely!
1.1 Making Sense of Data
1.2 Visualizing Relationships
in Data
1.3 Equations: Describing
Relationships in Data
1.4 Functions: Describing
Change
1.5 Function Notation:
The Concept of Function
as a Rule
1.6 Working with Functions:
Graphs and Graphing
Calculators
1.7 Working with Functions:
Getting Information from
the Graph
1.8 Working with Functions:
Modeling Real-World
Relationships
1.9 Making and Using Formulas
EXPLORATIONS
1
Bias in Presenting Data
2 Collecting and Analyzing
Data
3 Every Graph Tells a Story
Data, Functions,
and Models
Joggie Botma/Shutterstock.com 2009

2 CHAPTER 1
■
Data, Functions, and Models
2
1.1 Making Sense of Data
■
Analyzing One-Variable Data
■
Analyzing Two-Variable Data
IN THIS SECTION… we learn about one-variable and two-variable data and the
different questions we can ask and answer about the data.
From the first few minutes of life our brains are exposed to large amounts of data,
and we must process and use the data to our advantage—sometimes even for our
very survival. For example, after several small falls, a child begins to process the
“falling down” data and concludes that the farther he falls, the more it hurts. The
child sees the trend and reasons that “if I fall from a very great height, I’ll be so
badly hurt I may not survive.” So as the child comes close to the edge of a 100-foot
cliff for the first time, he’s cautious of the height. Although the cliff is a new expe-
rience, the child is able to predict what would happen on the basis of the data he al-
ready knows. Fortunately, a child doesn’t need to experience a 100-foot fall to know
the probable result!
In general, in trying to understand the world around us, we make measurements
and collect data. For example, a pediatrician may collect data on the heights of chil-
dren at different ages, a scientist may collect data on water pressure in the ocean at dif-
ferent depths, or the weather section of your local newspaper may publish data on the
temperature at different times of the day. Massive amounts of data are posted each day
on the Internet and made available for research. In general, data are simply huge lists
of numbers. To make sense of all these numbers, we need to look for patterns or trends
in the data. Algebra can help us find and accurately describe hidden patterns in data.
In this section we begin our study of data by looking at some of their basic properties.
2
■ Analyzing One-Variable Data
The ages of children in a certain group of preschoolers are
This list is an example of one-variable data—only one varying quantity (age) is
listed. One way to make sense of all these numbers is find a “typical” number for the
data or the “center” of the data. Any such number is called a measure of central ten-
dency. One such number is the average (or mean) of the data. The average is sim-
ply the sum of the numbers divided by how many there are.
Average
2, 2, 2, 3, 3, 3, 4, 4, 4, 4, 4, 5
The average of a list of n numbers is their sum, divided by n.
For example, if your scores on five tests are 50, 58, 78, 81, and 93, then your aver-
age test score is
50 + 58 + 78 + 81 + 93
5
= 72

SECTION 1.1
■
Making Sense of Data 3
Intuitively, the average is where these numbers balance, as shown in the figure
in the margin.
example
1
Average Age of Preschoolers
The ages of the children in a certain class of preschoolers are given in the table. Find
the average age of a preschooler in this class.
Solution
Since the number of children in the class is 12, we find the average by adding the
ages of the children and dividing by 12:
So the average age of a preschooler in this class is about 3.3 years.
■ NOW TRY EXERCISE 15 ■
Another measure of central tendency is the median, which is the “middle” num-
ber of a list of ordered numbers.
Median
2 + 2 + 2 + 3 + 3 + 3 + 4 + 4 + 4 + 4 + 4 + 5
12
=
40
12
L 3.3
50 58 72 78 81 93
Suppose we have an ordered list of n numbers.
(a) If n is odd, the median is the middle number.
(b) If n is even, the median is the average of the two middle numbers.
For example, if your scores on five tests are 50, 58, 78, 81, and 93, then your median
test score is 78, the middle score—two test scores are above 78, and two test scores
are below 78.
Age (yr) 2 2 2 3 3 3 4 4 4 4 4 5
50 58 78 81 93
example
2
Average and Median Income
The yearly incomes of five college graduates are listed in the table below.
(a) Find the average income of these five college graduates.
(b) Find the median income of these five college graduates.
(c) How many data points are greater than the median? Than the average?
(d) Does the average income or the median income give a better description of the
“central tendency” of these incomes?
Income (thousands of dollars) 280 56 59 62 53