Stewart J. College Algebra: Concepts and Contexts
Подождите немного. Документ загружается.

294 CHAPTER 3
■
Exponential Functions and Models
an estimated yearly return of 6%, and a real estate fund with an estimated yearly return
of 17%.
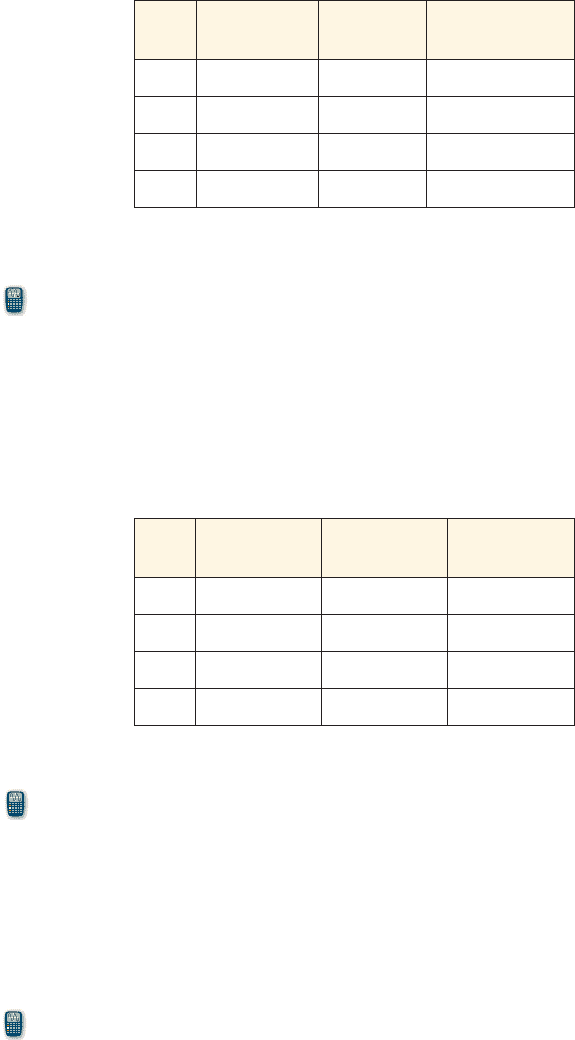
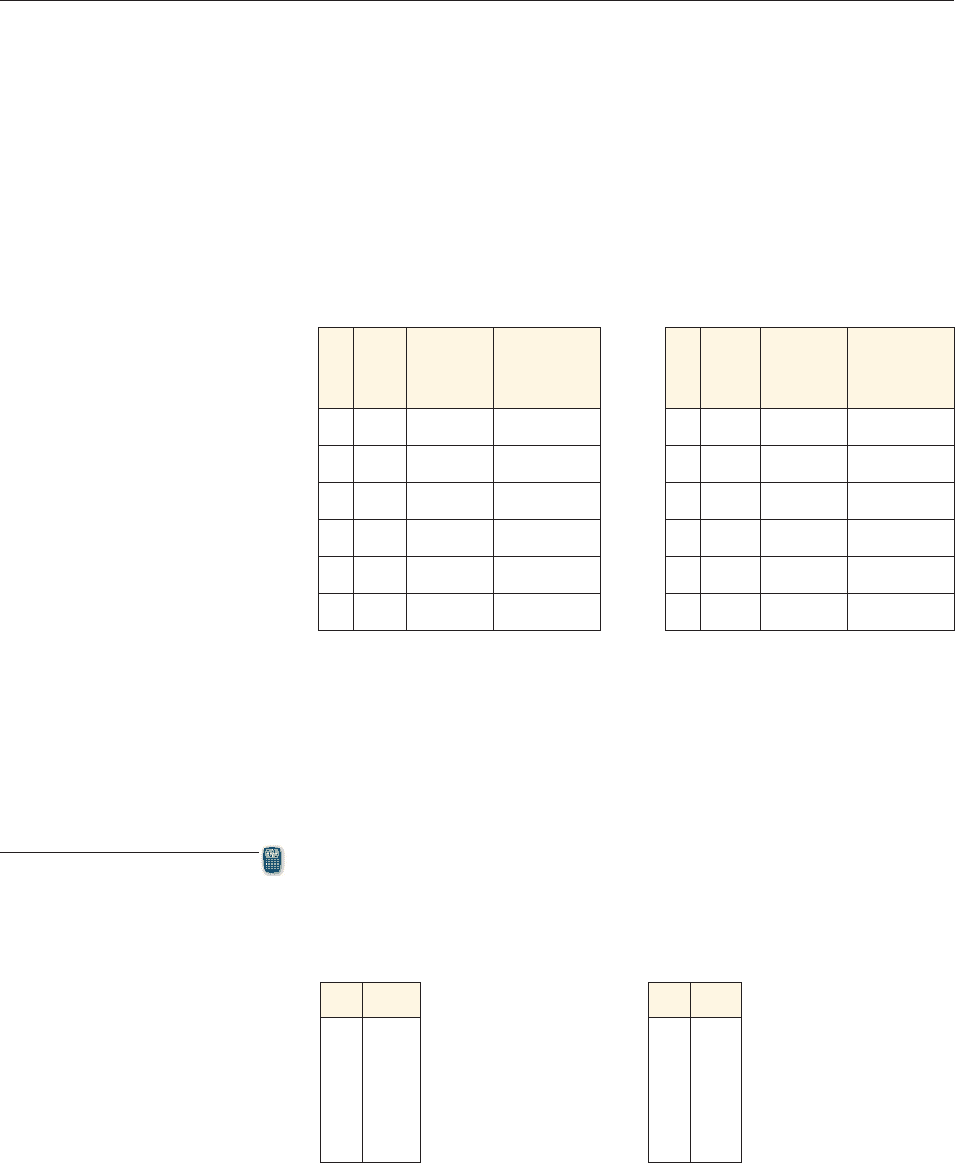
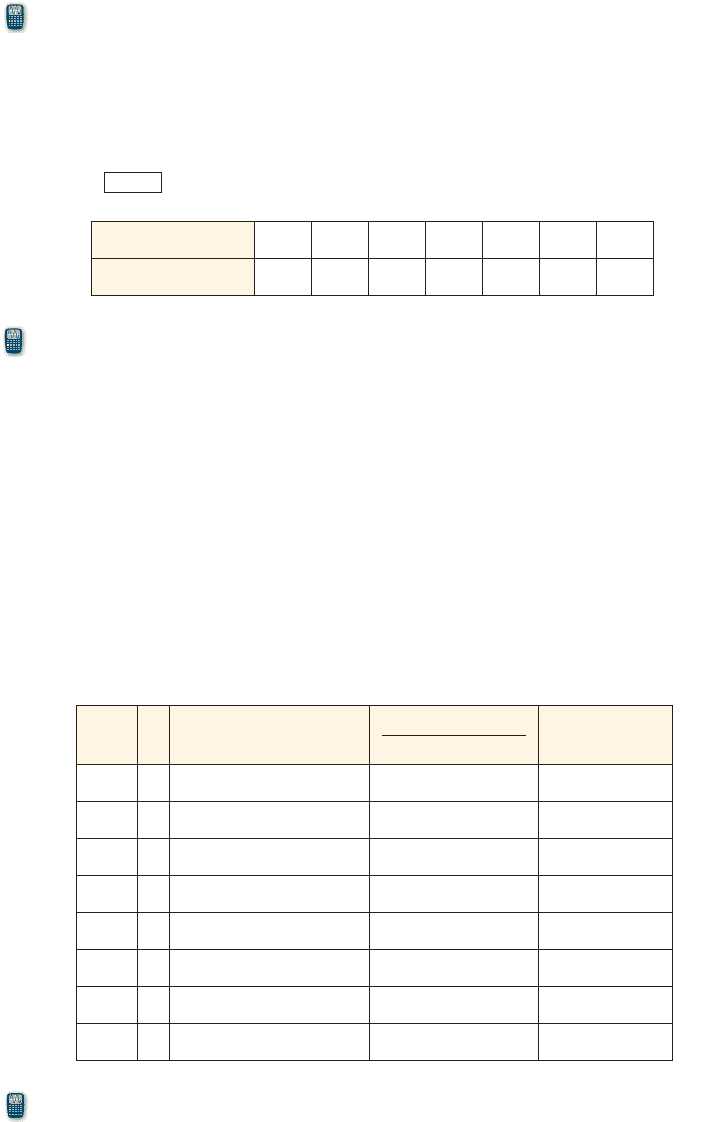
(a) Complete the table for the yearly value of each investment at the beginning of the
given year.
Year
Growth fund
value ($)
Bond fund
value ($)
Real estate fund
value ($)
2005
2000 2000 2000
2006
2007
2008
(b) Find exponential growth models for each of Marina’s investments t years since
2005.
(c) Graph the functions found in part (b) for t between 0 and 10. Explain how the
expected yearly returns affect the graphs.
(d) Predict the value of each investment in 2011.
36. Investment Value On January 1, 2005, Isabella invested a total of $15,000 in three
different bond funds, each with an expected yearly return of 5.5%. She invested $2000
in Bond Fund A, $4000 in Bond Fund B, and $9000 in Bond Fund C.
(a) Complete the table for the value of each investment at the beginning of the given
year.
(b) Find exponential growth models for Isabella’s investments t years since 2005.
(c) Graph the functions found in part (b) for t between 0 and 10. Compare how the
initial values affect the graphs.
(d) Predict the value of each investment in 2011.
37. Health-Care Expenditures U.S. health-care expenditures have been growing
exponentially during the past two decades. In 2008, expenditures were 2.4 trillion
dollars with a growth rate of 9%. Lawmakers hope to decrease the annual growth rate to
2%. Compare the two rates graphically and algebraically as follows.
(a) For each growth rate, find an exponential model for the health-care expenditures
t years since 2008.
(b) Graph the models for the years 2008 to 2020. What do the graphs tell us about the
health-care expenditures?
(c) Find the predicted health-care expenditures in 2020 for each model.
Year
Bond Fund A
value ($)
Bond Fund B
value ($)
Bond Fund C
value ($)
2005
2000 4000 9000
2006
2007
2008
SECTION 3.5
■
Fitting Exponential Curves to Data 295
2
3.5 Fitting Exponential Curves to Data
■
Finding Exponential Models for Data
■
Is an Exponential Model Appropriate?
■
Modeling Logistic Growth
IN THIS SECTION… we learn to fit exponential curves to data and to recognize when
these curves are appropriate for modeling data. We also fit logistic curves to data.
GET READY… by reviewing Section 2.5 on fitting lines to data.
In Section 2.5 we learned how to find the line that best fits data—the line models the
increasing or decreasing trend of the data. But what if a scatter plot of the data does
not reveal any linear trend? In general, the shape of a scatter plot can help us choose
the type of curve to use in modeling the data.
38. Algebra and Alcohol After alcohol is fully absorbed into the body, it is metabolized
with a half-life of 1.5 hours. Suppose Tom consumes 30 mL of alcohol (ethanol) and
Ted consumes 15 mL.
(a) Find exponential decay models for the amount of alcohol remaining in each
person’s body after t hours.
(b) Graph the functions in part (a) for t between 0 and 4. What do the graphs tell us
about the amount of alcohol remaining?
(c) Find the predicted amount of alcohol remaining in each person’s body after 2 hours.
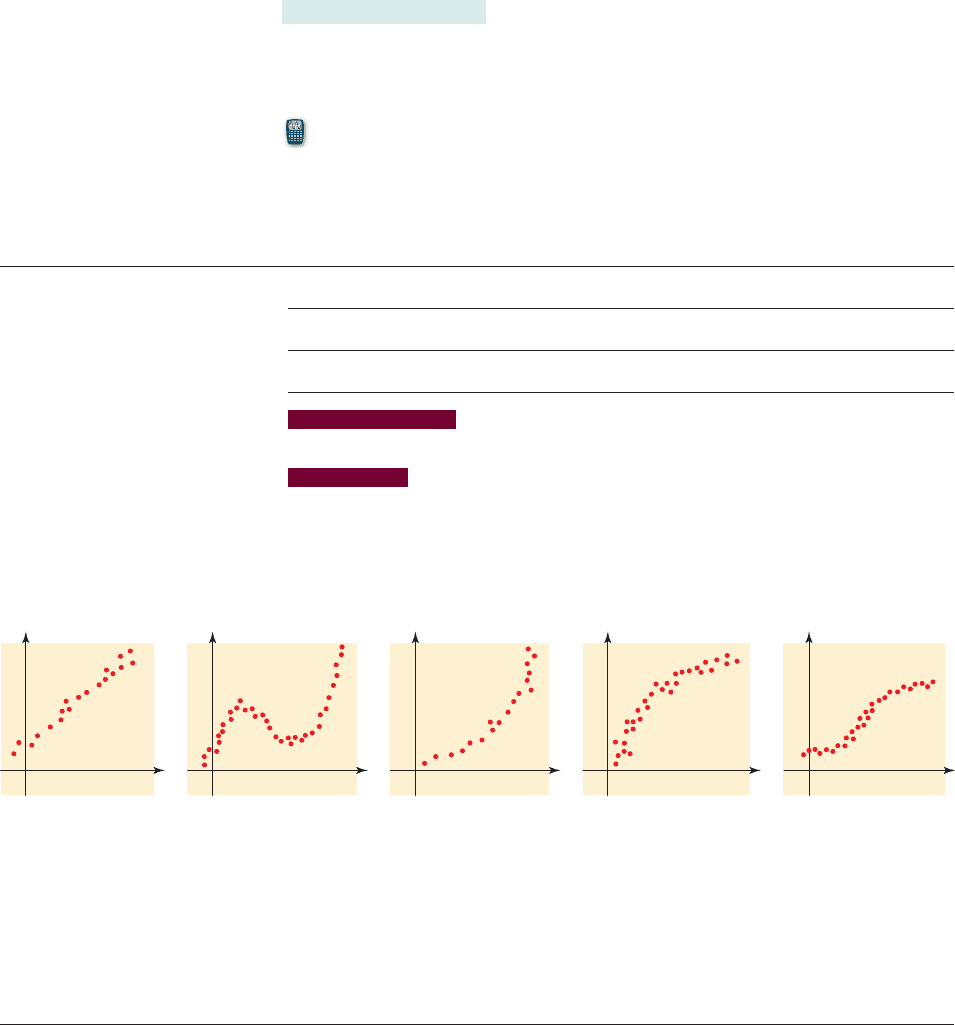
For example, the first plot in Figure 1 fairly begs for a line to be fitted through
it. For the third plot, it seems that an exponential curve might fit better than a line.
How do we decide which curve is the more appropriate model? We’ll see that the
properties of exponential curves that we studied in the preceding sections will help
us to answer this question.
figure 1 Scatter plots of data
2
■ Finding Exponential Models for Data
If a scatter plot shows that the data increase rapidly, we might want to model the data
using an exponential model, that is, a function of the form
where C and a are constants. In the first example we model world population by
an exponential model. Recall from Section 3.1 that population tends to increase
exponentially.
f 1x2= Ca
x
296 CHAPTER 3
■
Exponential Functions and Models
example
1
An Exponential Model for World Population
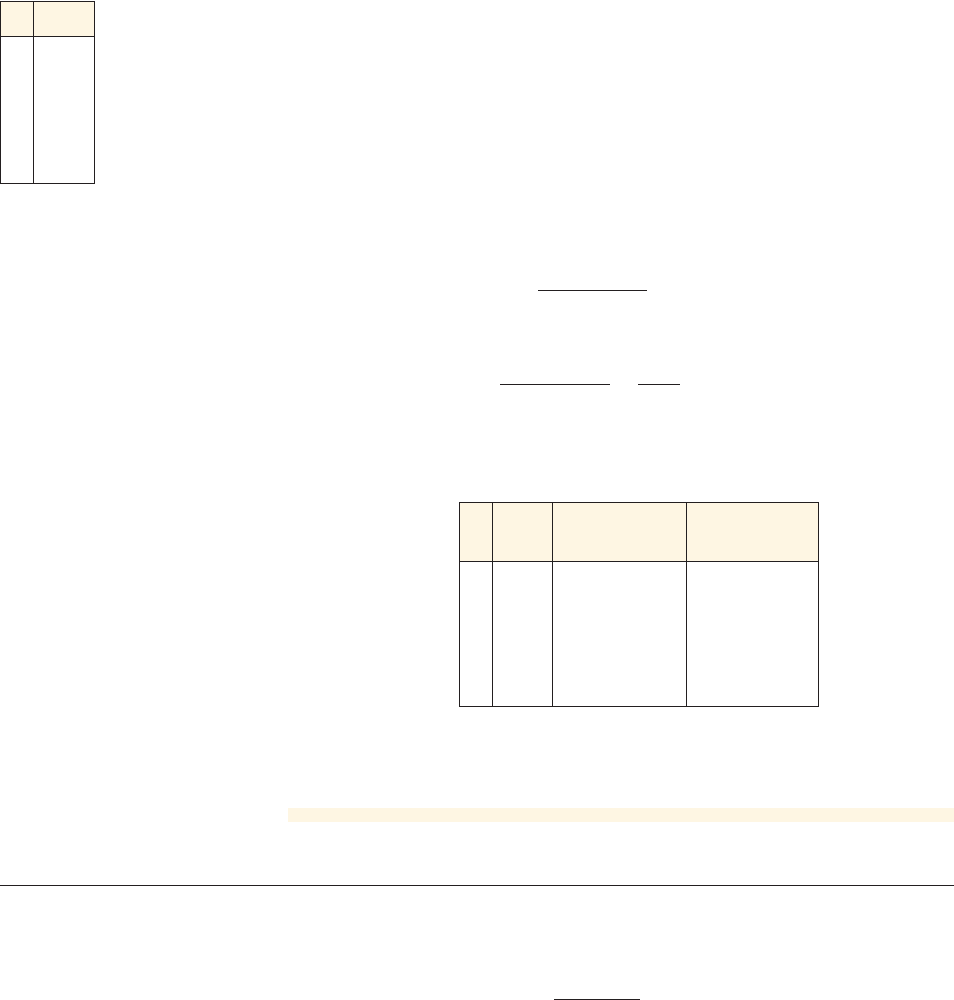
Table 1 shows how the world population has changed in the 20th century.
(a) Draw a scatter plot and note that a linear model is not appropriate.
(b) Find an exponential function that models the data.
(c) Draw a graph of the function you found together with the scatter plot. How
well does the model fit the data?
(d) Use the model you found to predict world population in 2020.
Solution
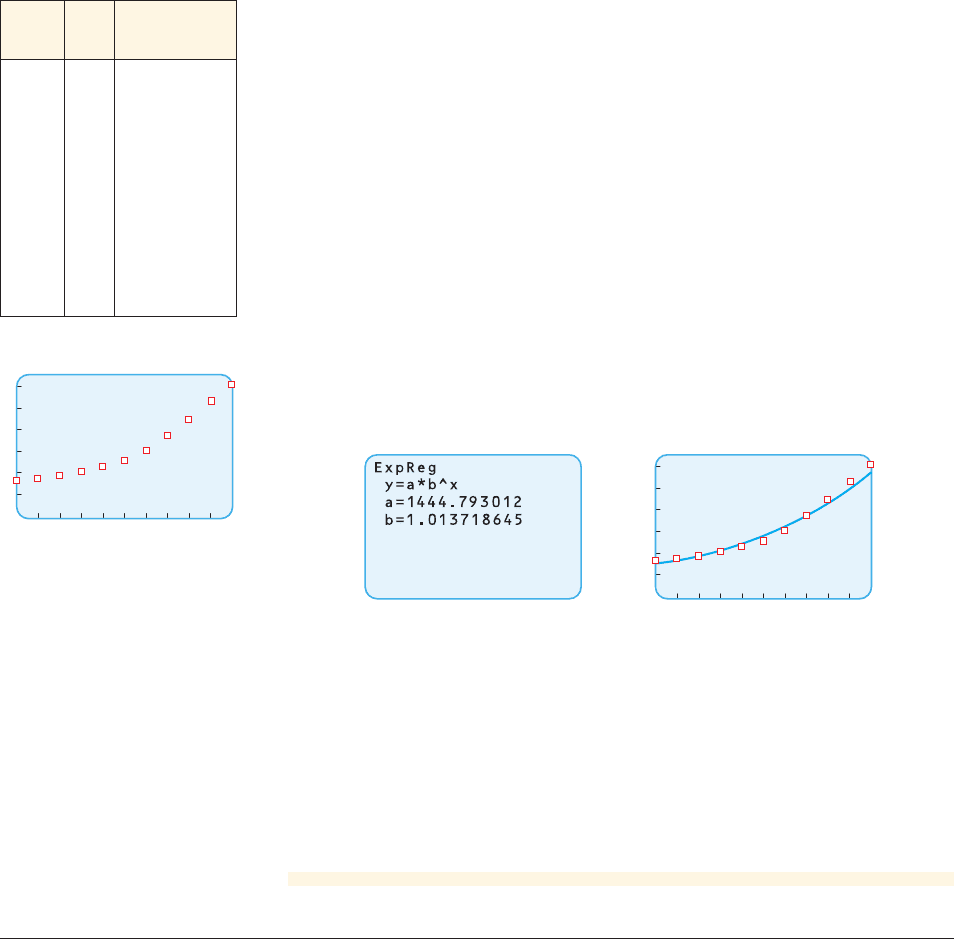
(a) The scatter plot is shown in Figure 2. The plotted points do not appear to lie
along a straight line, so a linear model is not appropriate.
(b) Using a graphing calculator and the
ExpReg command (see Figure 3(a)), we
get the exponential model
(c) From the graph in Figure 3(b) we see that the model appears to fit the data
fairly well. The period of relatively slow population growth is explained by the
depression of the 1930s and the two world wars.
P 1t2= 144511.0137 2
t
table 1
World population
Year x
Population P
(millions)
1900 0 1650
1910 10 1750
1920 20 1860
1930 30 2070
1940 40 2300
1950 50 2520
1960 60 3020
1970 70 3700
1980 80 4450
1990 90 5300
2000 100 6060
6500
100
0
figure 2
Scatter plot of world population
6500
100
0
(a) (b)
figure 3 Exponential model for world population
(d) The model predicts that the world population in 2020 (when x is 120) will be
So the model predicts a population of about 7400 million in 2020.
■ NOW TRY EXERCISE 13 ■
L 7396
P 1120 2= 144511.01372
120
2
■ Is an Exponential Model Appropriate?
Here is a way to tell whether an exponential model is appropriate. Recall from
Section 3.4 that for equally spaced data the percent rate of change between consec-
utive points is constant. So if the inputs of our data are equally spaced, we can cal-
culate the percent rate of change and see whether they are approximately constant.
If they are, this would indicate that an exponential model is appropriate.
SECTION 3.5
■
Fitting Exponential Curves to Data 297
example
2
Using Percentage Rate of Change
A set of data is given in Table 2.
(a) Find the average rate of change and percentage rate of change between
consecutive data points.
(b) Determine whether a linear model or an exponential model is more appro-
priate.
Solution
(a) We first note that the inputs x are equally spaced, so we calculate the net
change and the percent rate of change between consecutive data points
(see the table below). Here is how the entries in the second row are
calculated:
■
The average rate of change in y from 0 to 1 is
■
The percentage rate of change in y from 0 to 1 is
Expressed in percentage form, this last fraction is 28%. The remaining rows of
the table are calculated in the same way.
1921 - 1500
1500
=
421
1500
L 0.28
1921 - 1500
1 - 0
= 421
table 2
Data
x y
0 1500
1 1921
2 2366
3 2798
4 3237
5 3688
x
f 1x 2
Average
rate of change
Percentage
rate of change
0 1500 — —
1 1921 421 28%
2 2356 435 23%
3 2784 428 18%
4 3215 431 15%
5 3638 423 13%
(b) Since the average rate of change is approximately constant (but the percentage
rate of change is decreasing), a linear model is more appropriate.
■ NOW TRY EXERCISE 9 ■
2
■ Modeling Logistic Growth
In Section 3.3 we learned that a logistic growth model is a function of the form
where a, b, and C are positive constants. Logistic functions are used to model pop-
ulations in which the growth is constrained by available resources. When a graph-
ing calculator is used to find the logistic function that best fits a given set of data,
N =
C
1 + b
#
a
-x
a 7 1
298 CHAPTER 3
■
Exponential Functions and Models
example
3
Stocking a Pond with Catfish
Much of the fish sold in supermarkets today is raised on commercial fish farms, not
caught in the wild. A pond on one such farm is initially stocked with 1000 catfish,
and the fish population is then sampled at 15-week intervals to estimate its size. The
population data are given in Table 3.
(a) Find an appropriate model for the data.
(b) Make a scatter plot of the data and graph the model you found in part (a) on
the scatter plot.
(c) What does the model predict about how the fish population will change with
time?
Solution
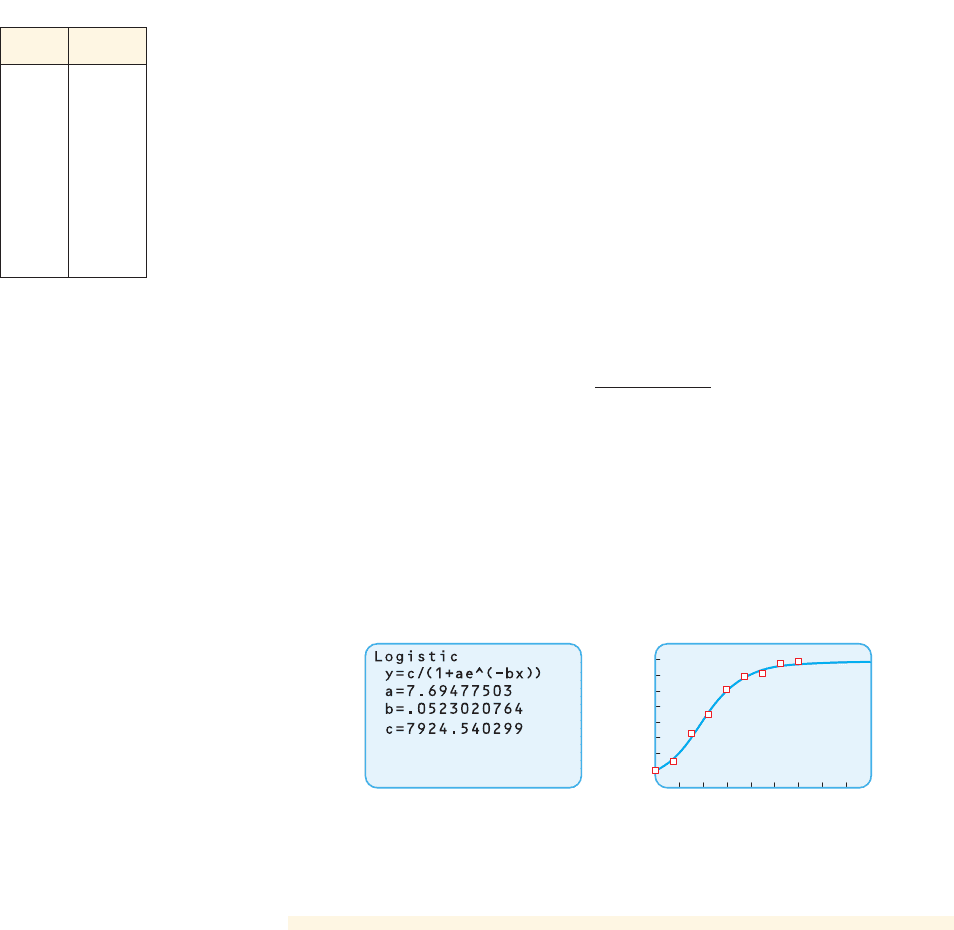
(a) Since the catfish population is restricted by its habitat (the pond), a logistic
model is appropriate. Using the Logistic command on a calculator (see
Figure 4(a)), we find the following model for the catfish population :
where e is about 2.718.
(b) The scatter plot and the logistic curve are shown in Figure 4(b).
(c) From the graph of P in Figure 4(b) we see that the catfish population increases
rapidly until about 80 weeks. Then growth slows down, and at about
120 weeks the population levels off and remains more or less constant at
slightly over 7900.
P 1t2=
7925
1 + 7.7e
-0.052t
P 1t2
table
3
Week Catfish
0 1000
15 1500
30 3300
45 4400
60 6100
75 6900
90 7100
105 7800
120 7900
180
9000
0
(a) (b) Catfish population y=P(t)
figure 4
■ NOW TRY EXERCISE 19 ■
The behavior exhibited by the catfish population in Example 3 is typical of lo-
gistic growth. After a rapid growth phase, the population approaches a constant level
called the carrying capacity of the environment (see Section 3.2).
the calculator uses the base e, which is approximately 2.718. We’ll study the num-
ber e in more detail in Section 4.5. For now, we’ll use the calculator output to graph
models of logistic growth.
SECTION 3.5
■
Fitting Exponential Curves to Data 299
3.5 Exercises
CONCEPTS
Fundamentals
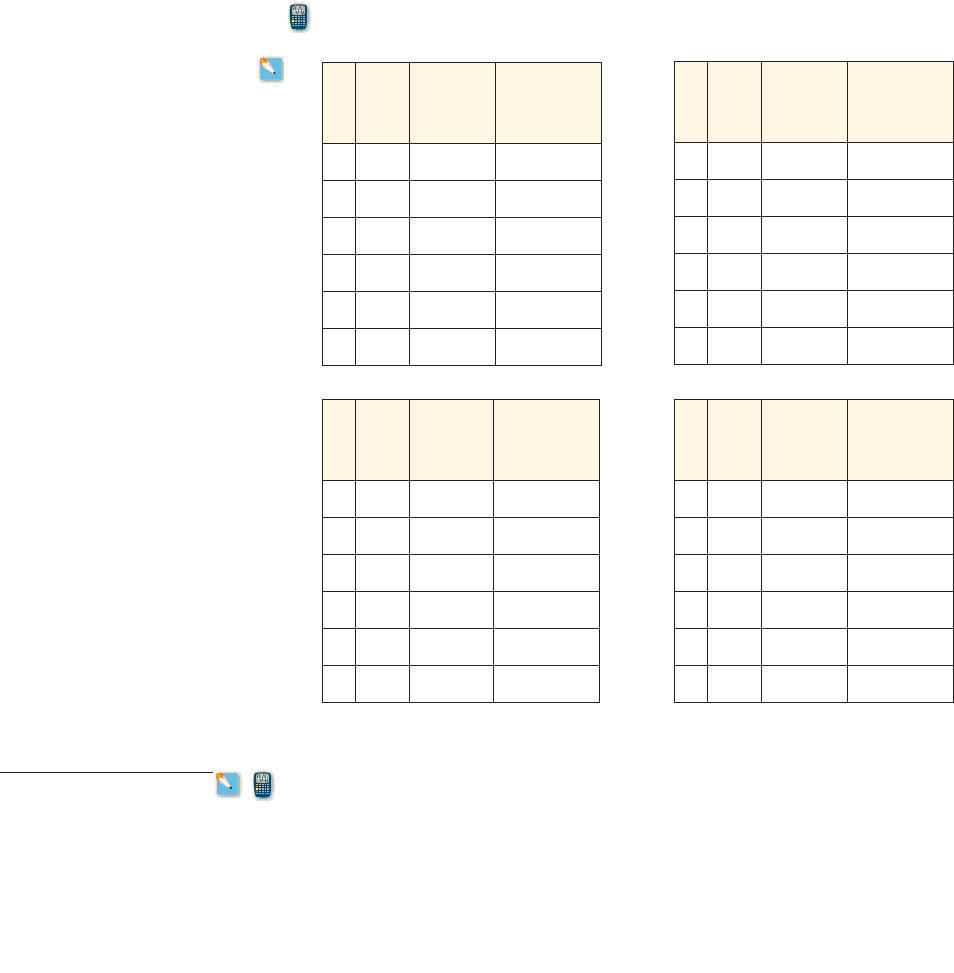
1–4 ■ Two data sets, each with equally spaced inputs, are given below.
1. Complete each table by finding the average rate of change and percentage rate of
change for successive data points.
2. If the average rate of change is constant between successive data points, then
_______
(an exponential/a linear) model is appropriate.
3. If the percentage rate of change is constant between successive data points, then
_______ (an exponential/a linear) model is appropriate.
4. Find an appropriate model for each of the data sets.
Model:
_____________ Model: _____________
x y
Average
rate of
change
Percentage
rate of
change
0 10
1 30
2 50
3 70
4 90
5 110
x y
Average
rate of
change
Percentage
rate of
change
0 10
1 30
2 90
3 270
4 810
5 2430
Think About It
5. Suppose we make a scatter plot of some given data. Can we tell from the scatter plot
whether a linear or exponential model is appropriate?
6. Suppose we have data with equally spaced inputs and we calculate the growth factor
between successive data points. How can we use our calculations to decide whether an
exponential model is appropriate?
7–8
■ A data set is given in the table.
(a) Make a scatter plot of the data.
(b) Use a calculator to find an exponential model for the data.
(c) Graph the model you found in part (b) together with the scatter plot. Does your
model appear to be appropriate?
SKILLS
7. 8.
x y
0 500
3 571
6 647
9 742
12 851
15 978
x y
0 12
2 34
4 99
6 275
8 783
10 2238
x
f 1x 2
Average
rate of
change
Percentage
rate of
change
0 210 — —
1 281
71 34%
2 379
3 512
4 689
5 932
300 CHAPTER 3
■
Exponential Functions and Models
9–12
■ A data set is given, with equally spaced inputs.
(a) Fill in the table to find the average rate of change and the percentage rate of change
between successive data points.
(b) Use your results to determine whether a linear model or an exponential model is
appropriate, and use a calculator to find the appropriate model.
(c) Make a scatter plot of the data and graph the model you found in part (b). Does
your model appear to be appropriate?
9. 10.
x
f 1x 2
Average
rate of
change
Percentage
rate of
change
0 368 — —
1 333
- 35
%- 10
2 299
3 265
4 231
5 196
x
f 1x 2
Average
rate of
change
Percentage
rate of
change
0 441 — —
1 392
- 49
%- 11
2 345
3 296
4 248
5 200
x
f 1x 2
Average
rate of
change
Percentage
rate of
change
0 120 — —
1 202
82 68%
2 337
3 569
4 960
5 1612
11. 12.
13. U.S. Population The U.S. Constitution requires a census every 10 years. The census
data for 1790–2000 are given in the table.
(a) Make a scatter plot of the data. Is a linear model appropriate?
(b) Use a calculator to find an exponential curve that models the
population x years since 1790.
(c) Draw a graph of the function that you found together with the scatter plot. How
well does the model fit the data?
(d) Use your model to predict the population at the 2010 census.
f 1x 2= b
#
a
x
CONTEXTS
SECTION 3.5
■
Fitting Exponential Curves to Data 301
Year x
Population
(millions)
1790 0 3.9
1800 10 5.3
1810 20 7.2
1820 30 9.6
1830 40 12.9
1840 50 17.1
1850 60 23.2
1860 70 31.4
1870 80 38.6
1880 90 50.2
1890 100 63.0
Year x
Population
(millions)
1900 110 76.2
1910 120 92.2
1920 130 106.0
1930 140 123.2
1940 150 132.2
1950 160 151.3
1960 170 179.3
1970 180 203.3
1980 190 226.5
1990 200 248.7
2000 210 281.4
14. Health-Care Expenditures U.S. health-care expenditures for 1970–2008 (reported
by the Centers for Medicare and Medicaid Services) are given in the table below.
(a) Make a scatter plot of the data. Is a linear model appropriate?
(b) Use a calculator to find an exponential curve that models U.S. health-
care expenditures x years since 1970.
(c) Use your model to estimate U.S. health-care expenditures in 2001.
(d) Use your model to predict U.S. health-care expenditures in 2009.
(e) Search the Internet to find reported U.S. health-care expenditures for 2009. How
does it compare with your prediction?
f 1x 2= b
#
a
x
Year x
Health-care
expenditures
(billions of $)
1970 0 75
1975 5 133
1980 10 253
1985 15 439
1990 20 714
1992 22 849
1994 24 962
Year x
Health-care
expenditures
(billions of $)
1996 26 1069
1998 28 1190
2000 30 1353
2002 32 1602
2004 34 1855
2006 36 2113
2008 38 2400
R
R
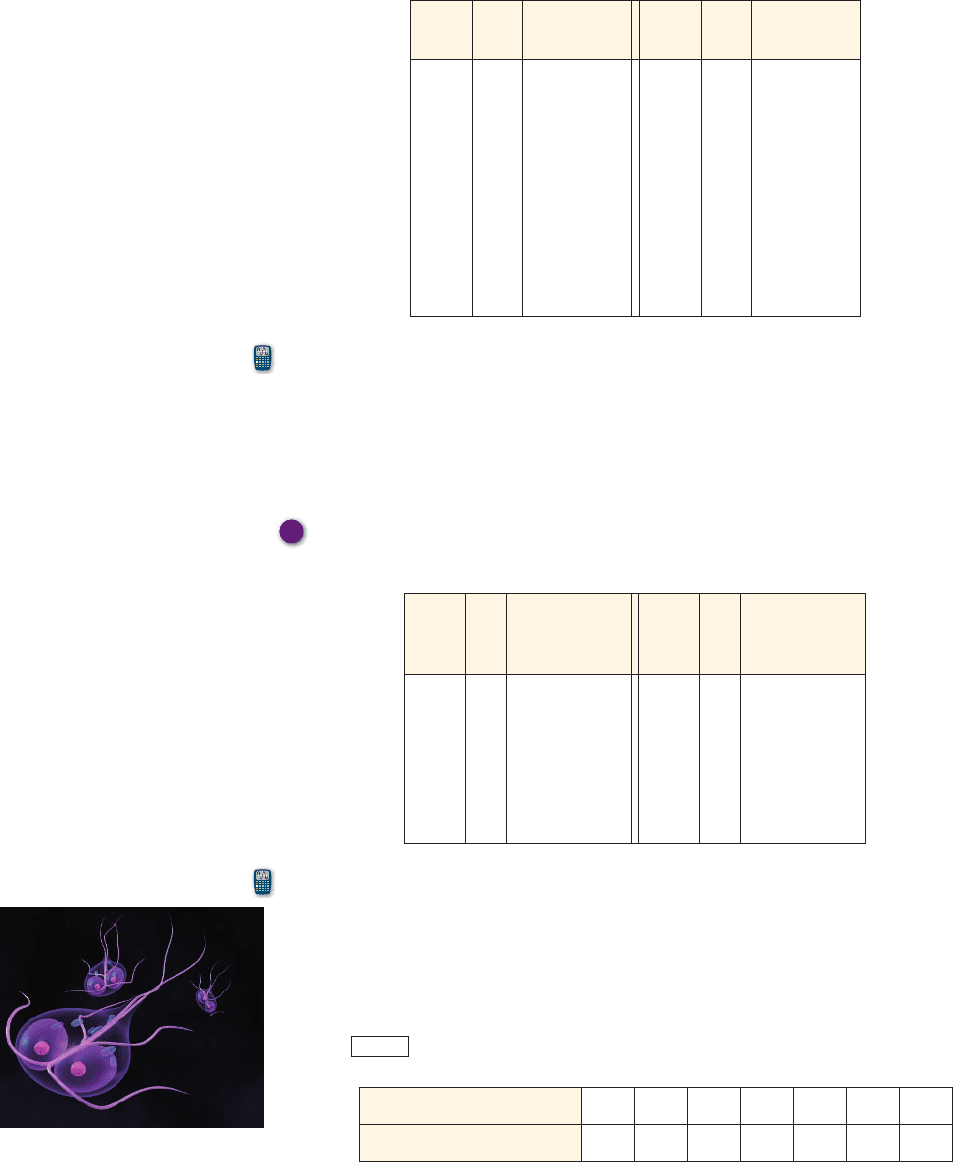
15. Doubling Time of Bacteria A student is trying to determine the doubling time for a
population of the bacterium Giardia lamblia (G. lamblia). He starts a culture in a
nutrient solution and counts the bacteria every 4 hours. His data are shown in the table.
(a) Make a scatter plot of the data.
(b) Use a calculator to find an exponential curve that models the bacteria
population x hours later.
(c) Graph the model from part (b) together with the scatter plot in part (a). Use the
feature to determine how long it takes for the bacteria count to double.
TRACE
f 1x 2= b
#
a
x
G. lamblia
Time (h) 0 4 8 12162024
Bacteria count (CFU/mL) 37 47 63 78 105 130 176
Sebastian Kaulitzki/Shutterstock.com 2009
302 CHAPTER 3
■
Exponential Functions and Models
16. Half-Life of Radioactive Iodine A student is trying to determine the half-life of
radioactive iodine-131. She measures the amount of iodine-131 in a sample solution
every 8 hours. Her data are shown in the table.
(a) Make a scatter plot of the data.
(b) Use a calculator to find an exponential curve that models the amount
of iodine-131 remaining after x hours.
(c) Graph the model from part (b) together with the scatter plot in part (a). Use the
feature to determine the half-life of iodine-131.
TRACE
f 1x 2= b
#
a
x
17. Hybrid Car Sales The table shows the number of hybrid cars sold in the United
States for the period 2000–2007.
(a) Complete the table to find the one-year growth factor for each one-year time period.
For instance, the one-year growth factor for the time period 2000–2001 is the ratio of
the sales in 2001 to the sales in 2000, as calculated in the last two columns in the
table.
(b) Find the “average” one-year growth factor A. Do this by finding the average of all
the growth factors you found in the last column of the table.
(c) It seems reasonable to use the average growth factor in part (b) to construct an
exponential model of the form for the number of hybrid cars sold in
year x. Use your answer from part (b) to construct such a model.
(d) Use a graphing calculator to find the exponential model of best fit for the number
of hybrid cars sold in year x, where represents the year 2000.
(e) Graph the models from (c) and (d) together with a scatter plot of the sales data.
x = 0
f 1x 2= ba
x
Time (h) 0 8 16 24 32 40 48
Amount of (g)
131
I
4.80 4.66 4.51 4.39 4.29 4.14 4.04
Hybrid car sales
Year x
Number of hybrid cars
sold (thousands)
sales in year x ⴙ 1
sales in year x
Growth factor
2000 0 9.5
— —
2001 1 20.3
20.3>9.5
2.14
2002 2 35.0
2003 3 43.4
2004 4 85.0
2005 5 205.8
2006 6 254.5
2007 7 347.1
18. Population of Belgium Many highly developed countries, particularly in Europe, are
finding that their population growth rates are declining and that a logistic function
provides a much more accurate model than an exponential one for their population. The
table gives , the midyear population of Belgium (in millions), for years between
1980 and 2000, where t represents the number of years since 1980.
(a) Use a graphing calculator (TI-89 or better) to find a logistic model for Belgium’s
population.
B1t 2

CHAPTER 3
■
Review 303
(b) Make a scatter plot of the data, using a range of 9.8 to 10.3 on the y-axis. Graph the
logistic function you found in part (a) on the scatter plot. Does it seem to fit the
data well?
(c) What does the model predict about Belgium’s long-term population trend? At what
value will the population level off?
Time (days) 0 2 4 6 8 10 12 16 18
Number of flies 10 25 66 144 262 374 446 494 498
19. Logistic Population Growth The table gives the population of black flies in a closed
laboratory container over an 18-day period.
(a) Use the
Logistic command on your calculator to find a logistic model for these
data.
(b) Graph the model you found in part (a) together with a scatter plot of the data.
(c) According to the model, how does the fly population change with time? At what
value will the population level off?
Year 1980 1982 1984 1986 1988 1990 1992 1994 1996 1998 2000
t 0 2 4 6 8 10 12 14 16 18 20
B 1t 2
9.85 9.86 9.86 9.86 9.88 9.96 10.04 10.11 10.15 10.18 10.19
CHAPTER 3
REVIEW
CONCEPT CHECK
Make sure you understand each of the ideas and concepts that you learned in this chapter,
as detailed below section by section. If you need to review any of these ideas, reread the
appropriate section, paying special attention to the examples.
3.1 Exponential Growth and Decay
Exponential growth and decay are modeled by functions of the form
where f models growth if and decay if . In this model,
■
the variable x is the number of time periods;
■
the base a is the growth or the decay factor; and
■
the constant C is the initial value of f, that is, .
The graph of f has one of the following shapes, depending on whether it is a model
for growth or decay.
C = f 102
0 6 a 6 1a 7 1
f 1x2= Ca
x
a 7 0, a ⫽ 1
CHAPTER
3