Stewart J. College Algebra: Concepts and Contexts
Подождите немного. Документ загружается.

274 CHAPTER 3
■
Exponential Functions and Models
We see that the average rate of change of an exponential function varies dramat-
ically over different intervals; this is very different from the case of a linear function,
in which the average rate of change is the same on any interval. On the other hand,
the percentage rate of change of an exponential function is constant on time periods
of the same length. So if we have data in which the inputs are equally spaced we can
analyze the data as follows:
■
If the average rate of change for consecutive outputs is constant, then there
is a linear model that fits the data exactly. (See Section 1.3.)
■
If the percentage rate of change for consecutive outputs is constant, then
there is an exponential model that fits the data exactly. (See Example 2.)
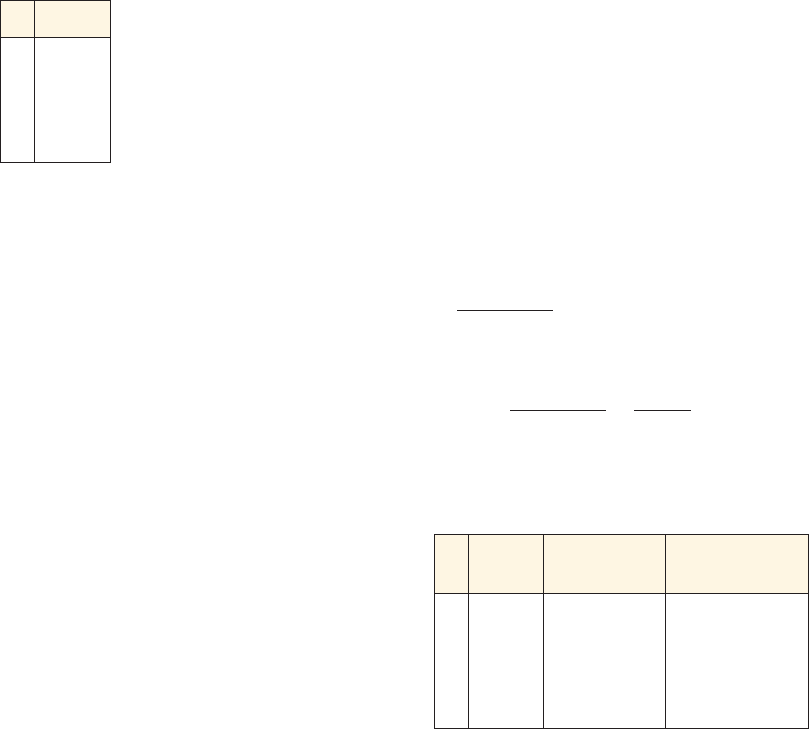
x y
0 10,000
1 7000
2 4900
3 3430
4 2401
example
2
Fitting an Exponential Model to Data
A data set with equally spaced inputs is given.
(a) Find the average rate of change and the percentage rate of change for consecu-
tive outputs.
(b) Is an exponential model appropriate? If so, find the model and sketch a graph
of the model together with a scatter plot of the data.
Solution
(a) We complete the table for the average rate of change and percentage rate
of change as in Example 1. Here’s how we calculate the entries in the
second row.
■
The average rate of change in f from 0 to 1:
■
The change in f from 0 to 1 as a proportion of the value of f at 0 is
So the percentage rate of change is . The remaining rows in the table are
calculated in the same way.
- 30%
r =
f 112- f 102
f 102
=
- 3000
10,000
=-0.30
f 112- f 102
1 - 0
= 7000 - 10,000 =-3000
x
f 1x 2
Average rate
of change
Percentage rate
of change
0 10,000 — —
1 7000
- 3000 - 30%
2 4900
- 2100 - 30%
3 3430
- 1470 - 30%
4 2401
- 1029 - 30%
(b) Since the input values are equally spaced and the percentage rate of change is
constant, an exponential model is appropriate. To find a model of the form
, we first observe that , so C is 10,000. Since the
percentage rate of change is , the decay rate r is , so the decay- 0.30- 30%
f 102= 10,000f 1x2= C
#
a
x
SECTION 3.3
■
Comparing Linear and Exponential Growth 275
12345
0
x
10,000
5000
y
figure 2 f 1x 2= 10,000
#
10.70 2
x
factor is . Thus an exponential model for
the data is
A graph is shown in Figure 2.
■ NOW TRY EXERCISE 13 ■
f 1x 2= 10,000
#
10.70 2
x
a = 1 + r = 1 + 1- 0.302= 0.70
2
■ Comparing Linear and Exponential Growth
Let’s compare linear functions and exponential functions. As we learned in Section 1.3,
for a linear model , increasing x by one unit has the effect of adding m
to . From Section 3.1 we know that for an exponential model , increas-
ing x by one unit has the effect of multiplying by the growth factor a.f 1x2
f 1x2= Ca
x
f 1x2
f 1x2= b + mx
Linear Exponential
Model
f 1x 2= b + mx f 1x 2= Ca
x
Initial value f(0) b C
Increasing x by 1 has
the effect of . . .
adding m to .f 1x 2 multiplying by a.f 1x 2
Let’s test these ideas on a specific example.
example
3
Linear Growth Versus Exponential Growth
City officials in Newburgh, population 10,000, wish to make long-range plans to
maintain and expand the infrastructure and services of their city. They hire two city
planners to construct models for Newburgh’s growth over the next 5 years.
Planner A estimates that the city’s population increases by 500 people each year.
Planner B estimates that the city’s population increases by 5% per year.
(a) Use Planner A’s assumption to find a function that models Newburgh’s
population t years from now. Make a table of values of the function ,
including the average rate of change of the population increase for each year.
(b) Use Planner B’s assumption to find a function that models Newburgh’s
population t years from now. Make a table of values of the function ,
including the percentage rate of change of population each year.
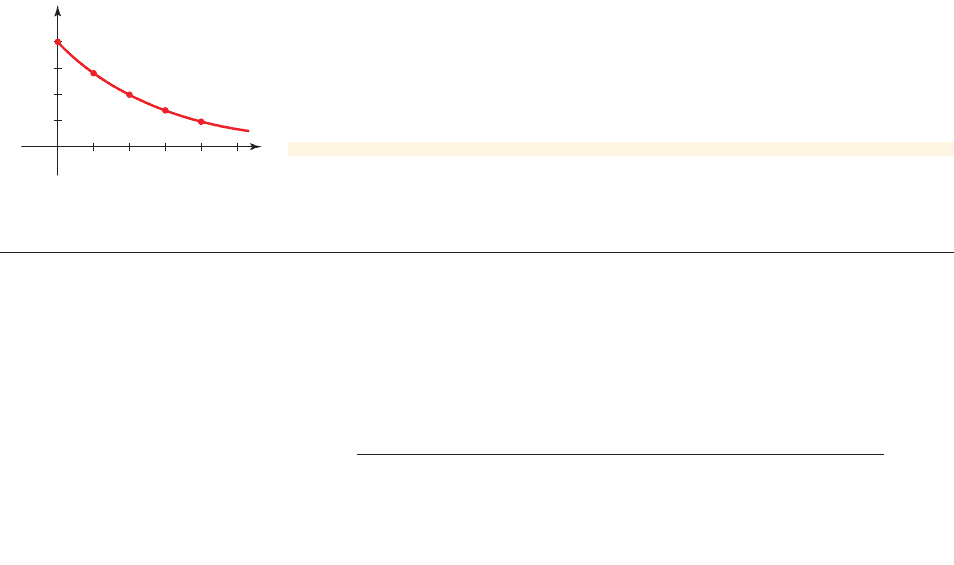
(c) Graph the functions and for the next 25 years. How do these functions
differ?
Solution
(a) Planner A assumes that the population grows by 500 people per year, so after
t years, 500t people will be added to the initial population. This leads to the
linear model
with initial value 10,000 and rate of change 500. See the following table.
P
A
1t 2= 10,000 + 500t
P
B
P
A
P
B
P
B
P
A
P
A
276 CHAPTER 3
■
Exponential Functions and Models
(b) Planner B assumes that the population grows by 5% per year. So the growth
rate is , and the growth factor is . This leads to
the exponential model
See the table below.
P
B
1t 2= 10,000
#
11.05 2
t
a = 1 + 0.05 = 1.05r = 0.05
(c) The graphs are shown in Figure 3. The exponential growth function eventu-
ally grows much faster than the linear function .P
A
P
B
Year Population
Average rate
of change
0 10,000 —
1 10,500 500
2 11,000 500
3 11,500 500
4 12,000 500
5 12,500 500
Planner BPlanner A
Yea r Population
Percentage
rate of change
0 10,000 —
1 10,500 5%
2 11,025 5%
3 11,576 5%
4 12,155 5%
5 12,762 5%
P
P
B
P
A
510152025
0
x
30,000
25,000
20,000
15,000
10,000
5,000
35,000
figure 3 Graphs of and P
B
P
A
■ NOW TRY EXERCISES 19 AND 29 ■
2
■ Logistic Growth: Growth with Limited Resources
A cell phone company has sold 3 million phones this month, but the company pres-
ident would like his sales force to double their efforts and double sales every month.
This means that sales would grow exponentially. The number of phones sold (in mil-
lions) in month x would be modeled by
If the sales force could actually accomplish this feat, then in the twelfth month they
would sell million phones, or
This number far exceeds the population of the entire world. Moreover, the sales staff
would have to sell twice as many phones the next month to satisfy the quota. Clearly,
sales growth must be limited by the available resources. In this case, the number of
potential customers is limited to about 6 billion, say.
12,288,000,000 L 12 billion phones
S 1122= 3
#
2
12
= 12,288
S 1x2= 3
#
2
x
SECTION 3.3
■
Comparing Linear and Exponential Growth 277
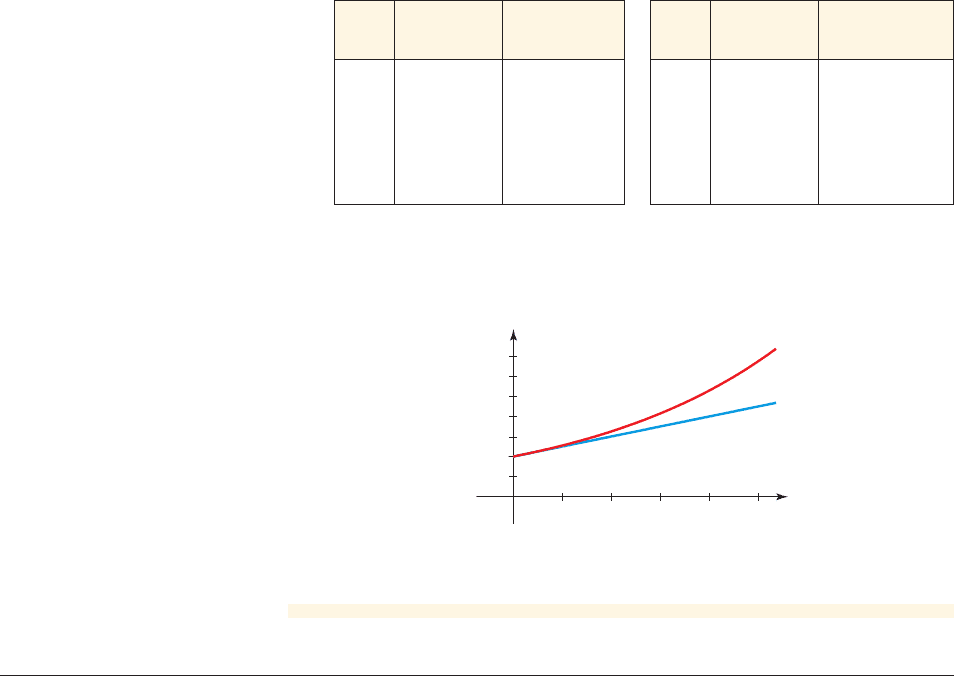
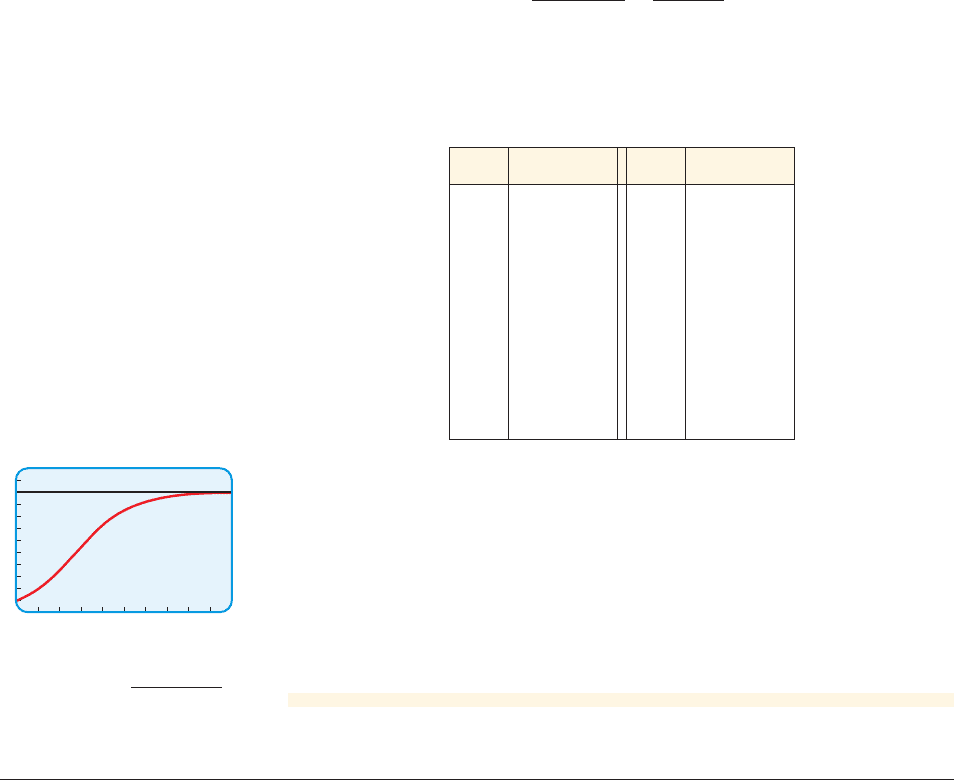
A logistic growth model is a function of the form
and models growth under limited resources.
■
The variable x is the number of time periods.
■
The constant C is the carrying capacity, the maximum population the
resources can support.
■
The graph of the function f has the general shape shown. The horizontal
line is an asymptote of the graph.y = C
f 1x2=
C
1 + b
#
a
-x
a 7 1, b 7 0
Logistic Growth
C
f(x)=
C
1+b#a
⫺x
0
x
y
Nevertheless, the company can be considered very successful if it can gain an
increasing percentage of the remaining market share (the people who haven’t yet
bought a cell phone). If the maximum number of potential customers is C and
the company has sold phones to N of them, then the remaining potential market is
. The number of phones sold as a fraction of this potential market is
. As we’ve seen, the company can’t hope for exponential growth, but
maybe their sales as a fraction of the remaining market can grow exponentially with
growth factor a, that is,
where N is the number of cell phones sold by time period x. Solving this equation for
N (the total number of cell phones sold by time period x), we get an equation of the form
where . This type of equation, called a logistic growth equation, models
growth under limited resources.
b = 1>k
N =
C
1 + b
#
a
-x
a 7 1
N
C - N
= ka
x
N>1C - N2
C - N
example
4
Limited Fish Population
A biologist models the number of fish in a small pond by the logistic growth function
where x is the number of years since the pond was first observed.
f 1x 2=
100
1 + 9
#
1.5
-x
Year Population
0 10
1 14
2 20
3 27
4 36
5 46
6 56
7 65
8 74
9 81
10 86
Year Population
11 91
12 94
13 96
14 97
15 98
16 99
17 99
18 99
19 100
20 100
21 100
278 CHAPTER 3
■
Exponential Functions and Models
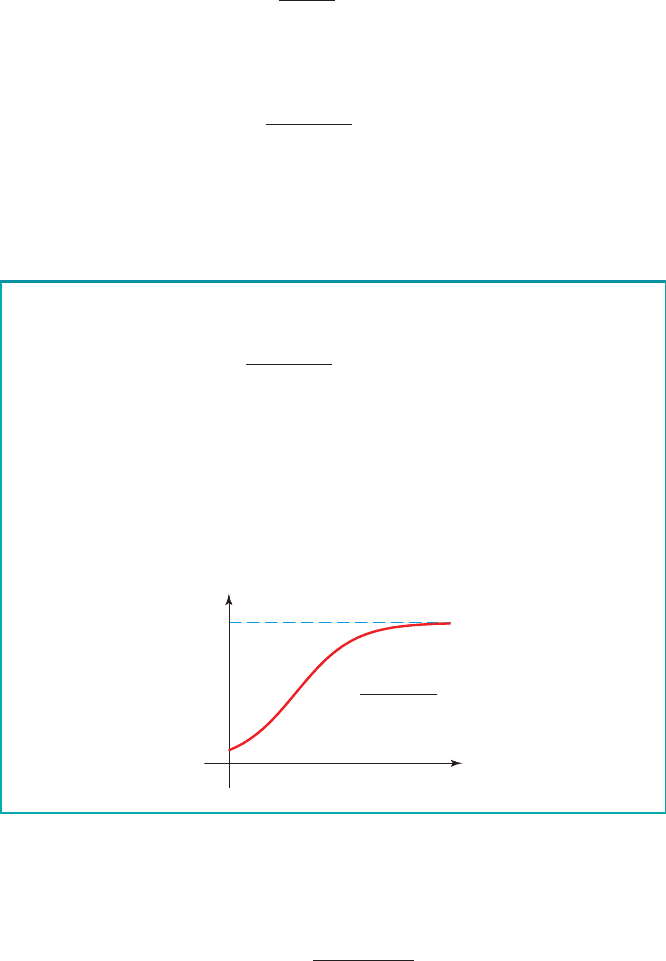
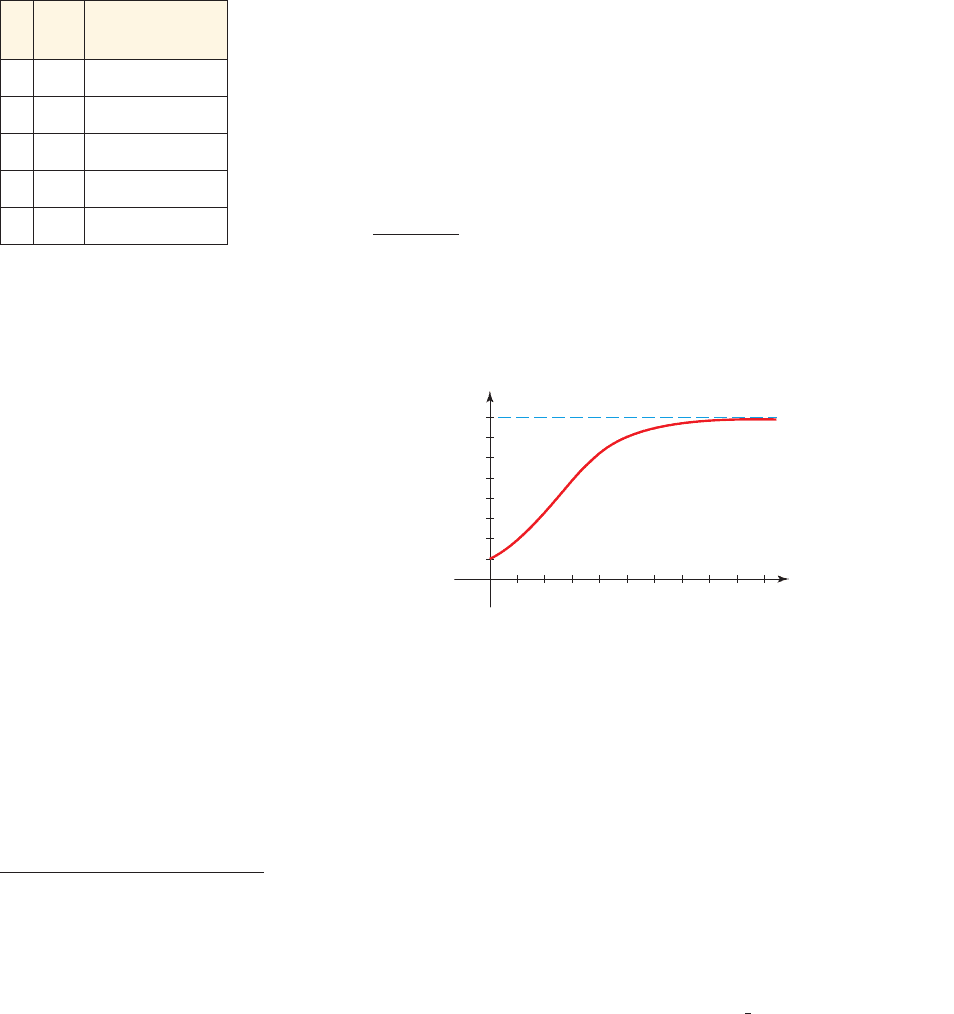
(c) A graph of the function f and the line are shown in Figure 4. It
appears that the population gets closer and closer to 100 fish but will never
exceed that number. The line is a horizontal asymptote of f.
(d) Comparing the general form of the logistic equation with the model, we see
that the carrying capacity C is 100. This means that, according to the model,
the maximum number of fish the pond can support is 100, so the population
never exceeds this capacity. The table of values and the graph of f confirm this
property of the model.
■ NOW TRY EXERCISE 31 ■
y = 100
y = 100
(a) What is the initial number of fish in the pond?
(b) Make a table of values of f for x between 0 and 21. From the table, what can
you conclude happens to the fish population as x increases?
(c) Use a graphing calculator to draw a graph of the function f and the line .
From the graph, what can you conclude about the fish population as x increases?
(d) What is the carrying capacity of the pond? Does this answer agree with the
table in part (b) and the graph in part (c)?
Solution
(a) When x is 0 the population is
Initially, there were 10 fish in the pond.
(b) We use a calculator to find the values of the function f shown in the table
below. It appears that the population stabilizes at 100 fish.
f 102=
100
1 + 9
#
1.5
0
=
100
1 + 9
#
1
= 10
y = 100
120
0
20
figure 4
Graph of f 1x2=
100
1 + 9
#
1.5
-x
3.3 Exercises
CONCEPTS
Fundamentals
1. A population is modeled by .
(a) The average rate of change of f
_______ (is constant/varies) on different
intervals.
f 1x 2= 8
#
5
x
SECTION 3.3
■
Comparing Linear and Exponential Growth 279
(b) The percentage rate of change of f _______ (is constant/varies) on all intervals of
length 1.
(c) The percentage rate of change of f between and is
_______
2. A set of data with equally spaced inputs is given in the table in the margin. Complete
the table for the percentage rate of change of the outputs y.
(a) Since the percentage rate of change
_______ (is constant/varies), there is an
exponential model that fits the data.
(b) The percentage rate of change is the constant
_______%, so the growth rate r is
_______, and the growth factor a is _______.
(c) An exponential model that fits the data is
x
.
3. A population with limited resources is modeled by the logistic growth function
. The initial population is _______, and the carrying capacity is
_______.
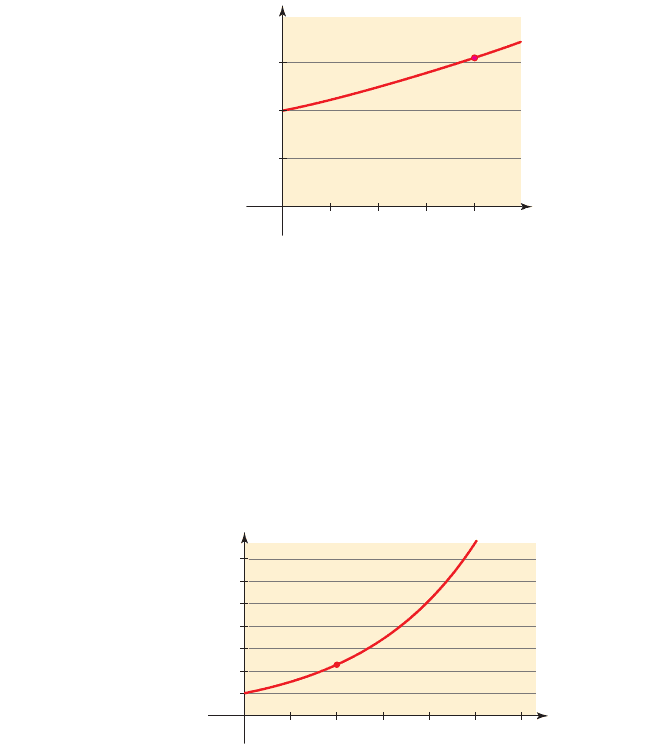
4. The population of a species with limited resources is modeled by a logistic growth
function f. Use the graph of f to estimate the initial population and the carrying
capacity.
f 1x 2=
500
1 + 24
#
a
-x
f 1x 2=
ⵧ
#
ⵧ
f 1x 2= C
#
a
x
x = 4x = 3
x y
Percentage rate
of change
0 6 —
1 18
300%
2 54
3 162
4 486
50
200
100
125
25
150
175
75
2468101214161820
0
x
y
f
Think About It
5. True or false?
(a) The function has constant average rate of change on all intervals.
(b) The function has constant percentage rate of change on all intervals of
length one.
6. Give some real-world examples of population growth with limited resources. For
each example, explain how the population would grow if there were unlimited
resources.
7. Identify each type of growth as linear or exponential.
(a) Doubling every 5 years (b) Adding 1000 units each year
(c) Increasing by 6% each year (d) Multiplying by 2 each year
8. Identify each type of decay as linear or exponential.
(a) Decreasing by 10% each year (b) Decreasing by 100 units each year
(c) Half remains each year (d) Multiplying by each year
9–12
■ A population is modeled by the given function f in terms of time t, where t is
measured in hours. Make a table of values for f, the average rate of change of f,
and the percentage rate of change of f in each time period.
1
3
f 1x 2= 6
x
f 1x 2= 2x + 5
SKILLS

280 CHAPTER 3
■
Exponential Functions and Models
Hour
t
Population
f 1t 2
Average
rate
of change
Percentage
rate
of change
0
5000 — —
1
6500 1500 30%
2
3
4
Hour
t
Population
f 1t 2
Average
rate
of change
Percentage
rate
of change
0
1000 — —
1
950
- 50
%- 5
2
3
4
9. f 1t2= 500011.3 2
t
10. f 1t2= 100010.952
t
Hour
t
Population
f 1t 2
Average
rate of
change
Percentage
rate
of change
0
30,000 — —
1
24,000
- 6000
%- 20
2
3
4
Hour
t
Population
f 1t 2
Average
rate
of change
Percentage
rate
of change
0
2000 — —
1
3400 1400 70%
2
3
4
11. f 1t2= 30,00010.80 2
t
12. f 1t2= 20,00011.72
t
SECTION 3.3
■
Comparing Linear and Exponential Growth 281
x y
0 30,000
1 57,000
2 108,300
3 205,770
4 390,963
x y
0 500
1 450
2 405
3 364.5
4 328.05
x y
0 20,000
1 12,000
2 7200
3 4320
4 2592
x y
0 7000
1 8250
2 9500
3 10,750
4 12,000
x y
0 3000
1 2440
2 1880
3 1320
4 760
x y
0 40,000
1 84,000
2 176,400
3 370,440
4 777,924
13–18 ■ A data set with equally spaced inputs is given.
(a) Find the average rate of change and the percentage rate of change for consecutive
outputs.
(b) Is an exponential model appropriate? If so, find the model and sketch a graph of the
model together with a scatter plot of the data.
13. 14. 15. 16.
17. 18.
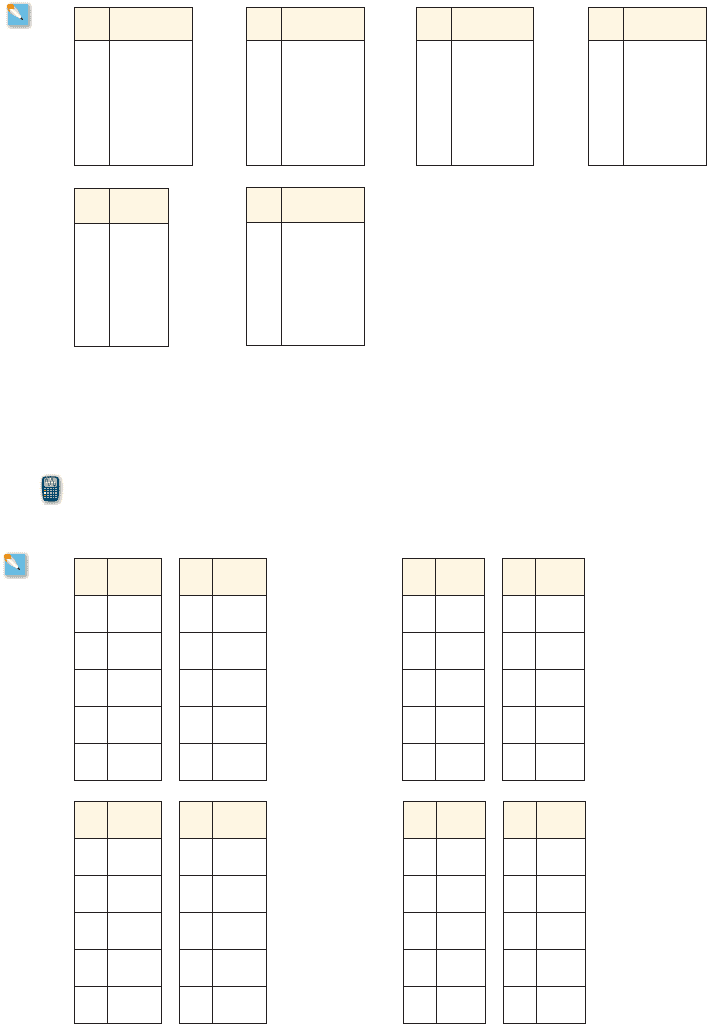
19–22 ■ Suppose that the function f is a model for linear growth and that g is a model for
exponential growth, with both f and g functions of time t.
(a) Fill in the table by evaluating the functions f and g at the given values of t.
(b) Construct equations for the functions f and g in terms t.
(c) Use a graphing calculator to graph the functions f and g on the same screen for
. What does the graph tell us about the differences between the two
functions’ behaviors?
0 … t … 10
t
f 1t 2
0 200
1 350
2
3
4
t
g 1t 2
0 200
1 350
2
3
4
t
f 1t 2
0 90
1 10
2
3
4
t
g 1t 2
0 40
1 70
2
3
4
t
f 1t 2
0 40
1 70
2
3
4
t
g 1t 2
0 500
1 300
2
3
4
t
f 1t 2
0 500
1 300
2
3
4
t
g 1t 2
0 90
1 10
2
3
4
19. 20.
21. 22.
282 CHAPTER 3
■
Exponential Functions and Models
24. The function is a model for a Population A, where t is measured in years.
The function
is a model for a Population B, where t is measured in years.
(a) Fill in the tables in the margin for the functions f and g for the given values of t.
(b) Are the initial populations for A and B the same?
(c) Which population grows exponentially?
(d) Which population grows logistically? What is the carrying capacity?
g1t2=
3000
1 + 29
#
2
-t
f 1t 2= 100
#
2
t
P
1000
100
4000
2000
3000
12345678910
0
x
B
A
25. World Population The population of the world was 6.454 billion in 2005 and 6.555
billion in 2006. Assume that the population grows exponentially.
(a) Find an exponential growth model for the population t years since 2005.
What is the growth rate?
(b) Sketch a graph of the function found in part (a), and plot the points ,
, , and .
(c) Use the model found in part (a) to find the average rate of change from 2005 to
2006 and from 2008 to 2009. Is the average rate of change the same on each of
these time intervals?
(d) Use the model to find the percentage rate of change from 2005 to 2006 and from
2008 to 2009. Is the percentage change the same on each of these time intervals?
26. Population of California The population of California was 29.76 million in 1990
and 33.87 million in 2000. Assume that the population grows exponentially.
(a) Find an exponential growth model for the population t years since 1990.
What is the annual growth rate?
(b) Sketch a graph of the function found in part (a), and plot the points ,
, , and .
(c) Use the model found in part (a) to find the average rate of change from 1990 to
1991 and from 2000 to 2001. Is the average rate of change the same on each of
these time intervals?
(d) Use the model to find the percentage rate of change from 1990 to 1991 and from
2000 to 2001. Is the percentage change the same on each of these time intervals?
111, f 11122110, f 1102211, f 1122
10, f 1022
f 1t 2= Ca
t
14, f 142213, f 13 2211, f 11 22
10, f 1022
f 1t 2= Ca
t
CONTEXTS
t
f 1t 2
0
2
4
6
8
10
t
g 1t 2
0
2
4
6
8
10
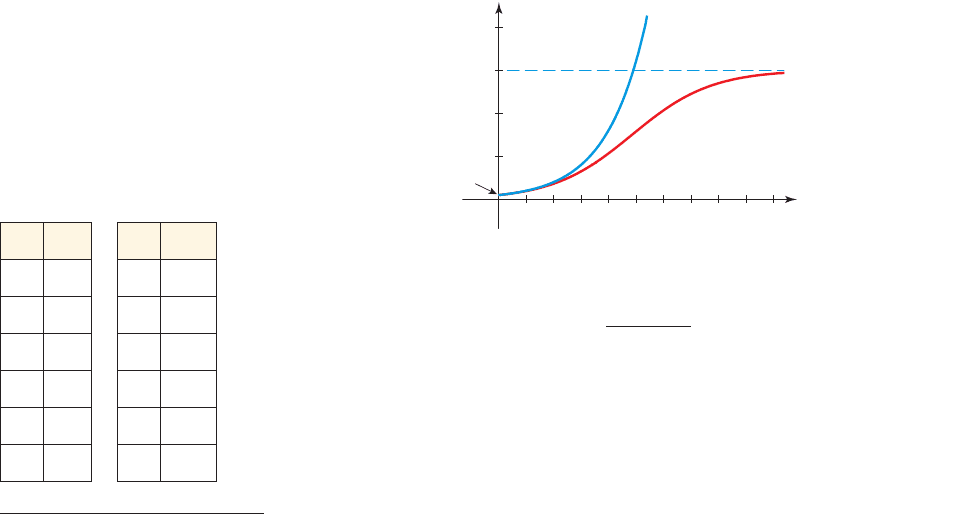
23. The graphs of two population models are shown. One grows exponentially and the other
grows logistically.
(a) Which population grows exponentially?
(b) Which population grows logistically? What is the carrying capacity?
(c) What is the initial population for A and for B?
SECTION 3.3
■
Comparing Linear and Exponential Growth 283
Deer
population
0
12 43
10,000
t
n
20,000
30,000
(4, 31,000)
Years since 2003
27. Deer Population The graph shows the deer population in a Pennsylvania county
between 2003 and 2007. Assume that the population grows exponentially.
(a) What was the deer population in 2003?
(b) Find an exponential growth model for the population t years since
2003. What is the annual growth rate?
(c) Use the model to find the percentage rate of change from 2005 to 2006. Compare
your answer to the growth rate from part (b).
n 1t 2= Ca
t
n
200
400
Frog
population
500
100
600
700
300
123
(2, 225)
456
0
t
28. Frog Population Some bullfrogs were introduced into a small pond. The graph
shows the bullfrog population for the next few years. Assume that the population grows
exponentially.
(a) What was the initial bullfrog population?
(b) Find an exponential growth model for the population t years since the
bullfrogs were put into the pond. What is the annual growth rate?
(c) Use the model to find the percentage rate of change from to . Compare
your answer to the growth rate from part (b).
t = 3t = 2
n 1t 2= Ca
t
29. Salary Comparison Suppose you are offered a job that lasts three years and you are
to be very well paid. Which of the following methods of payment is more profitable for
you?
Offer A: You are paid $10,000 in the starting month (month 0) and get a $1000
raise each month.
Offer B: You are paid 2 cents in month 0, 4 cents in month 1, 8 cents in month 2,
and so on, doubling your pay each month.