Stewart J. College Algebra: Concepts and Contexts
Подождите немного. Документ загружается.


284 CHAPTER 3
■
Exponential Functions and Models
Offer A Offer B
Month
Monthly
salary ($)
Percentage rate
of change
0
0.02 —
1
0.04 100%
2
3
4
5
Month
Monthly
salary ($)
Average rate
of change
0
10,000 —
1
11,000 1000
2
3
4
5
(a) Complete the salary tables for Offer A and Offer B.
(b) Find a function that models your salary in month t if you accept Offer A. What
kind of function is ?
(c) Find a function that models your salary in month t if you accept Offer B. What
kind of function is ?
(d) Find the salary for the last month (month 35) for each offer. Which offer gives the
highest salary in the last month?
30. Pesticide Cleanup Many pesticides for citrus trees are toxic to fish. While the citrus
groves on a large farm were treated with pesticides, high winds deposited 1000 gallons
of pesticides into a lake stocked with fish. To ensure survival of the fish, 95% of the
pesticides must be removed from the lake within 96 hours of contamination. There are
two methods of removal:
Method A: A chemical reagent is added to the pond to neutralize the pesticide.
This chemical reagent removes the pesticide at a rate of 5 gal/h.
Method B: The pond is fitted with a filtration system that removes 9% of the
remaining pesticides each hour.
(a) Complete the tables for Method A and Method B.
(b) Find a function that models the amount of pesticide remaining after t hours if
Method A is used. What kind of function is ?
(c) Find a function that models the amount of pesticide remaining after t hours if
Method B is used. What kind of function is ?f
B
f
B
f
A
f
A
f
B
f
B
f
A
f
A
Method A Method B
Hours
Total amount
of pesticide
remaining (gal)
Average
rate
of change
0
1000 —
1
995
- 5
2
3
4
5
Hours
Total amount
of pesticide
remaining (gal)
Percentage
rate
of change
0
1000 —
1
910 %- 9
2
3
4
5
SECTION 3.3
■
Comparing Linear and Exponential Growth 285
(d) Determine the amount of pesticide remaining after 96 hours for each method of
removal. Which method would save the fish?
31. Limited Fox Population The fox population on a small island behaves according to
the logistic growth model
where t is the number of years since the fox population was first observed.
(a) Find the initial fox population.
(b) Make a table of values of f for t between 0 and 20. From the table, what can you
conclude happens to the fox population as t increases?
(c) Use a graphing calculator to draw a graph of the function . From the graph,
what can you conclude happens to the fox population as t increases?
(d) What is the carrying capacity? Does this answer agree with the table in part (b) and
the graph in part (c)?
32. Limited Bird Population The population of a certain species of bird is limited by the
type of habitat required for nesting. The population behaves according to the logistic
growth model
where t is the number of years since the bird population was first observed.
(a) Find the initial bird population.
(b) Make a table of values of f for t between 0 and 20. From the table, what can you
conclude happens to the bird population as t increases?
(c) Use a graphing calculator to draw a graph of the function . From the graph,
what can you conclude happens to the bird population as t increases?
(d) What is the carrying capacity? Does this answer agree with the table in part (b) and
the graph in part (c)?
33. Limited World Population The growth rate of world population has been decreasing
steadily in recent years. On the basis of this, some population models predict that world
population will eventually stabilize at a level that the planet can support. One such
logistic model is
where represents the year 2000 and population is measured in billions.
(a) What world population does this model predict for the year 2200? For 2300?
(b) Use a graphing calculator to draw a graph of the function P for the years 2000 to
2500.
(c) From the graph, what can you conclude happens to the world population as t increases?
(d) What is the carrying capacity? Does this answer agree with the graph in part (c)?
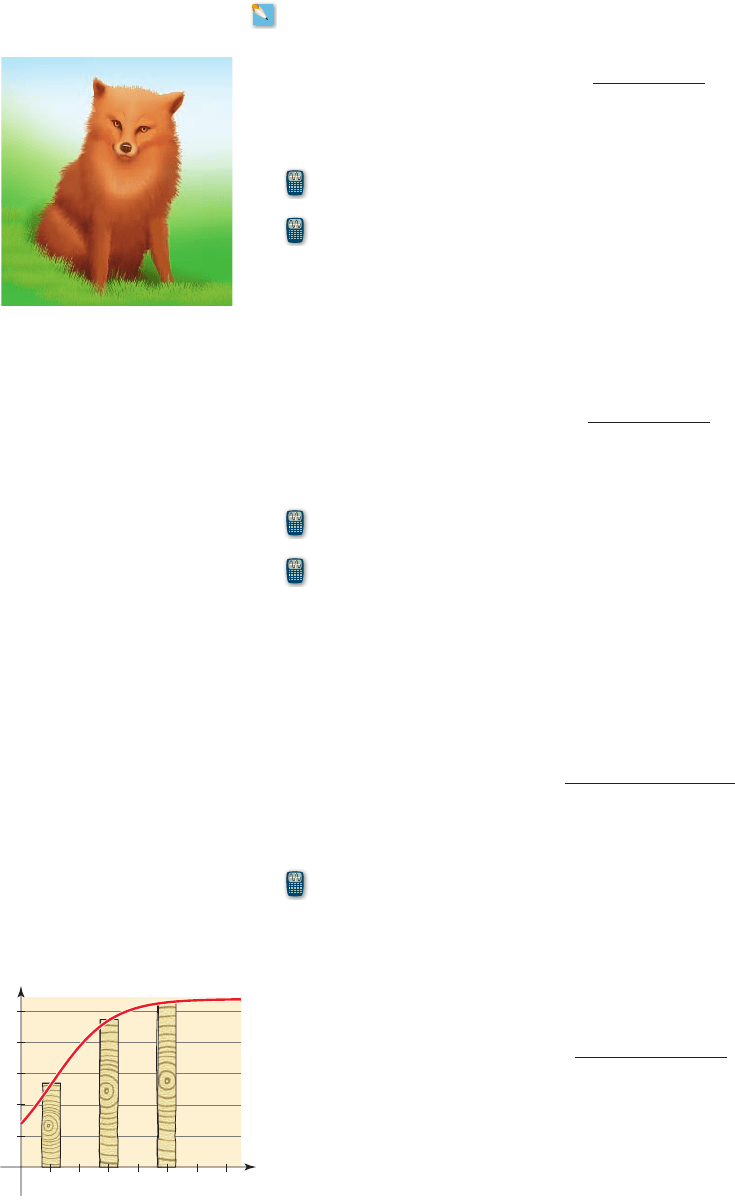
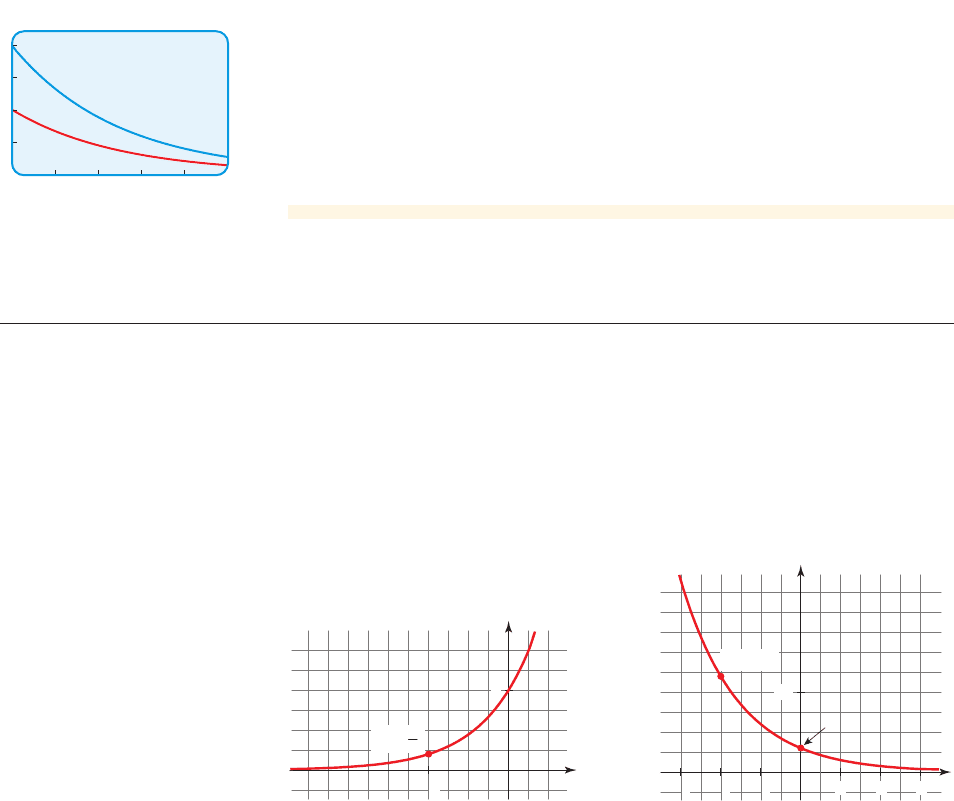
34. Tree Diameter For a certain type of tree the diameter D (in feet) depends on the
tree’s age t (in years) according to the logistic growth model
(a) What tree diameter does this model predict for a 150-year-old tree?
(b) Use the graph of D shown in the margin to determine what happens to the tree
diameter as t increases.
(c) What is the carrying capacity? Does this answer agree with the graph?
D 1t2=
5.4
1 + 2.9
#
11.01009 2
-t
t = 0
P 1t2=
12
1 + 0.97
#
11.020214 2
-t
n 1t 2
n 1t2=
11,200
1 + 27
#
11.85 2
-t
n 1t 2
n 1t2=
1200
1 + 11
#
11.7 2
-t
t
D
0
100 700300 500
5
4
3
2
1

286 CHAPTER 3
■
Exponential Functions and Models
2
3.4 Graphs of Exponential Functions
■
Graphs of Exponential Functions
■
The Effect of Varying a or C
■
Finding an Exponential Function from a Graph
IN THIS SECTION… we study exponential functions on their entire domain (not only
for positive numbers as in the preceding section), their graphs, and their rates of change.
GET READY… by reviewing the properties of exponents in Algebra Toolkits A.3
and A.4.
Graphs of exponential growth or decay models allow us to visually compare the ef-
fects of different rates of growth or different initial values. In this section we study
graphs of exponential functions in more detail.
2
■ Graphs of Exponential Functions
In Section 3.1 we modeled exponential growth and decay using functions of the form
, for positive values of x. Here we study such functions for all values of x.f 1x2= Ca
x
An exponential function with base a is a function of the form
where and . The domain of f is the set of all real numbers.a ⫽ 1a 7 0
f 1x2= a
x
In evaluating exponential functions, we use the Rules of Exponents to get
Notice that if , then .1>a 6 1a 7 1
a
-x
=
1
a
x
= a
1
a
b
x
Exponential Functions
Rules of Exponents are
reviewed in Algebra Toolkits A.3
and A.4, pages T14 and T20.
example
1
Graphing Exponential Functions
Graph the exponential function .
Solution
We calculate values of and plot points to get the graph in Figure 1. For instance,
to calculate , we use the Rules of Exponents to get
f
1- 32= 2
-3
= A
1
2
B
3
=
1
8
f 1- 32
f 1x2
f 1x2= 2
x
SECTION 3.4
■
Graphs of Exponential Functions 287
■ NOW TRY EXERCISE 5 ■
The graphs of exponential functions have two different shapes, depending on
whether the base a is greater than or less than 1. We graph both types in the next ex-
ample.
x
- 3 - 2 - 1
0 1 2 3 4
f 1x 2
1
8
1
4
1
2
1 2 4 8 16
y
10
20
15
5
⫺224
0
x
figure 1 Graph of f 1x 2= 2
x
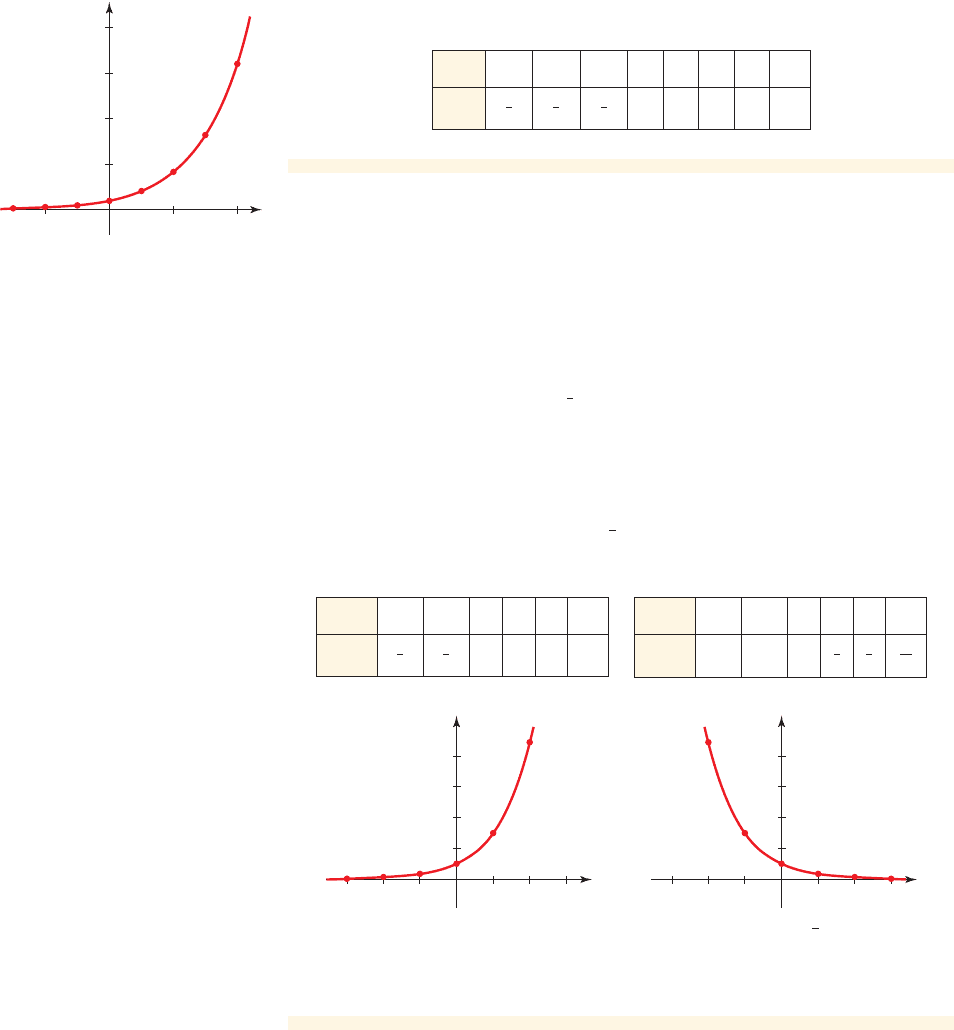
example
2
Graphing Exponential Functions
Draw the graph of each function.
(a) (b)
Solution
We calculate values of and and plot points to get the graph in Figure 2. For
instance, to calculate we use the Rules of Exponents to get
The other entries in the tables are calculated similarly.
g
1- 22= A
1
3
B
-2
= 3
2
= 9
g1- 22
g1x2f 1x2
g1x2= A
1
3
B
x
f 1x2= 3
x
The other entries in the table are calculated similarly.
4
8
6
2
⫺2 ⫺1⫺3213
0
x
y
(a) f(x)=3
x
(b) g(x)=
()
4
8
6
2
⫺2 ⫺1⫺321
1
3
3
0
x
y
x
figure 2 Graphs of exponential functions
x
- 2 - 1
0 1 2 3
f 1x 2
1
9
1
3
1 3 9 27
x
- 2 - 1
0 1 2 3
g 1x 2
9 3 1
1
3
1
9
1
27
■ NOW TRY EXERCISE 23 ■
From Example 2 we see that the graph of an exponential function always lies
entirely above the x-axis. The graph gets close to the x-axis, but never crosses it. This
means the x-axis is a horizontal asymptote of the graph of the function.
288 CHAPTER 3
■
Exponential Functions and Models
For the exponential function
■
The domain is all real numbers, and the range is all positive real numbers.
■
The line (the x-axis) is a horizontal asymptote of f.
■
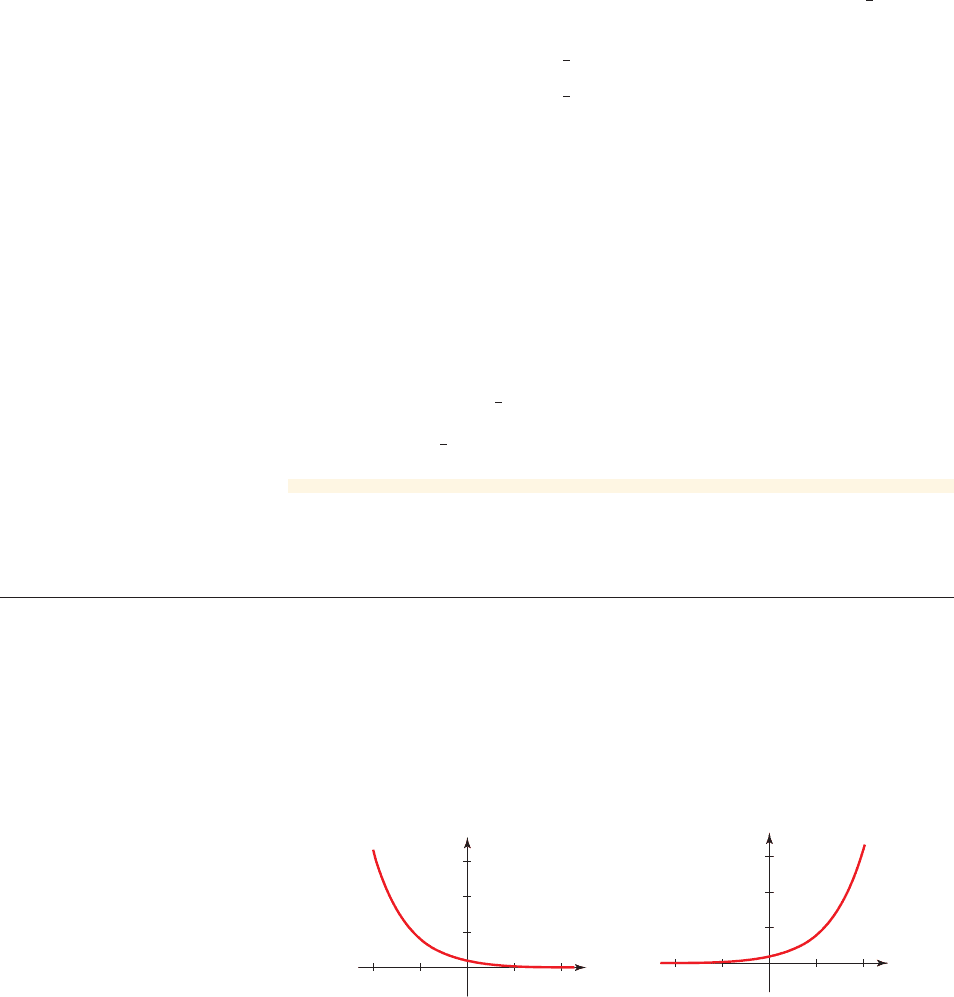
The graph of f has one of the shapes shown below.
If , then f is an increasing function.
If , then f is a decreasing function.0 6 a 6 1
a 7 1
y = 0
f 1x2= a
x
a 7 0, a ⫽ 1
Graphs of Exponential Functions
Ï=a˛ for a>1 Ï=a˛ for 0<a<1
0
x
(0,
1)
0
x
(0, 1)
y
y
Informally, an asymptote of a
function is a line to which the graph
of the function gets closer and
closer as one travels along the line.
2
■ The Effect of Varying a or C
In the next two examples we take a closer look at how changing the base a and mul-
tiplying by a constant C affect the shape of the graph of an exponential function.
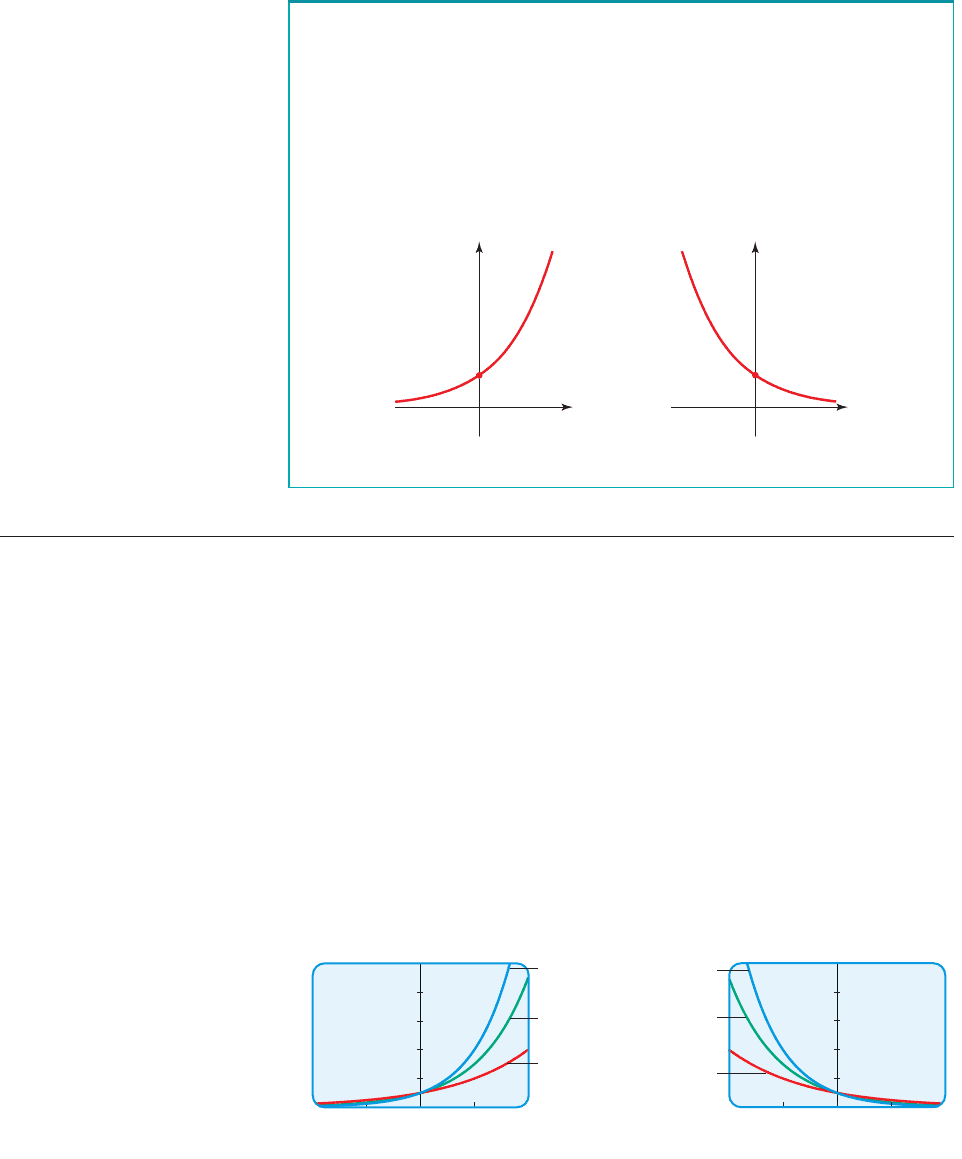
example
3
The Effect of Varying the Base a
Graph the family of exponential functions for the given values of a. Explain how
changing the value of a affects the graph.
(a) (b)
Solution
The graphs are shown in Figure 3.
(a) From Figure 3(a) we see that if the base a is greater than 1, then the larger the
value of a, the more rapidly the function increases.
g1x2= a
x
;a = 0.2, 0.3, 0.4f 1x2= a
x
;a = 2, 3, 4
y=2˛
y=3˛
y=4˛
(a) f(x)=a
x
; a=2, 3, 4
⫺
2
10
0
2
⫺2
y=0.2˛
y=0.3˛
y=0.4˛
(b) g(x)=a
x
; a=0.2, 0.3, 0.4
10
0
2
figure 3
SECTION 3.4
■
Graphs of Exponential Functions 289
(b) From Figure 3(b) we see that if the base a is less than 1, then the smaller the
value of a, the more slowly the function decreases.
■ NOW TRY EXERCISES 15 AND 17 ■
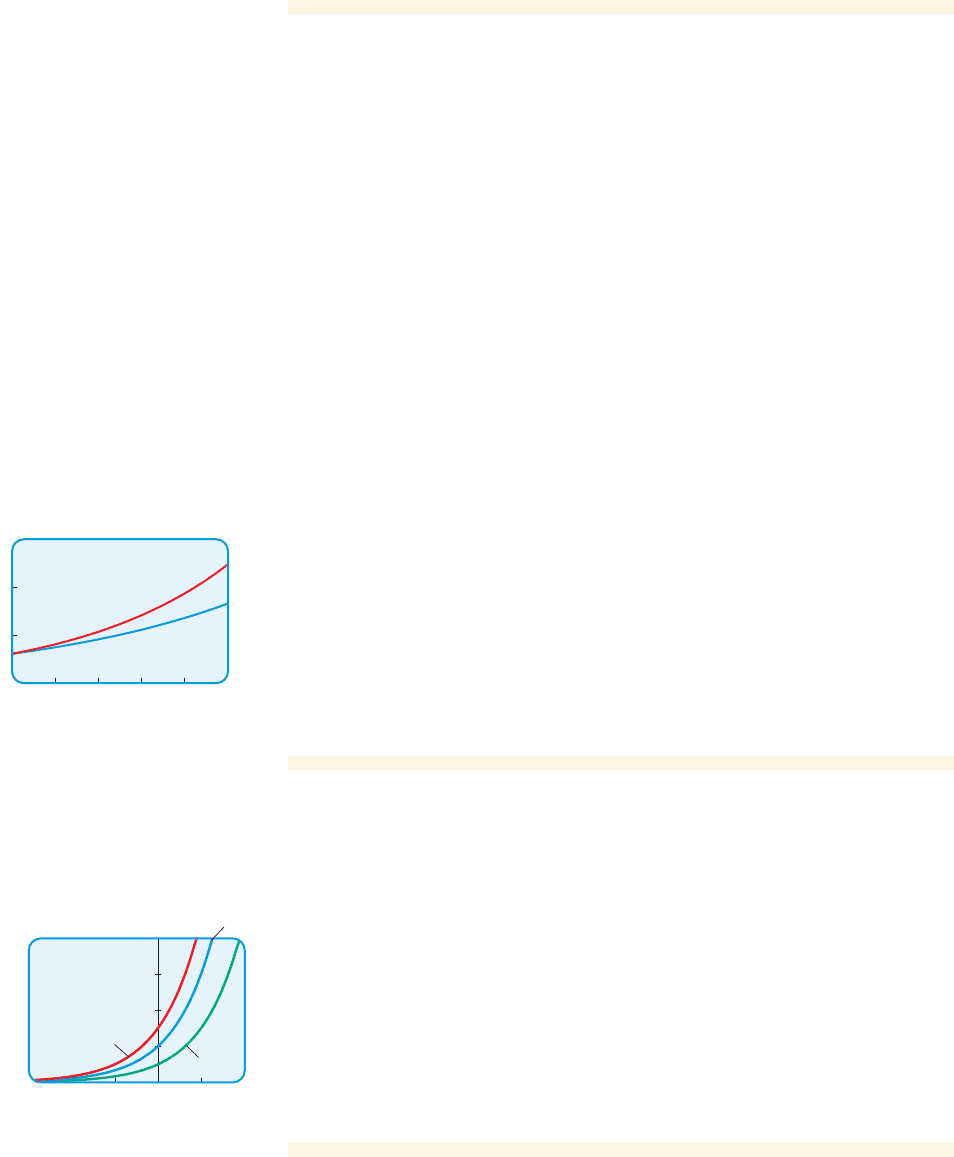
example
4
Different Models for World Population
In 2000 the population of the world was 6.1 billion and was growing exponentially
with a growth rate of 0.014. It is claimed that reducing the rate to 0.01 would make
a significant difference in the total population in just a few decades. Test this claim
graphically and algebraically as follows.
(a) Find exponential models for world population for each growth rate.
(b) Graph the models for the years 2000 to 2100 in the same viewing rectangle.
What do the graphs tell us about world population?
(c) Find the predicted world population in 2100 for each model.
Solution
(a) The growth factors are and . So the
models we seek are
where t is measured in years since 2000 and and are measured in
billions.
(b) The graph in Figure 4 shows that a small change in the relative rate of growth
will, over time, make a big difference in population size.
(c) The year 2050 is 50 years after the year 2000. So replacing t by 50 in each
model, we get
So the models predict populations of about 12.2 billion and 10.0 billion, a dif-
ference of over 2 billion people.
■ NOW TRY EXERCISE 35 ■
n 1502= 6.111.014 2
50
L 12.2andm 1502= 6.111.01 2
50
L 10.0
m 1t2n 1t 2
n 1t2= 6.111.014 2
t
andm 1t2= 6.111.01 2
t
1 + 0.01 = 1.011 + 0.014 = 1.014
30
0
100
m(t)=6.1(1.01)
t
n(t)=6.1(1.014)
t
figure 4
example
5
The Effect of Varying C
Use a graphing calculator to graph the family of exponential functions
Explain how changing the value of C affects the graph.
Solution
Using a graphing calculator, we graph the family of exponential functions
for . From the graphs in Figure 5 we see that the value
C is the y-intercept of the exponential function . Increasing the value of
C has the effect of “stretching” the graph vertically.
■ NOW TRY EXERCISE 19 ■
f 1x2= Ca
x
C = 10, 20, 30f 1x 2= C
#
3
x
f 1x2= C
#
3
x
C = 10, 20, 30
y=20#3
˛
⫺3
80
0
2
y=30#3˛
y=10#3˛
figure 5
f 1x 2= C
#
3
x
,C = 10, 20, 30
290 CHAPTER 3
■
Exponential Functions and Models
example
6
Different Amounts of a Radioactive Substance
A radioactive substance has a decay rate of per year. A 100-g sample and a
200-g sample of this substance are kept in a safe storage facility. Compare the
amounts remaining in each sample after t years graphically and algebraically as
follows.
(a) For each sample, find an exponential model for the amount remaining after
t years.
(b) Graph the models for t between 0 and 50 in the same viewing rectangle.
(c) Find the predicted amounts remaining in each sample after 100 years.
Solution
(a) Since the decay rate is , the decay factor is . So the
models we seek are
where t is measured in years and and are measured in grams.
(b) The graphs are shown in Figure 6.
(c) To find the amounts remaining after 100 years, we replace t by 100 in each
model.
So the models predict amounts of 13.3 g and 26.5 g.
■ NOW TRY EXERCISE 33 ■
n 11002= 10010.98 2
100
L 13.3andm 11002= 20010.98 2
100
L 26.5
m 1t2n 1t2
n 1t2= 10010.98 2
t
andm 1t2= 20010.98 2
t
1 + 1- 0.022= 0.98- 0.02
- 0.02
220
0
50
figure 6
2
■ Finding an Exponential Function from a Graph
In the preceding examples we graphed several exponential functions. Now we see
how to find an equation for an exponential function if we are given its graph.
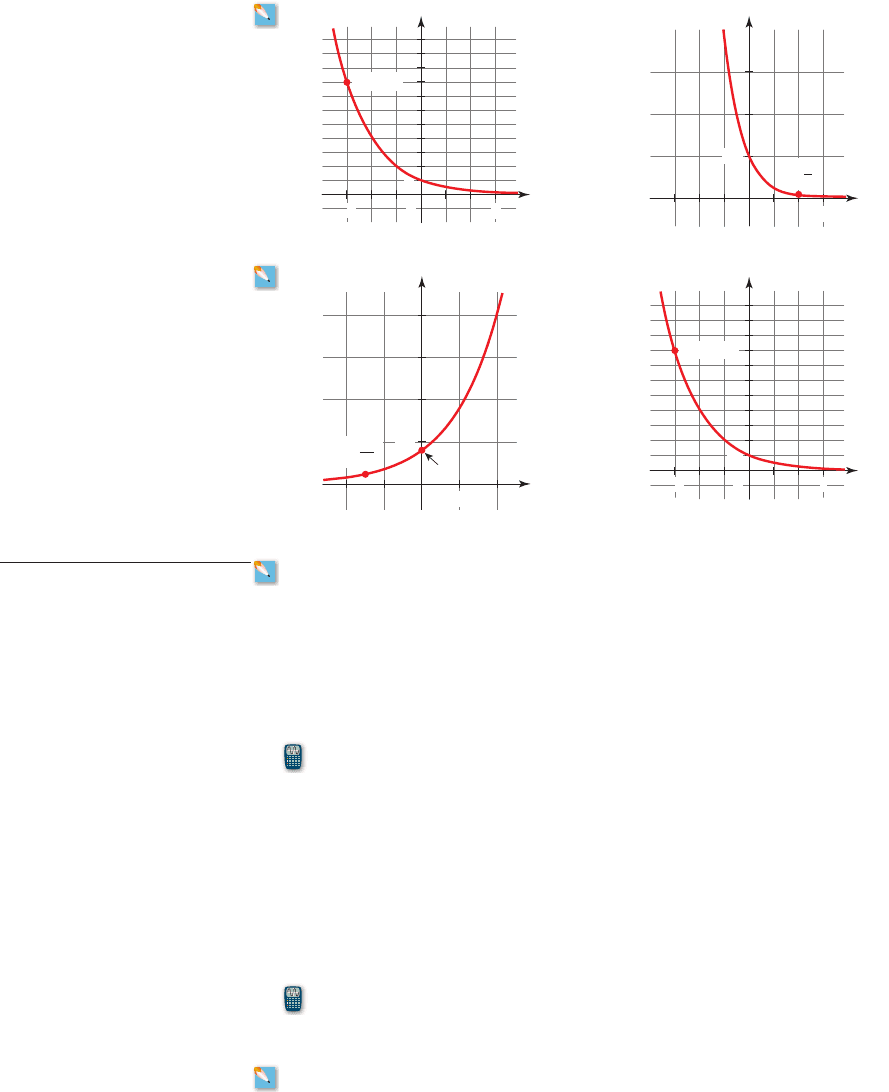
example
7
Finding an Exponential Function from a Graph
Find the function whose graph is given.
(a) (b)
f 1x2= Ca
x
x
0
1
_1
(
_1,
)
1
5
y
x
0
10
_2
_3 _1 2 3
3
1
(_2, 12)
y
SECTION 3.4
■
Graphs of Exponential Functions 291
Solution
(a) From the graph, , so C is 1. Also, . We
solve for a:
Given
Replace C by 1
Rules of Exponents
So .
(b) From the graph, , so C is 3. Also . We solve
for a:
From the graph
Replace C by 3
Divide by 3
Raise both sides to the power
Rules of Exponents
.
■ NOW TRY EXERCISES 29 AND 31 ■
So f 1x2= 3
#
A
1
2
B
x
a =
1
2
- 1>2 1a
-2
2
-1>2
= 142
-1>2
a
-2
= 4
3
#
a
-2
= 12
Ca
-2
= 12
f 1- 22= Ca
-2
= 12f 102= 3
f 1x2= 5
x
a = 5
a
-1
=
1
5
Ca
-1
=
1
5
f 1- 12= Ca
-1
=
1
5
f 102= Ca
0
= 1
In Example 5 we solve power
equations like . Solving
such equations is reviewed in
Algebra Toolkit C.1, page T47.
a
-2
ⴝ 4
3.4 Exercises
Fundamentals
1. Let .
(a) The function f is an exponential function with base
_______.
(b)
_______, _______, and _______.
2. Match the exponential function with its graph.
(a) (b) f 1x 2= 4
-x
f 1x 2= 4
x
f 1- 22=f 10 2=f 12 2=
f 1x 2= 5
x
x
0
15
10
5
_2
_1 21
y
I
CONCEPTS
x
0
15
10
5
_2
_1 21
y
II
Think About It
3–4 ■ True or false?
3. The exponential function is increasing.
4. The exponential function is increasing.f 1x 2= 12.52
x
f 1x 2= 10.25 2
x

292 CHAPTER 3
■
Exponential Functions and Models
SKILLS
x
f 1x 2
- 3
- 2
- 1
0
1
2
3
x
g 1x 2
- 3
- 2
- 1
0
1
2
3
7–14 ■ Sketch a graph of the exponential function by making a table of values.
7. 8.
9. 10.
11. 12.
13. 14.
15–18
■ Use a graphing calculator to graph the family of exponential functions for the
given values of a. Explain how changing the value of a affects the graph.
15. 16.
17. 18.
19–22
■ Use a graphing calculator to graph the family of exponential functions for the
given values of C. Explain how changing the value of C affects the graph.
19. 20.
21. 22.
23–26
■ The functions f and g are given.
(a) Using a graphing calculator, graph both functions in the same screen.
(b) Do the two graphs intersect? If so, find the intersection point.
23. and
24. and
25. and
26. and
27–28
■ The functions f and g are given.
(a) Graph both functions in the given viewing rectangle.
(b) Comment on how the graphs are related. Where do they intersect?
27. and g1x 2= 2
3x
;3- 1, 34 by 30, 604f 1x 2= 3
#
2
x
g1x 2= 7
x
f 1x 2= 4
x
g1x 2= A
4
3
B
x
f 1x 2= A
2
3
B
x
g1x 2= A
1
5
B
-x
f 1x 2= 5
-x
g1x 2= 4
-x
f 1x 2= 4
x
f 1x 2= C
#
3
x
;C =
1
2
,
1
4
,
1
8
f 1x 2= C
#
3
x
;C =-2, - 3, - 5
f 1x 2= C
#
5
x
;C =-1.0, - 1.5, - 2.0f 1x 2= C
#
5
x
;C = 10, 20, 100
f 1x 2= a
x
;a =
1
2
,
1
3
,
1
5
f 1x 2= a
x
;a = 0.5, 0.7, 0.9
f 1x 2= a
x
;a = 2, 3, 10f 1x 2= a
x
;a = 4, 6, 8
n 1T2= A
4
3
B
-T
R 1x 2= 11.7 2
x
I 1t 2= 10.1 2
t
h 1t 2= A
1
7
B
t
s 1t 2= 11.1 2
t
h 1s 2= 3
-s
g1x 2= 2
-x
f 1x 2= 4
x
5–6 ■ Fill in the table and sketch a graph of the given exponential function.
5. 6. g1x2= 5
-x
f 1x 2= 6
x
SECTION 3.4
■
Graphs of Exponential Functions 293
28. and
29–32
■ Find the function whose graph is given.
29. 30.
31. 32.
f 1x 2= Ca
x
g1x 2= 5
2x
;3- 0.5, 24 by 30, 404f 1x 2= 2
#
5
x
x
)
3_3
(_3, 8)
1
y
0
3_3
10
5
8
!@
0
x
2,
y
2
8
10
64
27
!@
0
x
_3,
y
3_3
6
(_3, 48)
0
x
y
33. Bacteria To prevent bacterial infections, it is recommended that you wash your hands
and cooking utensils as often as possible. At a family barbeque, Jim prepares his meat
without using proper sanitary precautions. There are about 100 colony-forming units
(CFU/mL) of a certain type of bacteria on the meat. Harold prepares his meat using
proper sanitary precautions, so there are only 2 CFU/mL of the bacteria on his meat. It
is known that the doubling time for this type of bacteria is 20 minutes.
(a) For each situation, find an exponential model for the number of bacteria on the
meat t hours since it was prepared.
(b) Graph the models for t between 0 and 6. What do the graphs tell us about the
number of bacteria present on the meat?
(c) For each model, find the predicted number of bacteria after 6 hours.
34. Bacteria The bacterium Streptococcus pyogenes (S. pyogenes) is the cause of many
human diseases, the most common being strep throat. The doubling time of these
bacteria is 30 minutes, but in the presence of a certain antibiotic the doubling time is
6 hours. Two cultures are prepared, and the antibiotic is added to one of the cultures.
Initially, each culture has 200 bacteria.
(a) Find an exponential model for the number of S. pyogenes bacteria in each culture
after t hours.
(b) Graph the models for t between 0 and 8. What do the graphs tell us about the
number of bacteria?
(c) For each model, find the predicted number of bacteria after 8 hours.
35. Investment Value On January 1, 2005, Marina invested $2000 in each of three
mutual funds: a growth fund with an estimated yearly return of 10%, a bond fund with
CONTEXTS