Stewart J. College Algebra: Concepts and Contexts
Подождите немного. Документ загружается.

164 CHAPTER 2
■
Linear Functions and Models
(c) If Ingrid upgrades to the $60 per month plan, how does that change the graph of C?
(d) If Ingrid downgrades to a plan of $30 a month, how does that change the graph of C?
(e) If Ingrid chooses the $100 cell phone, how does that change the graph of C?
Month
C
y
0
10
20
30
123
4
Monthly cost
Month
y
0
100
200
300
123
54
Total cost
55. Weather Balloon Weather balloons are filled with hydrogen and released at various
sites to measure and transmit data such as air pressure and temperature. A weather
balloon is filled with hydrogen at the rate of
/s. Initially, the balloon has of
hydrogen. Find a linear function that models the volume of hydrogen in the balloon
after t seconds.
56. Filling a Pond A large koi pond is filled from a garden hose at the rate of 10 gal/min.
Initially, the pond contains 300 gallons of water. Find a linear function that models the
volume of water in the pond (in gallons) after t minutes.
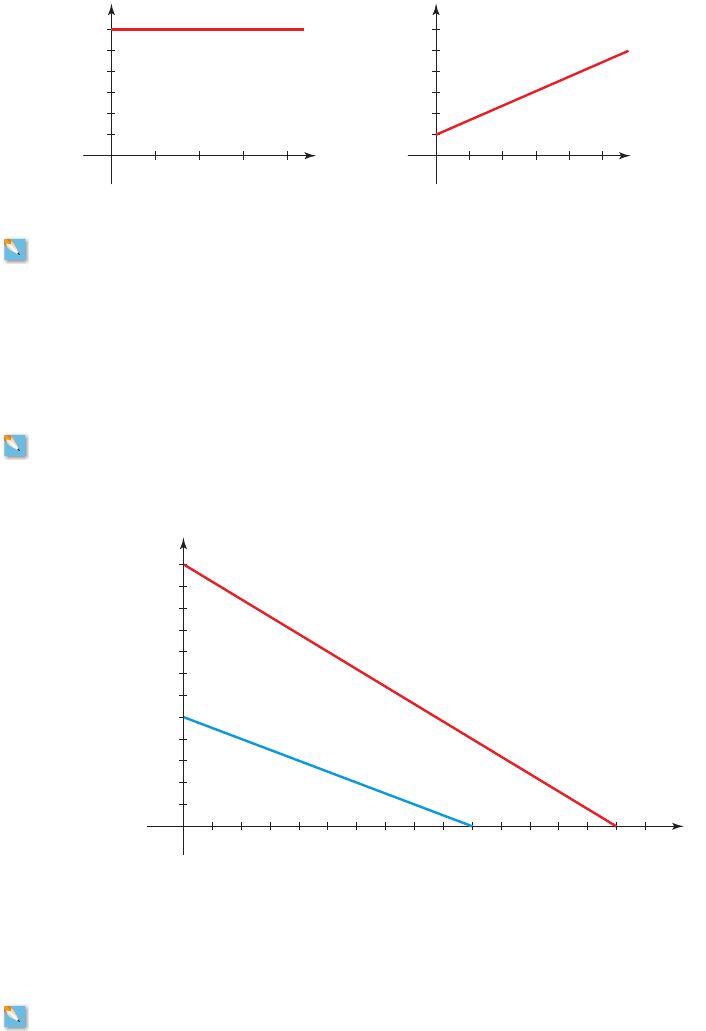
57. Mountain Biking Meilin and Brianna are avid mountain bikers. On a spring day they
cycle down straight roads with steep grades. The graphs give a representation of the
elevation of the path on which each of them cycles. Find the grade of each road.
2 ft
3
0.5 ft
3
200
400
600
800
1000
1200
2000 4000 6000 8000
Brianna
Meilin
Horizontal distance
(
ft
)
Elevation
(ft)
10,000 12,000 14,000 16,000
0
x
y
58. Wheelchair Ramp A local diner must build a wheelchair ramp to provide handicap
access to their restaurant. Federal building codes require that a wheelchair ramp must
have a maximum rise of 1 inch for every horizontal distance of 12 inches. What is the
maximum allowable slope for a wheelchair ramp?
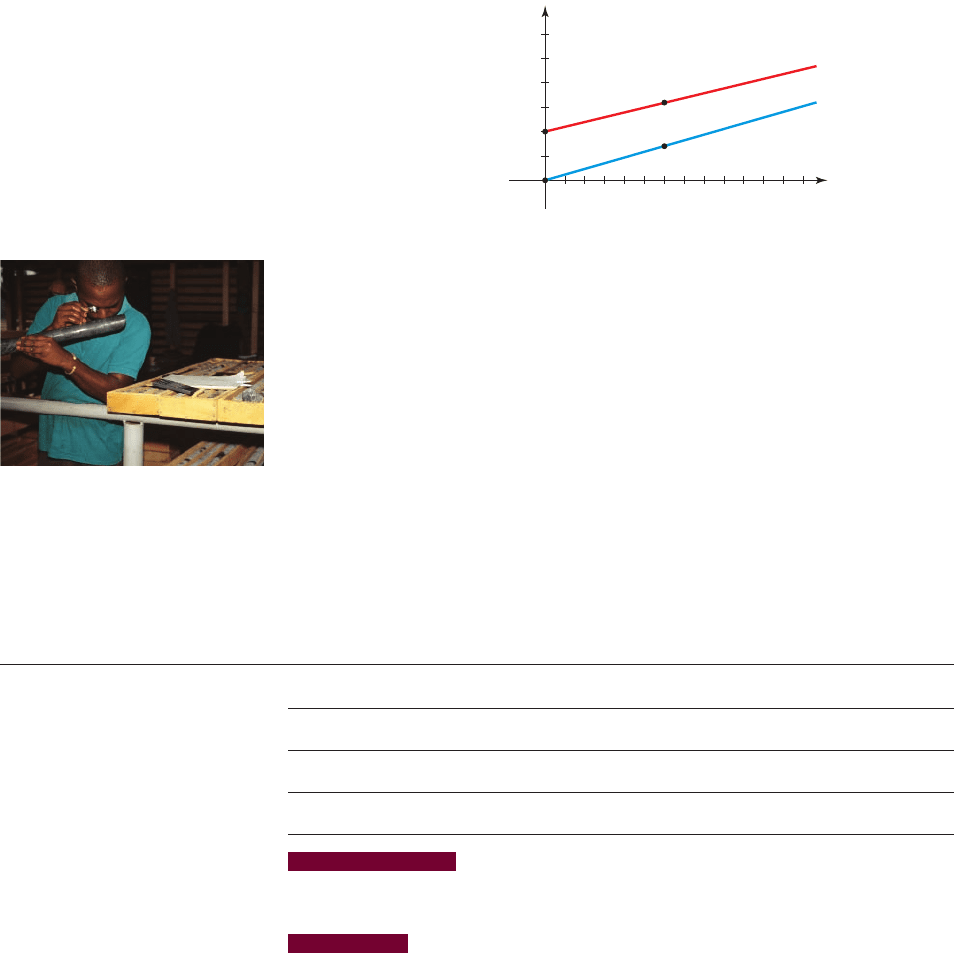
59. Commute to Work Jade and her roommate Jari live in a suburb of San Antonio,
Texas, and both work at an elementary school in the city. Each morning they commute
to work traveling west on I-10. One morning Jade left for work at 6:50
A.M., but Jari left
10 minutes later. Both drove at a constant speed. The following graphs show the
distance (in miles) each of them has traveled on I-10 at time t (in minutes), where t ⫽ 0
is 7:00
A.M.
SECTION 2.3
■
Equations of Lines: Making Linear Models 165
(a) Use the graph to decide which of them is traveling faster.
(b) Find the speed at which each of them is driving.
(c) Find linear functions that model the distances that Jade and Jari travel as functions
of t.
60. Sedimentation Rate Geologists date geologic events by examining sedimentary
layers in the ocean floors. For instance, they can tell when an ancient volcano erupted
by noting where in the sedimentary layers its ash was deposited. This is possible
because the rate of sedimentation is assumed to be largely constant over geologic eras,
so the depth of the sedimentation is modeled by a linear function of time. To examine
sedimentary strata, core samples (often many meters long) are drilled from the ocean
floor, then brought to the laboratory for study. Special features in the layers, including
the chemical composition of the deposits, can indicate climate change or other geologic
events. It is estimated that the rate of sedimentation in Devil’s Lake, South Dakota, is
0.24 cm per year. The depth beneath the lake bottom at which a layer of sediment lies is
a function of the time elapsed since it was deposited.
(a) Find a linear function that models the depth of sediment as a function of time
elapsed.
(b) To what depth must we drill to reach sediment that was deposited 300 years ago?
20
10
30
2468
Jade
Jari
Time since 7:00
A.M.
(
min
)
Distance
traveled (mi)
10 12
(6, 7)
(6, 16)
0
t
y
Examining core samples
© Charles O. Cecil/Alamy
2
2.3 Equations of Lines: Making Linear Models
■
Slope-Intercept Form
■
Point-Slope Form
■
Horizontal and Vertical Lines
■
When Is the Graph of an Equation a Line?
IN THIS SECTION… we find different ways of representing the equation of a line. These
help us to construct linear models of real-life situations in which we know “any two points”
or “a point and the rate of change”of a linear process.
GET READY… by reviewing Section 1.3, particularly how linear models are constructed
using the “rate of change” and “initial value” of a linear process.
In Section 2.2 we learned that the graph of a function with constant rate of change is
a line. We also saw that linear functions are useful in modeling many real-world sit-
uations. To find a linear model, we needed to know the “initial value” and the “rate
of change” (or “y-intercept” and “slope”). But often this particular information is not
available: We might know the rate of change and a particular value but not the initial
value, or we might simply know two values of the linear function.
166 CHAPTER 2
■
Linear Functions and Models
For example, one way to find the speed of a moving car is to use radar to find
the car’s distance at two different times. The two observations can be used to find a
linear function that models the motion of the car (see Example 2).
Our goal in this section is to find different forms for the equation of a line that
will help us in constructing linear models in different real-world situations.
2
■ Slope-Intercept Form
In this section we express linear functions as equations. Recall from Section 1.5 that
a function such as can be expressed in equation form as ,
where y is the dependent variable and x is the independent variable. In general, a
linear equation in two variables is an equation that can be put into the form
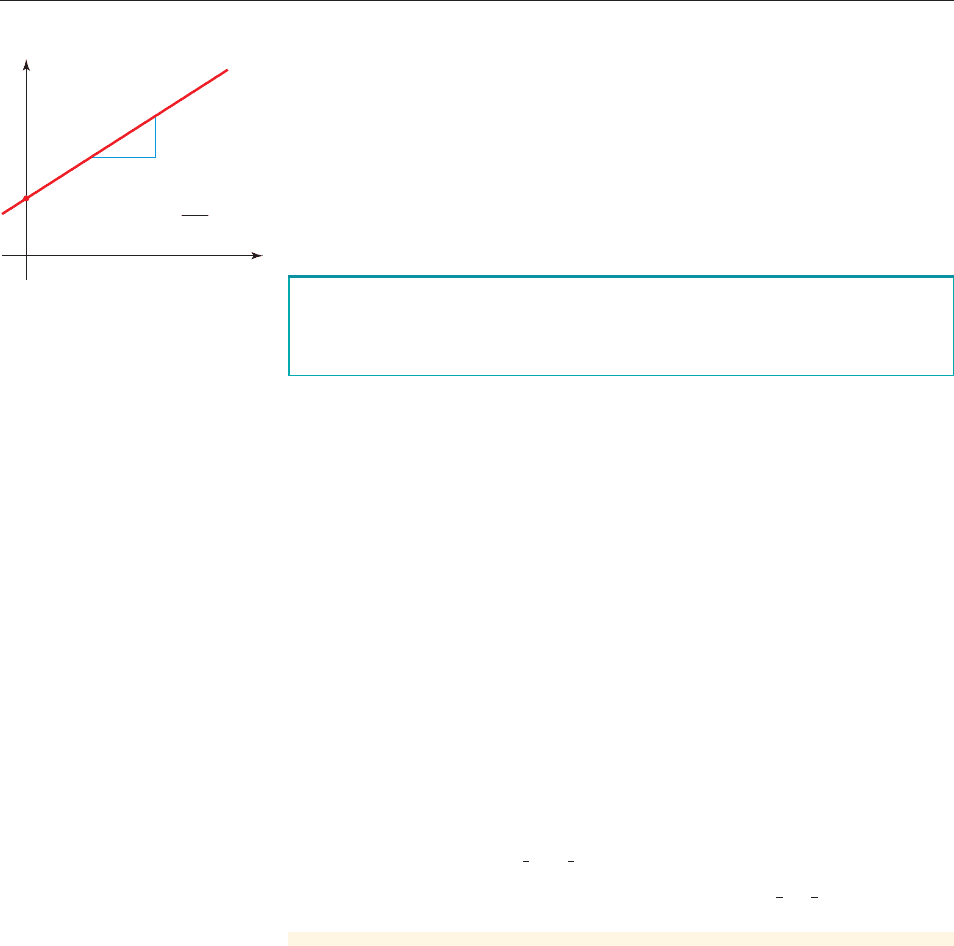
. We recognize this equation from Section 2.2 as the equation of a line
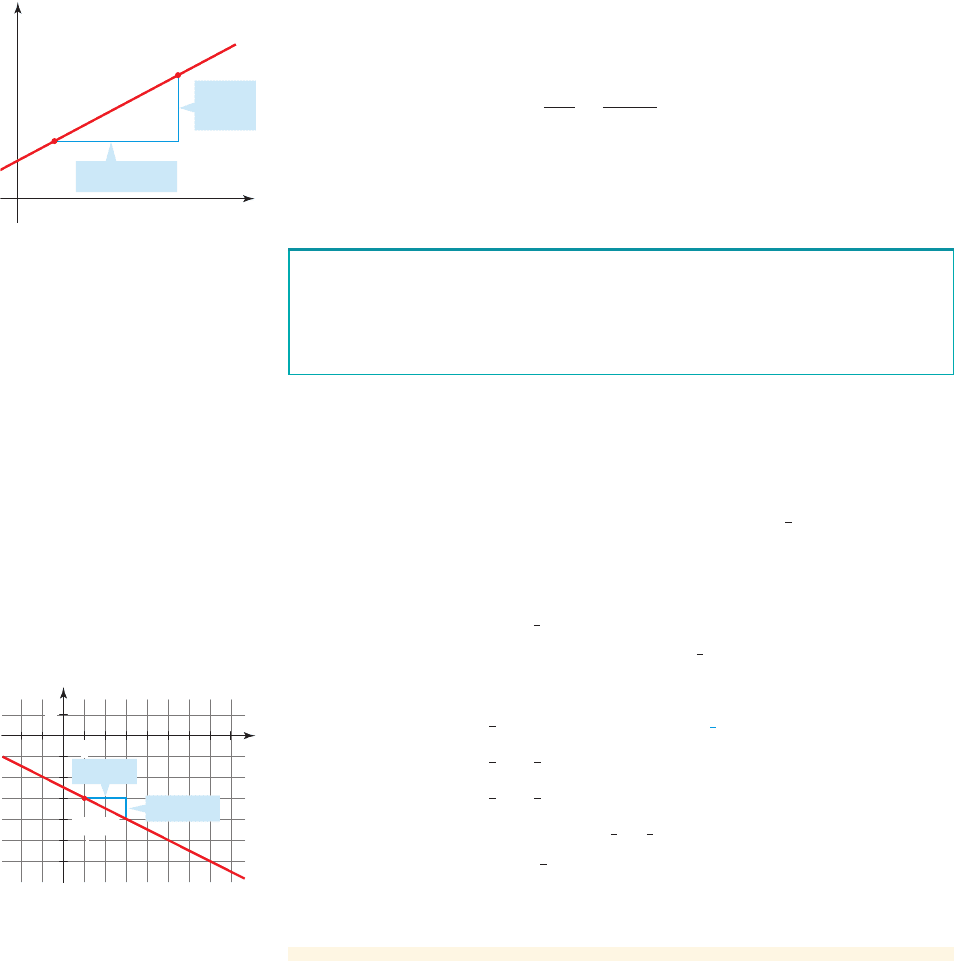
(that is, an equation whose graph is a line) with slope m and y-intercept b. See
Figure 1. This form of the equation of a line is called the slope-intercept form.
y = b + mx
y = 5 + 3xf 1x 2= 5 + 3x
rise
rise
run
run
m=
(0, b)
0
x
y
figure 1 A line with slope m and
y-intercept b
example
1
Lines in Slope-Intercept Form
An equation of the line that has slope m and y-intercept b is
y = b + mx
(a) Find an equation of the line with slope 3 and y-intercept .
(b) Put the equation in slope-intercept form.
Solution
(a) Using the slope-intercept form with m ⫽ 3 and , we get
Slope-intercept form
Replace m by 3 and b by
So the slope-intercept form of the equation of the line is .
(b) To put the equation into slope-intercept form, we solve for y.
Given equation
Add 2x
Divide by 3
So the slope-intercept form of the given equation is .
■ NOW TRY EXERCISES 11 AND 17 ■
y =
1
3
+
2
3
x
y =
2
3
x +
1
3
3 y = 2x + 1
3 y - 2x = 1
y =-2 + 3x
- 2 y =-2 + 3x
y = b + mx
b =-2
3y - 2x = 1
- 2
example
2
Constructing a Linear Model for Radar
A police officer uses radar to record his distance from a car traveling on a straight
stretch of road at two different times. The first measurement indicates that the car is
Slope-Intercept Form of the Equation of a Line
(The slope-intercept form can also be expressed as .)y = mx + b
350 feet from the officer; half a second later the car is 306 feet from the officer.
Assume that the car is traveling at a constant speed.
(a) Find a linear equation that models the distance y of the car from the police
officer at any time x.
(b) What is the speed of the car?
Solution
(a) Let’s choose the time of the first measurement to be time 0, that is, x ⫽ 0. So
the next measurement is at time . Then from the given data we get the
following two points:
The first of these two points tells us that the y-intercept is 350. Using the two
points together, we get the slope:
ft/s
So the linear equation that models the distance y that the car travels in x sec-
onds is
(b) The slope of the line we found in part (a) is the same as the rate of change of
distance with respect to time; that is, the slope is the speed of the car. So the
speed of the car is
ft/s
The negative sign indicates that the distance between the car and the police
officer is decreasing (because the car is heading in the direction of the officer).
For the purposes of giving the driver a ticket, the speed of the car is 88 feet per
second.
■ NOW TRY EXERCISE 57 ■
We can convert the answer to part (b) of Example 2 into the more familiar miles
per hour. There are 5280 feet in a mile and 3600 seconds in an hour. So
/h
So the car is traveling at a speed of 60 miles per hour.
= 60 mi
= 88 *
3600
5280
miles
hour
88
feet
seconds
= 88
feet
seconds
* 3600
seconds
hour
*
1
5280
miles
feet
speed = slope =-88
y = 350 - 88x
m =
306 ft - 350 ft
0.5 s - 0 s
=
- 44
0.5
ft
s
=-88
10, 3502and10.5, 3062
x = 0.5
SECTION 2.3
■
Equations of Lines: Making Linear Models 167
2
■ Point-Slope Form
We now find the equation of a line if we know the slope of the line and any point
on the line (not necessarily the y-intercept). So suppose a line has slope m and
Marty Bucella/www.CartoonStock.com
168 CHAPTER 2
■
Linear Functions and Models
example
3
Finding the Equation of a Line When We Know a Point
and the Slope
(x⁄, y⁄)
(x, y)
0
x
y
Run: x-x⁄
Rise:
y-y⁄
figure 2
An equation of the line that passes through the point and has
slope m is
y - y
1
= m 1x - x
1
2
1x
1
, y
1
2
(a) Find an equation of the line through with slope .
(b) Sketch a graph of the line.
Solution
(a) We know the slope m is , and a point on the line is . So we
use the point-slope form with m replaced by , by 1, and by :
Point-slope form
Replace m by by 1, and by
Distributive Property
Subtract 3
So an equation for the line is .
(b) The fact that the slope is tells us that when the run is 2, the rise is , so
when we move 2 units to the right, the line drops by 1 unit. This enables us to
sketch the line as in Figure 3.
■ NOW TRY EXERCISE 23 ■
In the next example we construct a linear model for a real-world situation in
which we don’t know the initial value. Compare it with Example 3 in Section 2.2, in
which we were given the initial value.
- 1-
1
2
y =-
5
2
-
1
2
x
y =-
1
2
x -
5
2
y + 3 =-
1
2
x +
1
2
- 3y
1
-
1
2
, x
1
y - 1- 3 2=-
1
2
1x - 1 2
y - y
1
= m 1x - x
1
2
- 3y
1
x
1
-
1
2
11, - 321x
1
, y
1
2-
1
2
-
1
2
11, - 32
0
x
y
Rise: _1
(1, _3)
1
1
Run: 2
figure 3
the point is on the line (see Figure 2). Any other point (x, y) lies on the
line if and only if the slope of the line through and (x, y) is equal to m.
This means that
This equation can be rewritten in the form . This is the point-
slope form for the equation of a line.
Point-Slope Form of the Equation of a Line
y - y
1
= m 1x - x
1
2
rise
run
=
y - y
1
x - x
1
= m
1x
1
, y
1
2
1x
1
, y
1
2
example
4
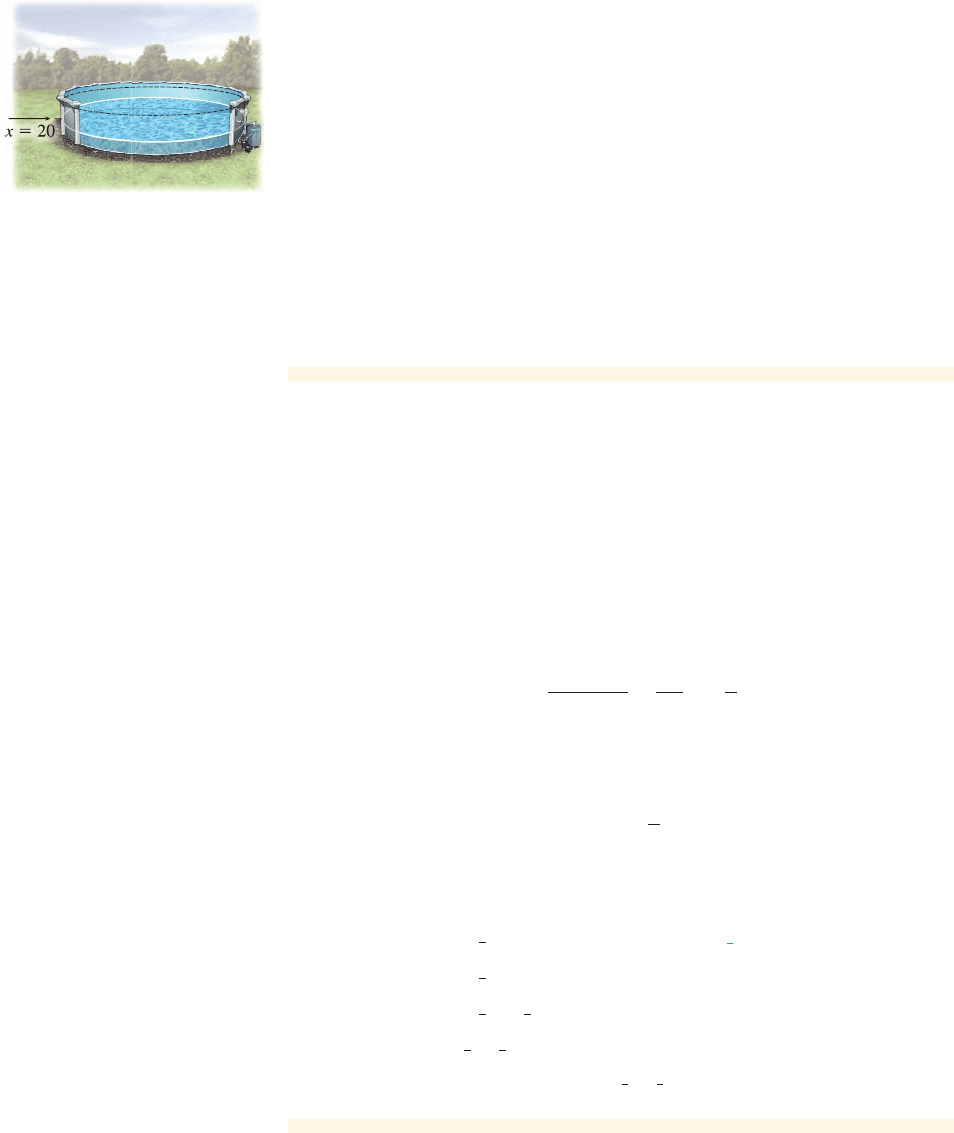
Constructing a Linear Model for Volume
Water is being pumped into a swimming pool at the rate of 5 gal/min. After 20 min-
utes the pool has 300 gallons of water. Find a linear equation that models the volume
of water in the pool at any time.
SECTION 2.3
■
Equations of Lines: Making Linear Models 169
Solution
We need to find a linear equation
that models the volume y of water in the pool at time x. The rate of change of vol-
ume is 5 gallons per minute, so m ⫽ 5. Since the pool has 300 gallons after 20 min-
utes, the point (20, 300) is on the desired line. So we have the following information
Now, using the point-slope form for the equation of a line, we get
Point-slope form
Replace m by by by 300
Distributive Property
Add 300
So the linear equation that models the volume of water is .
■ NOW TRY EXERCISE 61 ■
In Examples 3 and 4 we were given one point on a line and the slope. If instead
we are given two points on the line, we can still use the point-slope form to find an
equation, because we can first use the two given points to find the slope.
y = 200 + 5x
y = 200 + 5x
y - 300 = 5x - 100
20, and y
1
5, x
1
y - 300 = 51x - 20 2
y - y
1
= m 1x - x
1
2
Slope:
m = 5
Point:1x
1
, y
1
2= 120, 3002
y = b + mx
There are 300 gallons of water in
the pool at time x = 20.
example
5
Finding an Equation for a Line Through Two Given Points
Find an equation of the line passing through the points and .
Solution
We first use the two given points to find the slope:
We now have the following information about the desired line:
Using the point-slope form for the equation of a line, we get
Point-slope form
Replace m by by by 2
Simplify
Distributive Property
Add 2
So the equation of the desired line is .
■ NOW TRY EXERCISE 31 ■
y =
1
2
-
3
2
x
y =
1
2
-
3
2
x
y - 2 =-
3
2
x -
3
2
y - 2 =-
3
2
1x + 1 2
- 1, y
1
-
3
2
, x
1
y - 2 =-
3
2
1x - 1- 122
y - y
1
= m 1x - x
1
2
Slope: m =-
3
2
Point:1x
1
, y
1
2= 1- 1, 2 2
m =
- 4 - 2
3 - 1- 12
=
- 6
4
=-
3
2
13, - 421- 1, 22
We can use either point, or
, in the point-slope equation.
We end up with the same linear
equation. Try it!
13, - 42
1- 1, 22
170 CHAPTER 2
■
Linear Functions and Models
example
6
Constructing a Linear Model for Demand
A vending machine operator services the soda pop machines in a freeway rest
area. He finds that the number of cans of soda that he sells each week depends
linearly on the price that he charges. At a price of $1.00 per can of soda he sells
600 cans, but for every 25-cent increase in the price, he sells 75 fewer cans each
week.
(a) Model the number of cans y that he sells each week at price x by a linear
equation (or line), and sketch a graph of this equation.
(b) How many cans of soda will he sell if he charges 60 cents per can? If he
charges $2.00 per can?
(c) Find the slope of the line. What does the slope represent?
(d) Find the y-intercept of the line. What does it represent?
(e) Find the x-intercept of the line. What does it represent?
Solution
(a) Since the number of cans y that the vendor sells depends linearly on the price
x, the model we want is a linear equation:
We already know two points on this line:
This is because when the price is $1.00, the number of cans sold is 600, and
when the price is $1.25, the number of cans sold is 525. From these two points
we obtain the slope of the line:
So we have the following information about the desired line:
Now, using the point-slope form for the equation of a line, we get
Point-slope form
Replace m by by 1, by 600
Distributive Property
Add 600
So the desired equation is . A graph of this equation is shown
in Figure 4.
(b) At a price of 60 cents he sells . At a price of
$2.00 he sells .
(c) The slope is . This means that sales drop by 300 cans for every $1.00
increase in price.
- 300
y = 900 - 30012.002= 300 cans
y = 900 - 30010.602= 720 cans
y = 900 - 300x
y =-300x + 900
y - 600 =-300x + 300
y
1
- 300, x
1
y - 600 =-3001x - 12
y - y
1
= m 1x - x
1
2
Slope: m =-300
Point:1x
1
, y
1
2= 11, 6002
m =
525 - 600
1.25 - 1
=-300
11, 6002and11.25, 5252
y = b + mx
Notice that the rate of change of y
(the number of cans sold) is
negative. This reflects the fact that
as the price x increases, the number
of cans sold decreases.
123
200
400
600
800
1000
0
x
y
figure 4 Graph of the equation
y = 900 - 300x
SECTION 2.3
■
Equations of Lines: Making Linear Models 171
(d) The y-intercept is 900. This represents the theoretical number of cans he
would “sell” at a price of x ⫽ 0, that is, if he were giving the soda away for
free.
(e) To find the x-intercept, set y ⫽ 0 and solve for x.
Replace y by 0
Add 300x to each side
Divide by 300
So the x-intercept is 3. This means that if he charges $3.00 per can, he will sell
no soda at all.
■ NOW TRY EXERCISE 63 ■
Economists call equations like those in Example 4 demand equations because
they express the demand for a product (the number of units sold) in terms of the
price. With the aid of such equations economists can estimate the optimal price a
vendor should charge to get the maximum profit from sales (see Section 2.7).
x = 3
300x = 900
0 =-300x + 900
2
■ Horizontal and Vertical Lines
x=a
a
0
x
y
y=b
b
0
x
y
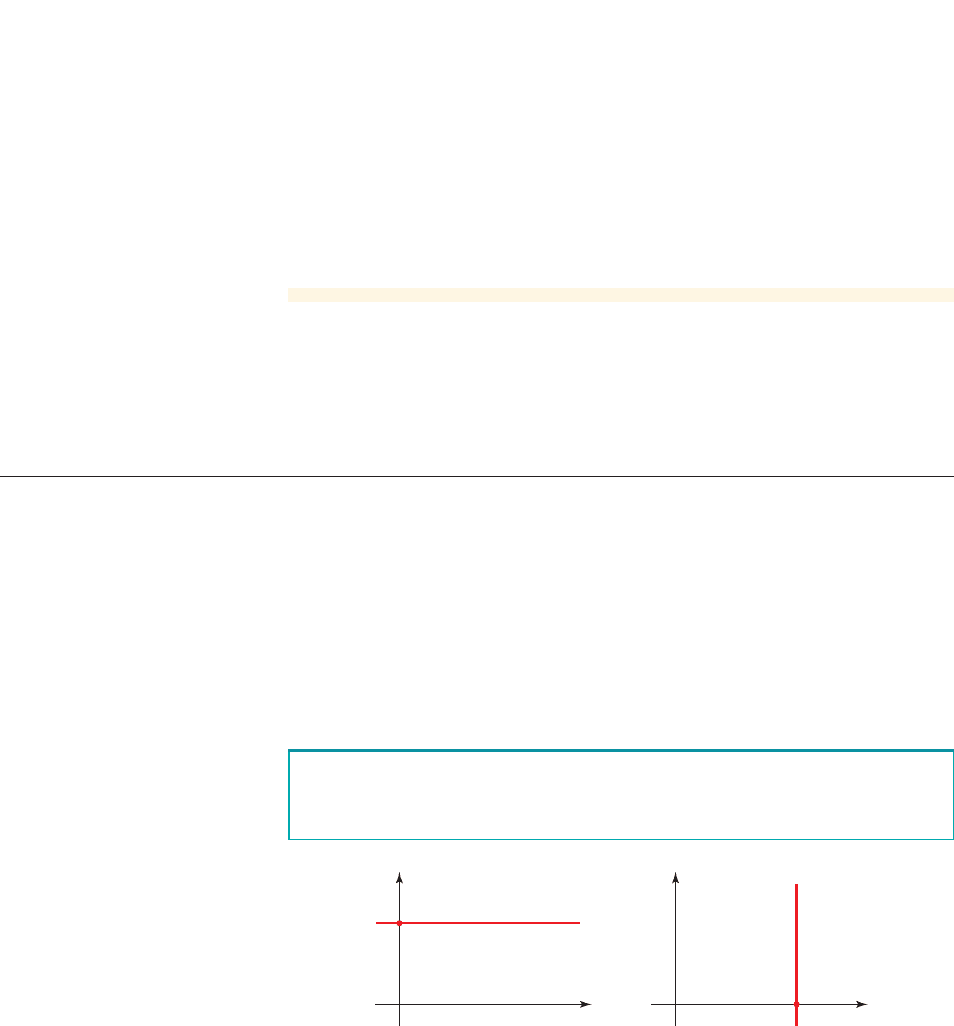
figure 5
■
An equation of the vertical line through (a, b) is x ⫽ a.
■
An equation of the horizontal line through (a, b) is y ⫽ b.
If a line is horizontal, then it neither rises nor falls, which means that between any
two points, the rise is 0 and hence the slope m is also 0. So from the slope-intercept
form of a line we see that a horizontal line has equation . A vertical line does
not have a slope, because between any two points the run is zero, and division by 0
is impossible. Nevertheless, we can write the equation of a vertical line as x ⫽ a,
where a is its x-intercept, because the x-coordinate of every point on the line is a.
(See Figure 5.)
Horizontal and Vertical Lines
y = b
example
7
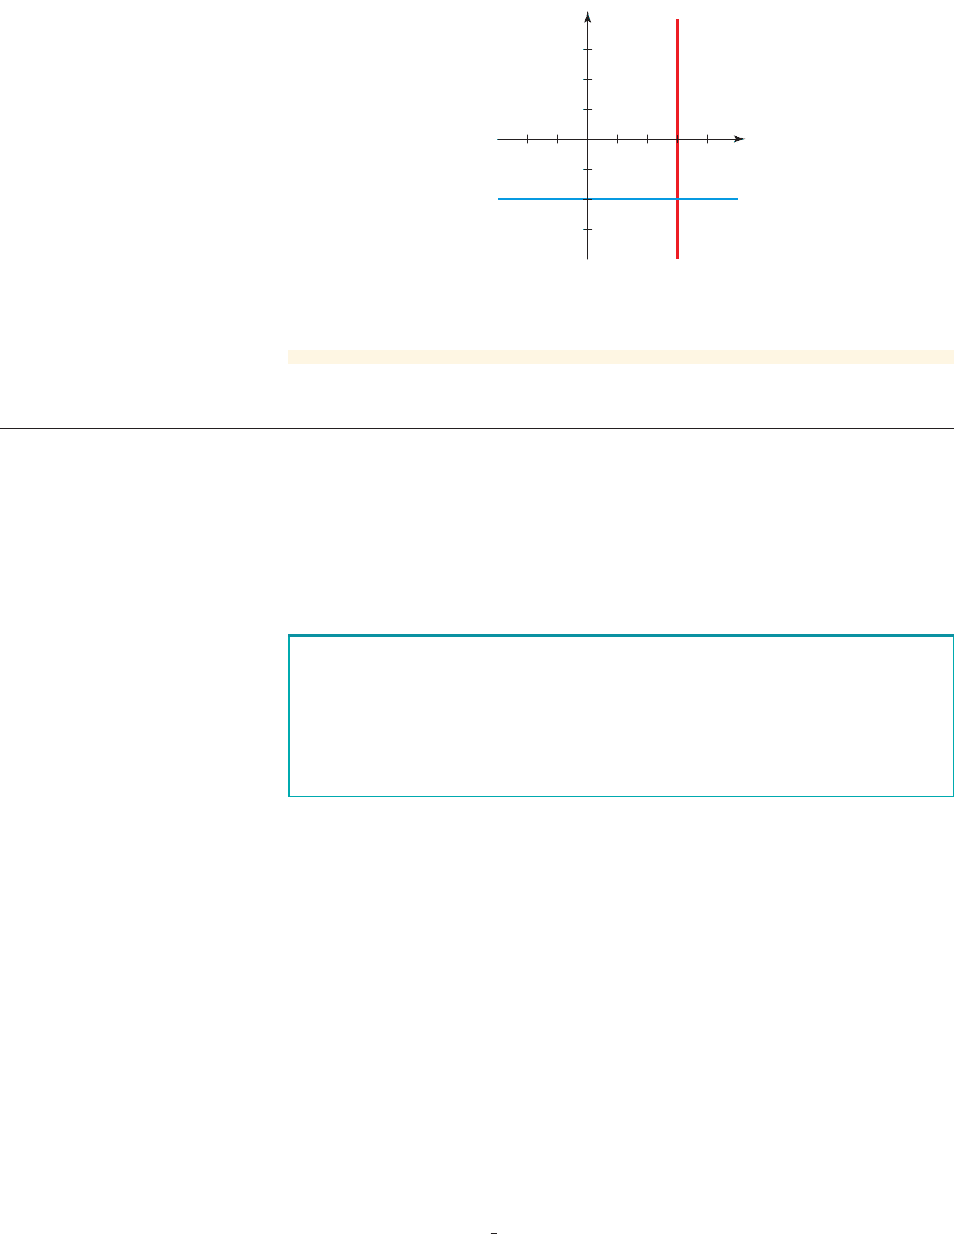
Horizontal and Vertical Lines
(a) The graph of the equation x ⫽ 3 is a vertical line with x-intercept 3.
(b) The graph of the equation is a horizontal line with y-intercept .
The lines are graphed in Figure 6 on the next page.
- 2y =-2
172 CHAPTER 2
■
Linear Functions and Models
x
y
2
x=3
0
2
4_2
y=_2
figure 6
2
■ When Is the Graph of an Equation a Line?
Every line in the coordinate plane is either vertical, horizontal, or slanted at a
nonzero slope m. Thus every line has an equation of the form x ⫽ a, y ⫽ b, or
. All of these equations can be put into the form ,
so this is called the general form of the equation of a line.
Ax + By + C = 0y = b + mx
The graph of every general linear equation
is a line (where not both A and B are 0). Conversely, every line has an
equation of this form.
Ax + By + C = 0
From the general form of a linear equation we can readily find the x- and y-
intercepts and then use them to graph the equation, as illustrated in the next example.
example
8
Graphing a General Linear Equation
For the linear equation
(a) Find the slope of the line.
(b) Find the x- and y-intercept.
(c) Use the intercepts to sketch a graph.
Solution
(a) To find the slope, we put the equation into slope-intercept form:
General form of the equation of the line
Subtract from each side
Divide by -3 y =
2
3
x - 4
2x - 12 - 3y =-2x + 12
2 x - 3y - 12 = 0
2x - 3y - 12 = 0,
■ NOW TRY EXERCISES 41 AND 45 ■
General Form of the Equation of a Line
SECTION 2.3
■
Equations of Lines: Making Linear Models 173
Comparing this last equation with the slope-intercept form , we see
that the slope m is .
(b) To find the x-intercept, we replace y by 0 and solve for x.
Replace y by 0
Add 12 to each side
Divide by 2
So the x-intercept is 6.
To find the y-intercept, we replace x by 0 and solve for y.
Replace x by 0
Add 12 to each side
Divide by
So the y-intercept is .
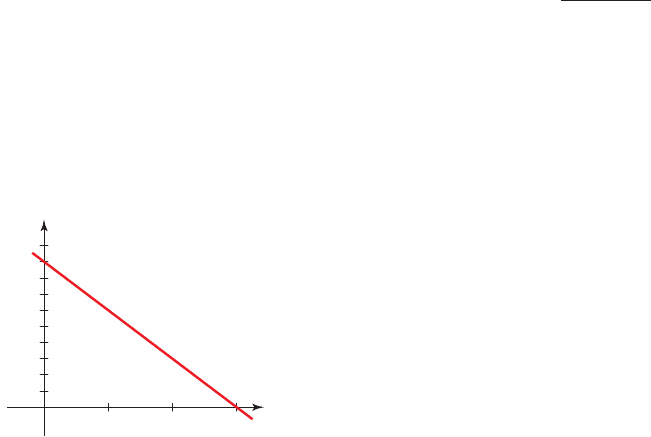
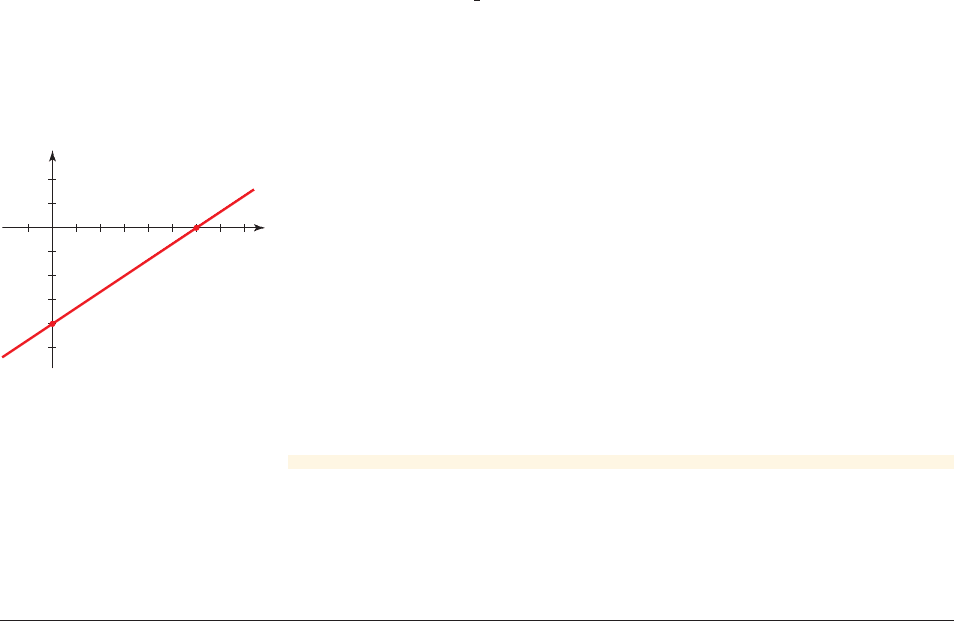
(c) To graph a line, we need two points. It is convenient to use the two points at
the intercepts: and (6, 0). We plot the intercepts and sketch the line
that contains them in Figure 7.
■ NOW TRY EXERCISE 53 ■
10, - 42
- 4
- 3 y =-4
- 3y = 12
2 102- 3y - 12 = 0
x = 6
2 x = 12
2 x - 3102- 12 = 0
2
3
y = b + mx
2.3 Exercises
x
y
0
(0, _4)
(6, 0)
1
1
figure 7 Graph of
2x - 3y - 12 = 0
CONCEPTS
Fundamentals
1. An equation of the line with slope m and y-intercept b is . So an
equation of the line with slope 2 and y-intercept 4 is
_______.
2. An equation of the line with slope m and passing through the point is
. So an equation of the line with slope 3 passing through the
point (1, 2) is
_______.
3. (a) The slope of a horizontal line is
_______ (zero/undefined). An equation of the
horizontal line passing through (2, 3) is
_______.
(b) The slope of a vertical line is
_______ (zero/undefined). An equation of the
vertical line passing through (2, 3) is
_______.
4. To find an equation for the line passing through two points, we first find the slope
determined by these two points, then use the
_______ _______ form for the equation
of a line. The line passing through the points (2, 5) and (3, 7) has slope
_______, so
the point-slope form of its equation is
______________.
5. (a) The graph of the equation y ⫽ 5 is a
_______ (horizontal/vertical) line. The slope
of the line is
_______ (zero/undefined).
(b) The graph of the equation x ⫽ 5 is a
_______ (horizontal/vertical) line. The slope
of the line is
_______ (zero/undefined).
(c) An equation of the line passing through the point (0, 2) with slope 0 is
_______.
y -
ⵧ
=
ⵧ
1x -
ⵧ
2
1x
1
, y
1
2
y =
ⵧ
+
ⵧ
x