Stewart J. College Algebra: Concepts and Contexts
Подождите немного. Документ загружается.

144 CHAPTER 2
■
Linear Functions and Models
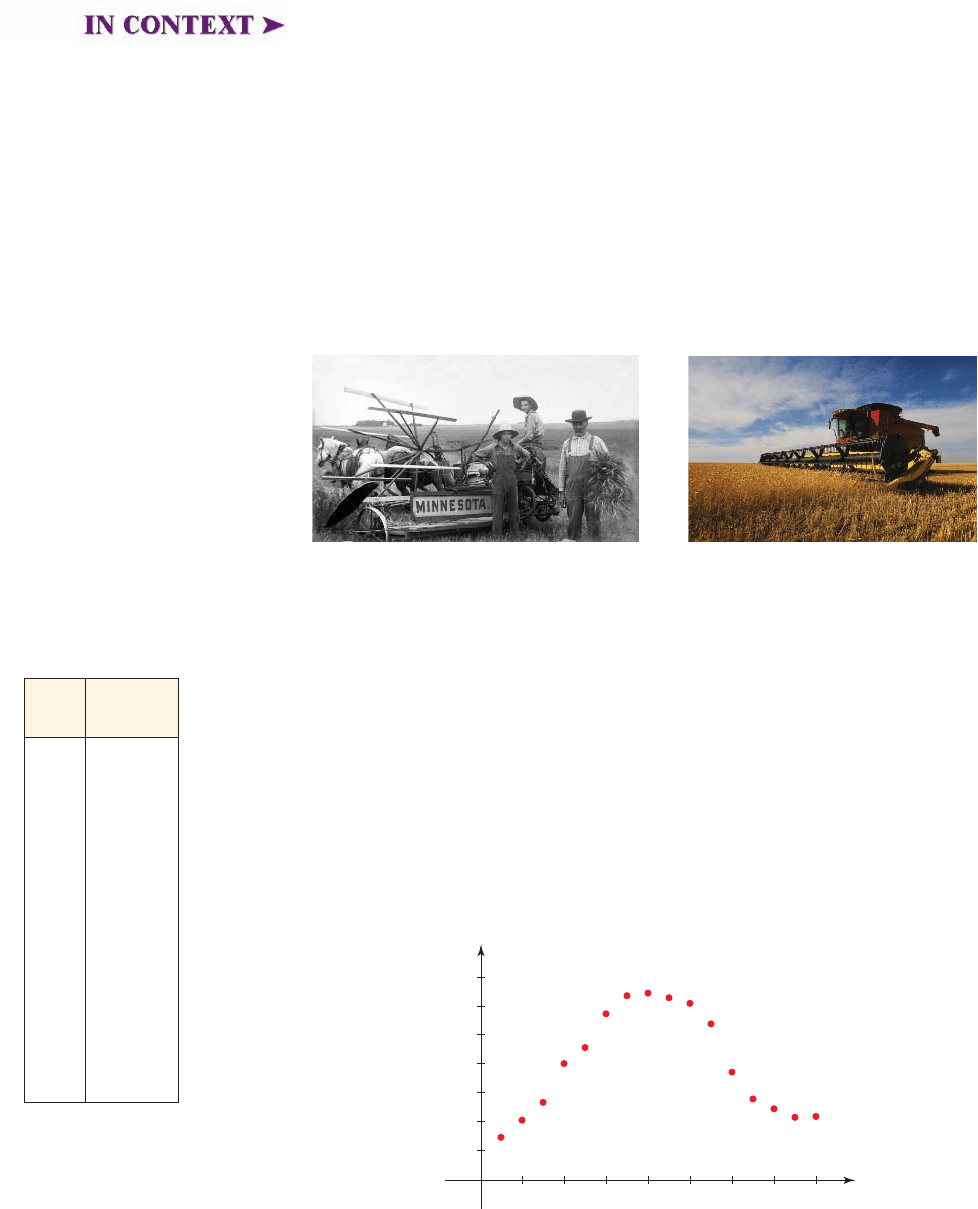
Farming has always been an important part of the U.S. economy. In the 19th
century the United States was very much an agrarian society; more than 75% of the
labor force was engaged in some aspect of farming. Westward expansion of the U.S.
population was fueled to a great extent by the search for new land to homestead
and farm. As a result there was a dramatic increase in the number of farms in the
United States. Most farms were family owned and operated. In the mid-20th cen-
tury new automated farming methods and improved strains of crops led to an in-
crease in farm productivity. Large corporate farming enterprises arose, and many
smaller farmers found it impossible to remain profitable and sold their land to the
corporate enterprises. As a result the number of farms decreased as the size of in-
dividual farms increased. Because of the efficiencies of scale, fewer workers were
required to operate these larger farms, resulting in a population shift from rural to
urban areas.
example
2
Number of Farms in the United States
Year
Farms
(ⴛ 1000)
1850 1449
1860 2044
1870 2660
1880 4009
1890 4565
1900 5740
1910 6366
1920 6454
1930 6295
1940 6102
1950 5388
1960 3711
1970 2780
1980 2440
1990 2143
2000 2172
Farming in the 19th century
Farming in the 21st century
The table in the margin gives the number of farms in the United States from 1850 to
2000.
(a) Draw a scatter plot of the data.
(b) Find the average rate of change in the number of farms between the following
years: (i) 1860 and 1890; (ii) 1950 and 1970.
(c) In which decade did the number of farms experience the greatest average rate
of decline?
Solution
(a) A scatter plot is shown in Figure 3.
2000
1000
3000
4000
5000
6000
7000
1860 1880 1900 1920 1940 1960 1980 2000
0
x
y
figure 3 Number of farms in the
United States (in thousands)
© Minnesota Historical Society/CORBIS
Stephen Mcsweeny/Shutterstock.com 2009
IN CONTEXT ➤

SECTION 2.1
■
Working with Functions: Average Rate of Change 145
(b) (i) The average rate of change between 1860 and 1890 is
/year
So the number of farms increased at an average rate of 84,000 farms per year.
(ii) The average rate of change between 1950 and 1970 is
/year
Since the average rate of change is negative, the number of farms decreased at
an average rate of 130,400 farms per year.
(c) From the graph we see that the steepest drop in a single decade occurred
between 1950 and 1960.
■ NOW TRY EXERCISE 25 ■
average rate of change =
2780 - 5388
1970 - 1950
=-130.4 thousand farms
average rate of change =
4565 - 2044
1890 - 1860
= 84.0 thousand farms
2
■ Average Speed of a Moving Object
example
3
Average Speed in a Bicycle Race
James and Jodi compete in a bicycle race. The graphs in Figure 4 on the next page
show the distance each has traveled as a function of time. We plot the time (in hours)
on the t-axis and the distance (in miles) on the y-axis.
(a) Describe the bicycle race.
(b) Find James’s and Jodi’s average speeds for the entire race.
(c) Find Jodi’s average speed between t ⫽ 2 hours and t ⫽ 4 hours.
(d) Find James’s average speed between t ⫽ 2 hours and t ⫽ 4 hours.
(e) Find Jodi’s average speed in the final hour of the race.
For a moving object, let be the distance it has traveled at time t. Then
the average rate of change of the function s from time t
1
to time t
2
is called
the average speed:
Average speed =
net change in distance
change in time
=
s 1t
2
2- s 1t
1
2
t
2
- t
1
s 1t2
If you drive your car a distance of 60 miles in 2 hours, then your average speed is
/hour
In general, if a function represents the distance traveled, the average rate of change
of the function is the average speed of the moving object.
Average Speed of a Moving Object
60 miles
2 hours
= 30 miles
146 CHAPTER 2
■
Linear Functions and Models
Solution
(a) From the graphs in Figure 4 we see that the race had a fair start with both
James and Jodi starting the race at time zero. However, the differences in the
graphs show that they don’t always cycle at the same pace. James travels at a
steady speed throughout the race, but Jodi varies her speed, traveling slowly in
the beginning of the race and speeding up in the end. Even though the graphs
are very different, in the end the race is a tie, since both competitors finish the
race at the same time.
(b) The average speed for Jodi and James is the same, since they both travel 60
miles in 5 hours:
/h
So they each cycle at an average speed of 12 miles per hour.
(c) The total time elapsed is 4 ⫺ 2 ⫽ 2 hours. From the graph we see that the
distance Jodi traveled in this time is 38 ⫺ 10 ⫽ 28 miles. So Jodi’s average
speed in this time interval is
/h
(d) Similarly, James’s average speed between and is
/h
(e) Jodi’s average speed in the final hour of the race is
/h
■ NOW TRY EXERCISE 27 ■
average speed =
net change in distance
change in time
=
60 - 38
5 - 4
= 22 mi
average speed =
net change in distance
change in time
=
48 - 24
4 - 2
= 12 mi
t = 4 ht = 2 h
average speed =
net change in distance
change in time
=
38 - 10
4 - 2
= 14 mi
average speed =
net change in distance
change in time
=
60 mi - 0 mi
5 h - 0 h
= 12 mi
40
60
20
30
50
10
1234
James’s bicycle race
5
0
t
y
40
60
20
30
50
10
1234
Jodi’s bicycle race
5
0
t
y
figure 4
SECTION 2.1
■
Working with Functions: Average Rate of Change 147
2
■ Functions Defined by Algebraic Expressions
The concept of average rate of change applies to any function. In the next example
we find average rates of change for a function defined by an algebraic expression.
example
4
Average Rate of Change of a Function
Find the average rate of change of the function between the follow-
ing values of x.
(a) and
(b) and
Solution
(a) The average rate of change of f between and is
So on the interval the values of the function f decrease an average of
2 units for each unit change in x.
(b) The average rate of change of f between and is
So on the interval [2, 5] the values of the function f increase an average of
7 units for each unit change in x.
■ NOW TRY EXERCISES 13 AND 15 ■
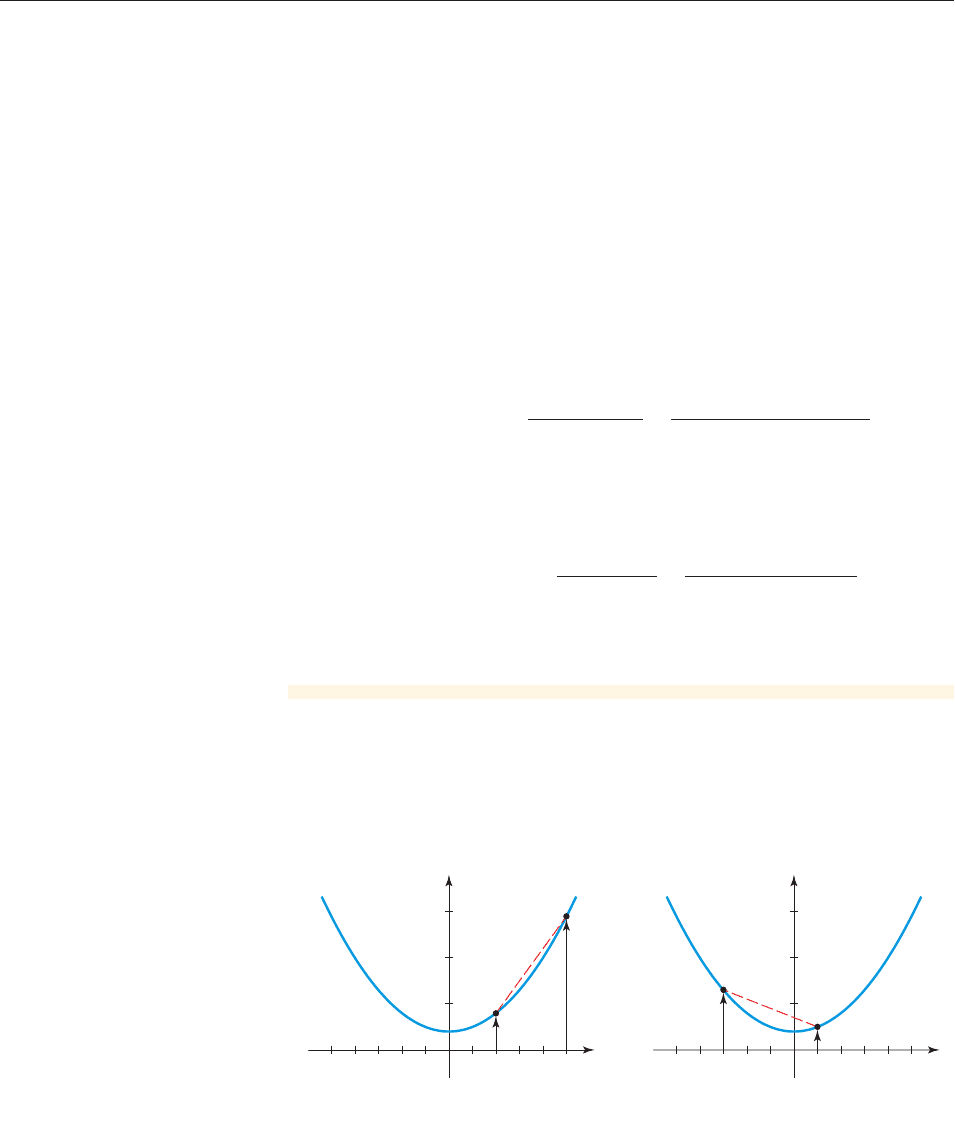
From the graphs in Figure 5 we can see why the average rate of change of f is
positive between and but negative between and .x = 1x =-3x = 5x = 2
average rate of change =
f 15 2- f 122
5 - 2
=
15
2
+ 42- 12
2
+ 42
5 - 2
= 7
x = 5x = 2
3- 3, 14
average rate of change =
f 11 2- f 1- 32
1 - 1- 32
=
11
2
+ 42- 11- 32
2
+ 42
1 + 3
=-2
x = 1x =-3
x = 5x = 2
x = 1x =-3
f 1x2= x
2
+ 4
30
20
10
2345_3_2_5_4 _1 1
A net increase in the value of f between
x=2 and x=5
A net decrease in the value of f between
x=_3 and x=1
0
x
y
30
20
10
2345_3_2_5_4 _1 1
0
x
y
figure 5
148 CHAPTER 2
■
Linear Functions and Models
2.1 Exercises
CONCEPTS
Fundamentals
1. (a) The average rate of change of a function between and is
.
(b) If and , then the average rate of change of f between and
is
2. The graphs of functions f, g, and h are shown. Between and the function
________ has average rate of change of 0, the function ________ has positive average
rate of change, and the function
________ has negative average rate of change.
x = 3x = 0
-
-
= ________.
x = 5
x = 2f 152= 10f 122= 3
change in ____
change in ____
=
f
1
ⵧ
2- f 1
ⵧ
2
ⵧ
-
ⵧ
x = bx = ay = f 1x 2
1
0
x
f
y
1
0
x
g
y
1
0
x
h
y
It is known that when an object is dropped in a vacuum, the distance the object falls
in t seconds is modeled by the function
where s is measured in feet (ignoring the effects of wind resistance on the speed).
Use the function s to find the average speed of a bungee jumper during the follow-
ing time intervals:
(a) The first second of the jump (that is, between and )
(b) The third second of the jump (that is, between and )
Solution
(a) The average speed of the bungee jumper in the first second of the jump is
/s
(b) Similarly, the average speed of the bungee jumper in the third second of the jump is
/s
■ NOW TRY EXERCISE 29 ■
average speed =
s 132- s 122
3 - 2
=
1613
2
2- 1612
2
2
1
= 80 ft
average speed =
s 112- s 102
1 - 0
=
1611
2
2 ft - 1610
2
2 ft
1 s - 0 s
= 16 ft
t = 3t = 2
t = 1t = 0
s 1t2= 16t
2
example
5
Bungee Jumping
SECTION 2.1
■
Working with Functions: Average Rate of Change 149
2
3
4
5
6
1
12
0
x
y
f
g
Think About It
3. True or false?
(a) If a function has positive net change between and , then the function
has positive average rate of change between and .
(b) If a function has positive average rate of change between and , then the
function has positive net change between and .
4. The graphs of the functions f and are shown in the margin. The function
_______ ( f or )
has a greater average rate of change between and . The function
_______
( f or ) has a greater average rate of change between and . The functions f
and have the same average rate of change between and .
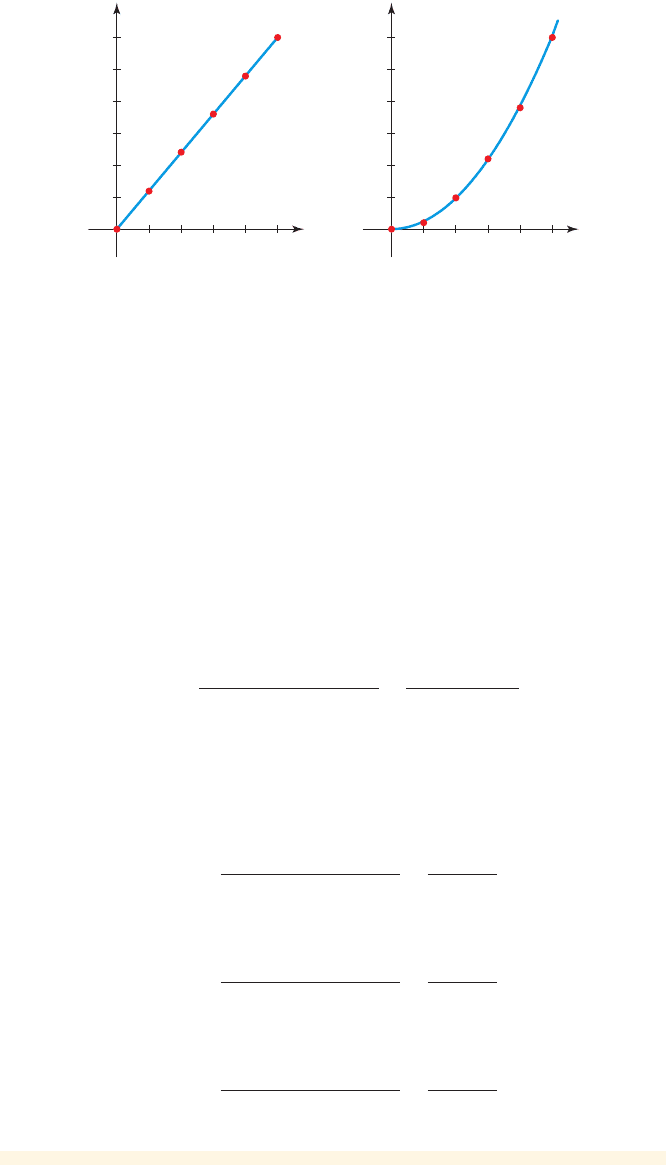
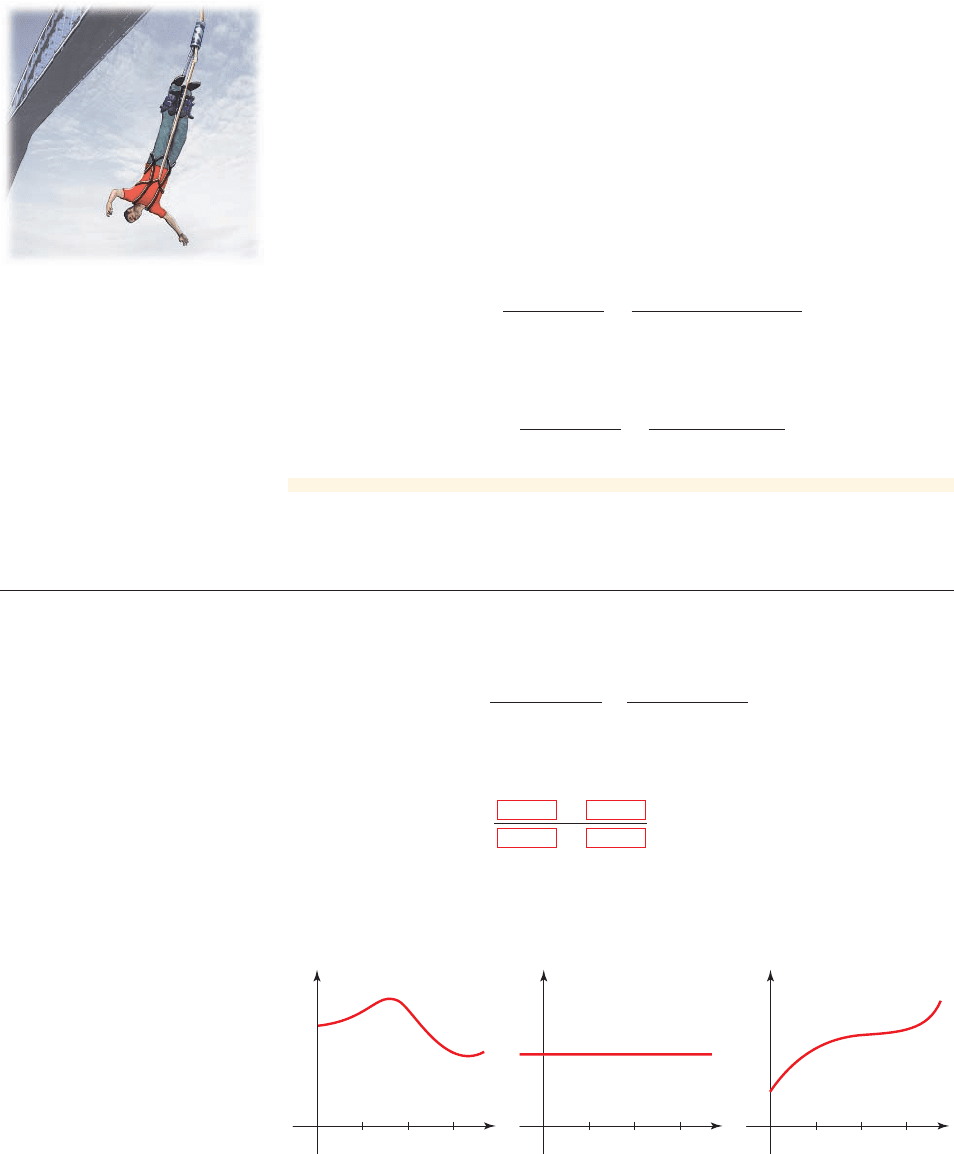
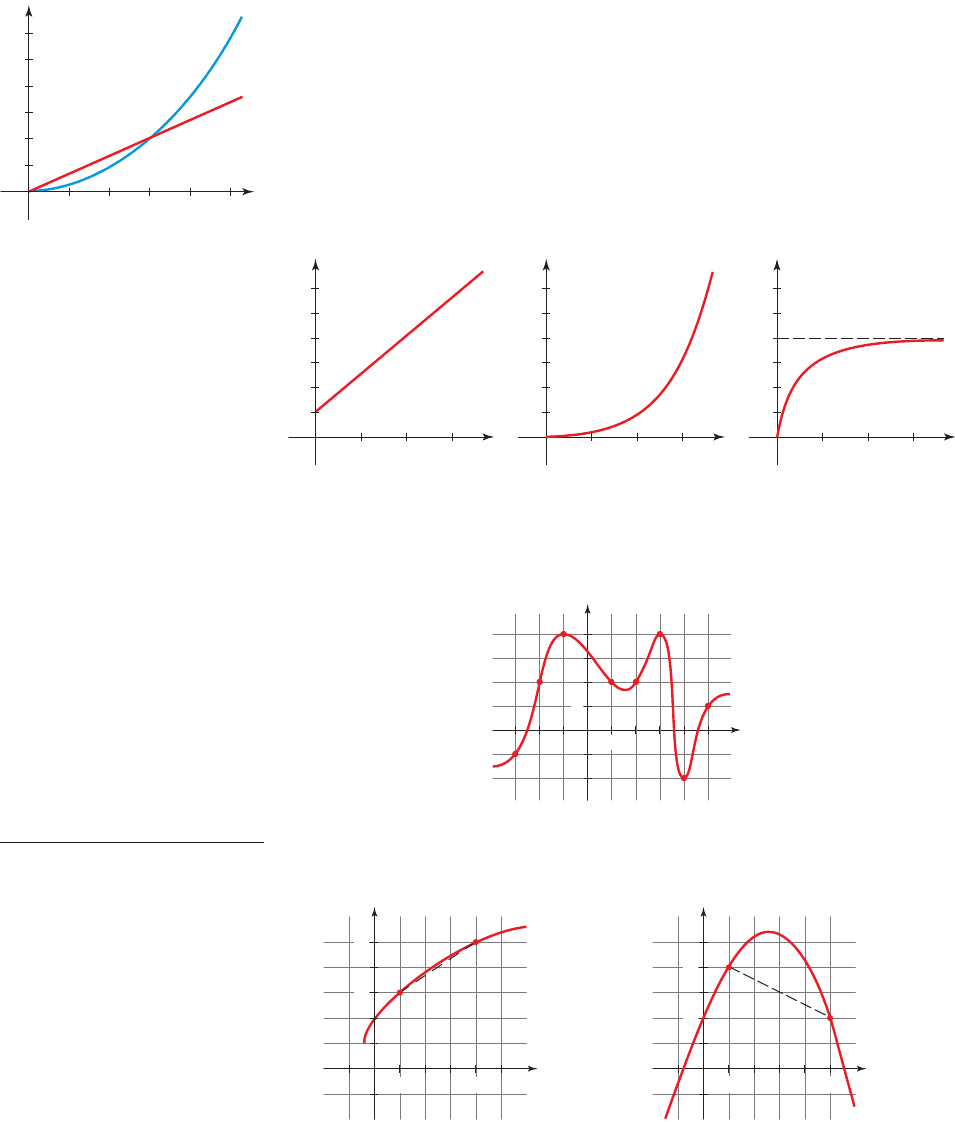
5. Graphs of the functions f, , and h are shown below. What can you say about the average
rate of change of each function on the successive intervals [0, 1], [1, 2], [2, 3], . . .?
g
x ⫽ ________x ⫽ ________g
x = 2x = 1g
x = 1x = 0
gg
x = 1x = 0
x = 1x = 0
x = 1x = 0
x = 1x = 0
6. The graph of a function f is shown below. Find x-values a and b so that the average rate
of change of f between a and b is
(a) 0 (b) 2 (c) (d) - 2- 1
1
1
2
3
4
5
6
0
x
f
1
2
3
4
5
6
1
2
3
4
5
6
y y y
1
0
x
g
1222333
0
x
h
y
x
0
1
1
SKILLS
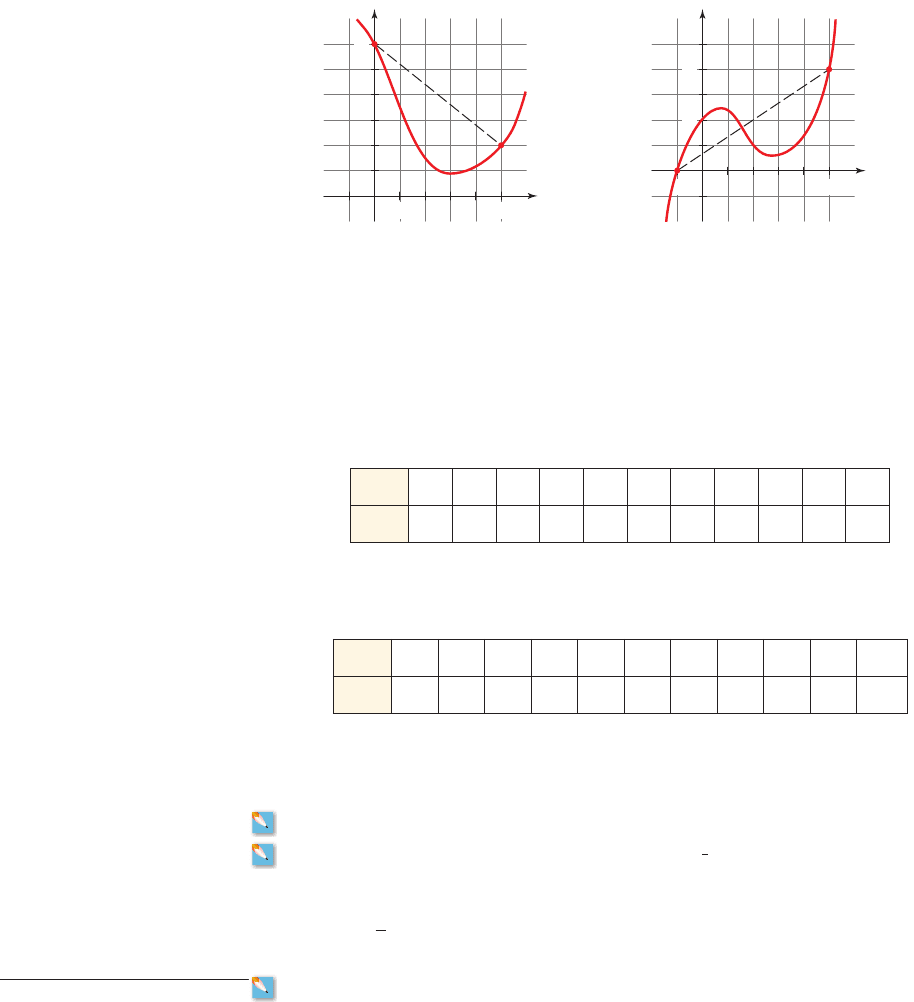
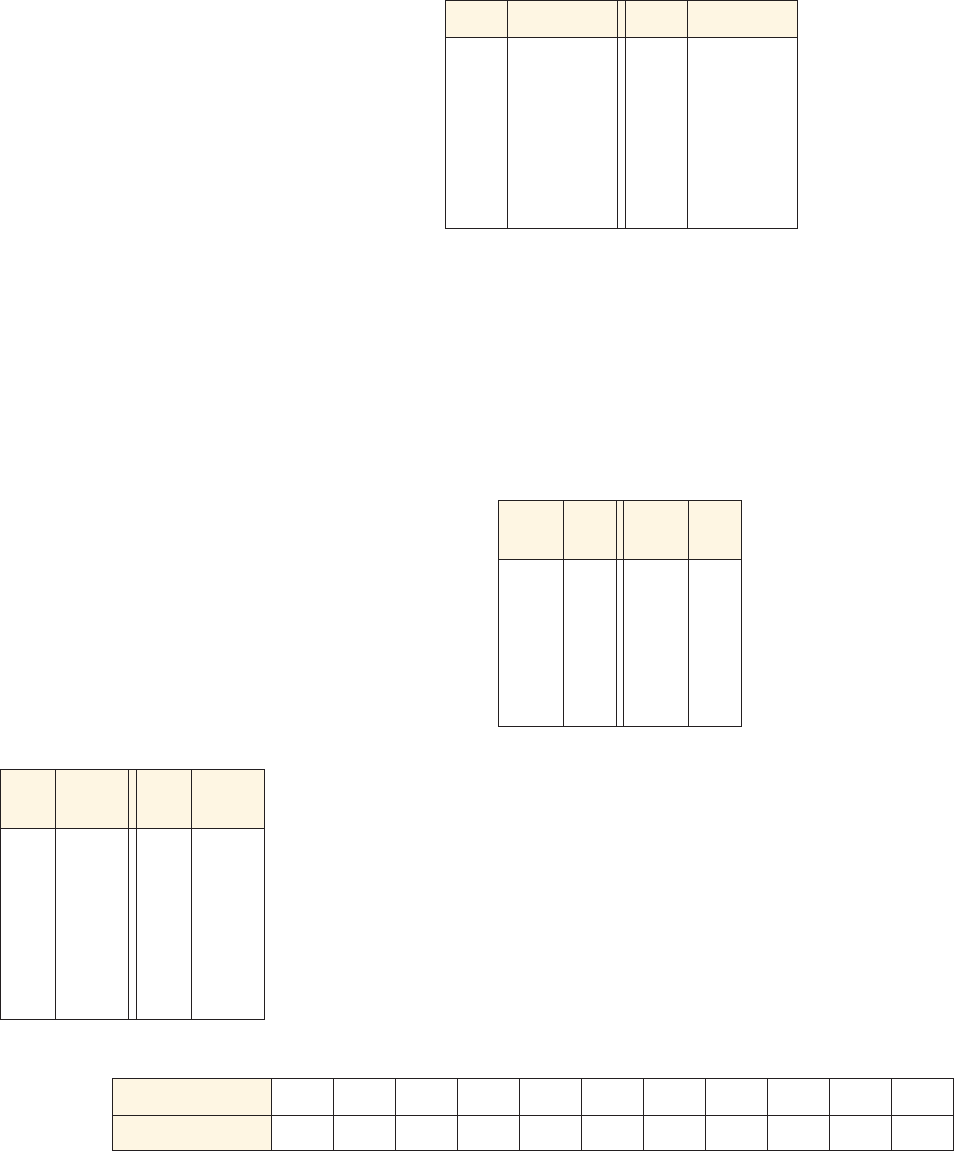
7–10 ■ The graph of a function is given. Determine the average rate of change of the
function between the indicated points.
7. 8.
y
x
0
14
3
5
y
x
0
15
2
4
150 CHAPTER 2
■
Linear Functions and Models
9. 10.
y
x
0
15
6
y
x
0
_1 5
2
4
11–12 ■ A function is given by a table.
(a) Determine the average rate of change of the function between the given values of x.
(b) Graph the function.
(c) From your graph, find the two successive points between which the average rate of
change is the largest. What is this rate of change?
11. (i) Between and
(ii) Between and x = 9x = 4
x = 4x = 2
x 0 1 2 3 4 5 6 7 8 9 10
F(x) 10 20 50 70 90 80 65 60 50 60 80
12. (i) Between and
(ii) Between and x = 90x = 20
x = 50x = 0
x 0 10 20 30 40 50 60 70 80 90 100
G(x) 3.3 3.0 2.5 1.7 1.7 0.8 2.2 4.5 5.0 5.5 6.0
13–20 ■ A function is given. Determine the average rate of change of the function between
the given values of x.
13. 14.
15. 16.
17. 18.
19. 20. k 1x 2= x
3
;x = 2, x = 4k 1x 2=
6
x
;x = 1, x = 3
h 1x 2= 2x - x
2
;x = 2, x = 4h 1x 2= x
2
+ 3x;x =-1, x = 1
g1x 2=
1
2
x
2
+ 4;x =-2, x = 0g1x 2= 1 - 2x
2
;x = 0, x = 1
f 1x 2= 5 - 7x;
x =-1, x = 3f 1x 2= 3x + 2;x = 2, x = 5
21. Population of Atlanta In the latter part of the 20th century the United States
experienced a large population shift from the cities to the suburbs. This is true of
Atlanta, for example, whose population grew steadily for its first hundred years, then
began to decline. Within the last two decades Atlanta’s population has started to rise
again, as seen in the table at the top of the next page.
(a) Draw a scatter plot of the data.
(b) Find the average rate of change of the population of Atlanta between the following
years: (i) 1850 and 1950 (ii) 1950 and 2000 (iii) 1950 and 1970
CONTEXTS
SECTION 2.1
■
Working with Functions: Average Rate of Change 151
22. Cooling Soup When a bowl of hot soup is left in a room, the soup eventually cools
down to the temperature of the room. The temperature of the soup is a function of
time t. The temperature changes more slowly as the soup gets closer to room
temperature. The table below shows the temperature (in degrees Fahrenheit) of the soup
t minutes after it was set down.
(a) What was the temperature of the soup when it was initially placed on the table?
(b) Find the average rate of change of the temperature of the soup over the first 20
minutes and over the next 20 minutes. On which interval did the temperature
decline more quickly?
T 1t 2
Yea r Population
1850 2572
1860 9554
1870 21,789
1880 37,409
1890 65,533
1900 89,872
1910 154,839
1920 200,616
Year Population
1930 270,688
1940 302,288
1950 331,000
1960 487,000
1970 497,000
1980 425,000
1990 394,017
2000 416,474
t
(min)
T
(ⴗF)
0 200
5 172
10 150
15 133
20 119
25 108
30 100
t
(min)
T
(ⴗF)
35 94
40 89
50 81
60 77
90 72
120 70
150 70
Age
(yr)
Height
(in.)
0 19.25
1 28.00
2 32.50
3 36.25
4 39.63
6 44.50
8 49.25
10 54.38
Age
(yr)
Height
(in.)
12 58.75
14 64.00
15 66.50
16 69.13
17 69.50
18 69.75
19 69.88
20 69.88
Population of Atlanta, Georgia
Year 1985 1986 1987 1990 1995 1997 2000 2001 2005 2006 2007
Number of books 420 460 1300
(c) Use the scatter plot to find the decade in which Atlanta’s population experienced
the greatest average rate of increase.
23. Growth Rate Jason’s height is a function of his age x (in years). At various
stages in his life he grows at different rates, as shown in the table in the margin, which
gives his height every year on his birthday.
(a) Find , and .
(b) Find the average rate of change in Jason’s height from birth to 4 years and from 4 years
to 8 years. Over which period did Jason have the faster average rate of growth?
(c) Draw a graph of H, and use the graph to find the year in which Jason had the
greatest average rate of growth between his 14th and 20th birthdays.
24. Rare Book Collection Between 1985 and 2007 a rare book collector purchased
books for his collection at the rate of 40 books per year. Use this information to
complete the table below showing the number of books in his collection between 1985
and 2007. (Note that not every year is given in the table.)
H 18 2H 10 2, H 14 2
H 1x 2
0
10
A
B
100
500
d (m)
t (s)
152 CHAPTER 2
■
Linear Functions and Models
25. Currency Exchange Rates The euro was introduced in 1990 as a common currency
for twelve member countries of the European Union. The table in the margin shows the
value of the euro in U.S. dollars on the first business day of each year from 1999 to
2008.
(a) Draw a scatter plot of the data.
(b) Find the average rate of change of the value of the euro in U.S. dollars between the
following years: (i) 1999 and 2008 (ii) 2002 and 2006 (iii) 2005 and 2008
(c) Use the scatter plot to find the year in which the value of the Euro experienced the
largest average rate of increase in terms of the U.S. dollar.
26. Rate of Increase of an Investment Julia invested $500 in a mutual fund on June 30,
2000, using a generous high school graduation gift from her aunt. Every June 30th she
records the amount in the fund. In early 2001 the stock market crashed, and by June 30
that year Julia’s investment had lost half its value. Over the course of the next year the
fund again lost half its value, but in 2003 its value tripled. The value of the mutual fund
continued to increase, and by June 30, 2006, Julia’s investment was worth $600. By
June 2007 the mutual fund had a 30% increase, that is, it increased by 30% of its value
on June 30, 2006. The value of Julia’s mutual fund is a function where t is the year.
(a) Find A(2000), A(2001), A(2002), A(2003), A(2006), and A(2007).
(b) Find the annual average rate of change of the function A between 2000 and 2007.
(c) Draw a scatter plot of A using your data from part (a).
(d) Which is greater: the annual rate of change of A between 2002 and 2003 or
between 2003 and 2006?
27. Speed Skating At the 2006 Winter Olympics in Turin, Italy, the United States won
three gold medals in men’s speed skating. The graph in the margin shows distance as a
function of time for two speed skaters racing in a 500-meter event.
(a) Who won the race?
(b) Find the average speed during the first 10 seconds for each skater.
(c) Find the average speed during the last 15 seconds for each skater.
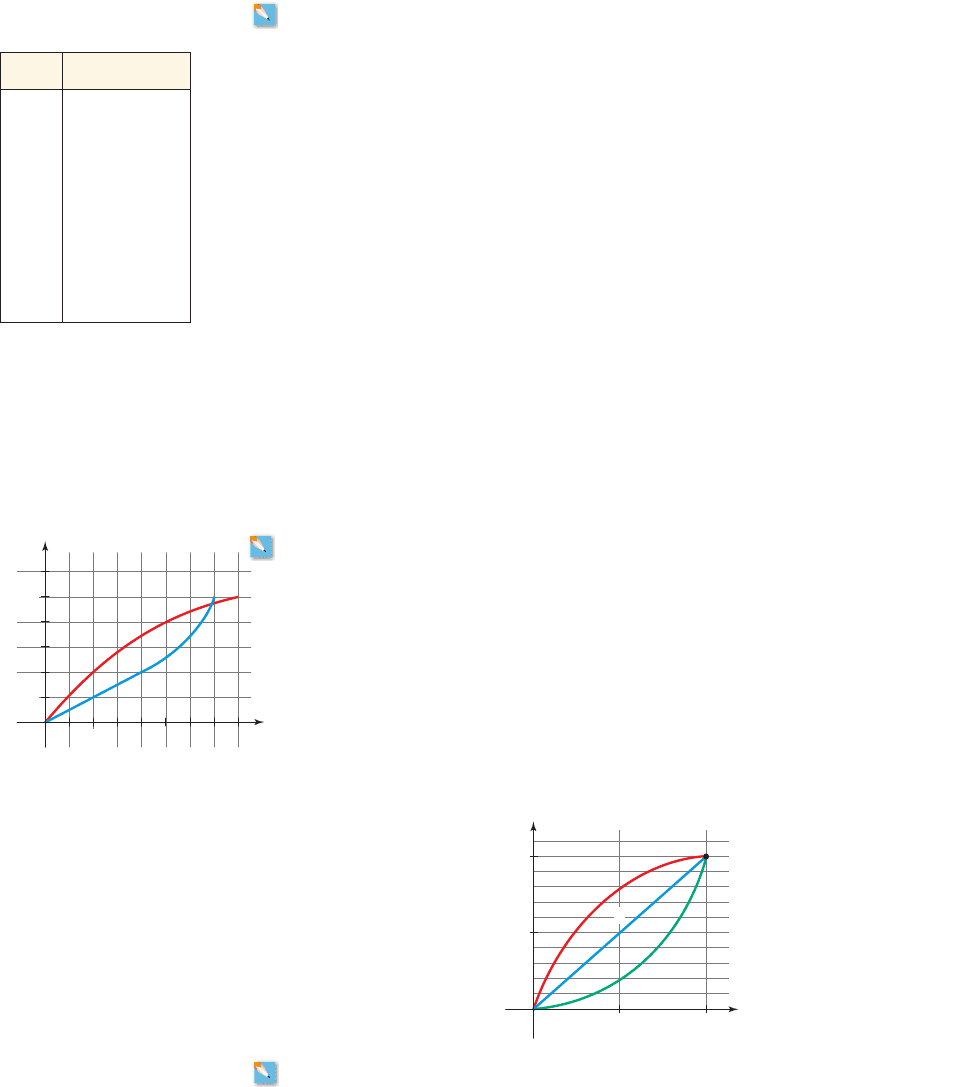
28. 100-Meter Race A 100-meter race ends in a three-way tie for first place. The graph
shows distance as a function of time for each of the three winners.
(a) Find the average speed for each winner.
(b) Describe the differences in the way the three runners ran the race.
A 1t 2
t (s)
d (m)
0
5
A
C
10
50
100
B
29. Phoenix Mars Lander On August 4, 2007, NASA’s Phoenix Mars Lander was
launched into space to search for life in the icy northern region of the planet Mars; it
touched down on Mars on May 25, 2008. As the ship raced into space, its jet fuel tanks
dropped off when they were used up. The distance one of the tanks falls in t seconds is
modeled by the function
s 1t2= 16t
2
Year Value (U.S. $)
1999 0.86
2000 1.01
2001 0.94
2002 0.89
2003 1.05
2004 1.26
2005 1.35
2006 1.18
2007 1.32
2008 1.46
Value of the Euro in
U.S. dollars
SECTION 2.2
■
Linear Functions: Constant Rate of Change 153
where s is measured in feet per second and is the instant the tank left the ship. Use
the function s to find the average speed of a tank during the following time intervals.
(a) The first 10 seconds after separation from the ship
(b) The first 30 seconds after separation from the ship
30. A Falling Skydiver When a skydiver jumps out of an airplane from a height of 13,000
feet, her height h (in feet) above the ground after t seconds is given by the function
(a) Use the function h to find the average speed of the skydiver during the first 5 seconds.
(b) The skydiver opens her parachute after 24 seconds. What is her average speed
during her 24 seconds of free fall?
31. Falling Cannonballs Galileo Galilei is said to have dropped cannonballs of different
sizes from the Tower of Pisa to demonstrate that their speed is independent of their
mass. The function
models the height h (in feet) of the cannonball above the ground t seconds after it is
dropped. Use the function h to find the average speed of the cannonball during the
following time intervals.
(a) The first 2 seconds (b) The first 3 seconds (c) Between t ⫽ 2 and t ⫽ 3.25
32. Path of Bullet A bullet is shot straight upward with an initial speed of 800 ft/s. The
height of the bullet after t seconds is modeled by the function
where h is measured in feet. Use the function h to find the average speed of the bullet
during the given time intervals.
(a) The first 5 seconds (b) The first 40 seconds (c) Between t ⫽ 10 and t ⫽ 40
h 1t2=-16t
2
+ 800t
h 1t2= 183.27 - 16t
2
h 1t2= 13,000 - 16t
2
t = 0
2
2.2 Linear Functions: Constant Rate of Change
■
Linear Functions
■
Linear Functions and Rate of Change
■
Linear Functions and Slope
■
Using Slope and Rate of Change
IN THIS SECTION… we consider functions for which the average rate of change is
constant. Such functions have the form , and their graphs are straight lines. We’ll
see that the number m can be interpreted as the rate of change of f or the slope of the graph of f.
In Section 2.1 we studied the average rate of change of a function on an interval.
Most of the functions we considered had different average rates of change on differ-
ent intervals. But what if a function has constant average rate of change? That is,
what if the function has the same average rate of change on every interval?
The graph in Figure 1(b) on page 154 shows the number of chocolates pro-
duced by a chocolate-manufacturing machine in t minutes (the start of a work shift
is represented by t ⫽ 0). We can see that chocolates are produced by the machine at
a fixed rate of 100 per minute. The graph in Figure 1(a) on page 154 shows the num-
ber of chocolates produced by a malfunctioning machine (which sometimes de-
stroys chocolates it has produced). That machine’s production rate varies wildly
g1t 2
f 1t 2
f 1x 2= b + mx
Ralph Hagen/www.CartoonStock.com