Stewart J. College Algebra: Concepts and Contexts
Подождите немного. Документ загружается.

154 CHAPTER 2
■
Linear Functions and Models
2
■ Linear Functions
In Section 1.3 we encountered functions that have constant rate of change, and we’ve
worked with such functions both numerically and graphically. In fact, the graphs of
functions with constant rate of change are lines. Algebraically, functions with con-
stant rate of change are linear in the following sense.
example
1
Identifying Linear Functions
Determine whether the following functions are linear.
(a) (b)
(c) (d)
Solution
(a) f is a linear function, where b is 2 and m is 3.
(b) is a linear function, where b is 1 and m is .
(c) h is not linear because the variable x is squared.
(d) k is a linear function where b is and m is .
■ NOW TRY EXERCISES 9 AND 11 ■
-
5
4
1
4
- 2g
k 1x2=
1 - 5x
4
h 1x2= 3x
2
+ 1
g1x 2=-2x + 1f 1x2= 2 + 3x
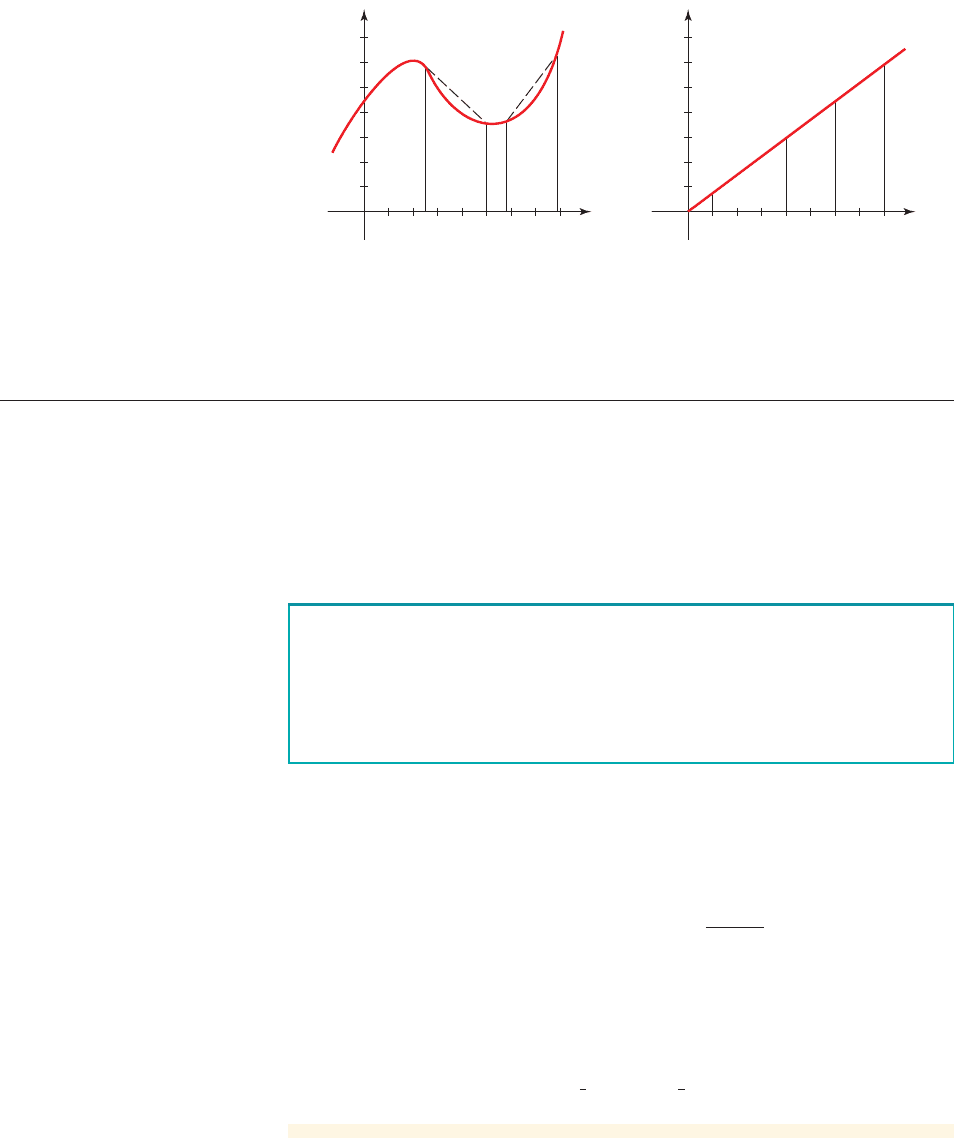
100
1
(a) g has different average rates of
change on different intervals.
0
t
g
y
100
1
(b) f has the same average rate of
change on every interval.
0
t
f
y
figure 1
■
A linear function is a function of the form
where b and m are real numbers.
■
The graph of a linear function is a line.
f 1x2= b + mx
Linear Functions
as it attempts to produce chocolates. Notice that the graph of a function that has con-
stant rate of change on every interval is a line.
SECTION 2.2
■
Linear Functions: Constant Rate of Change 155
example
2
Graphing a Linear Function
Let f be the linear function ,
(a) Make a table of values of f.
(b) Sketch a graph of f.
Solution
(a) A table of values is shown below.
f 1x 2= 2 + 3x
x
- 2 - 1
0123 4 5
f(x)
- 4 - 1
2 5 8 11 14 17
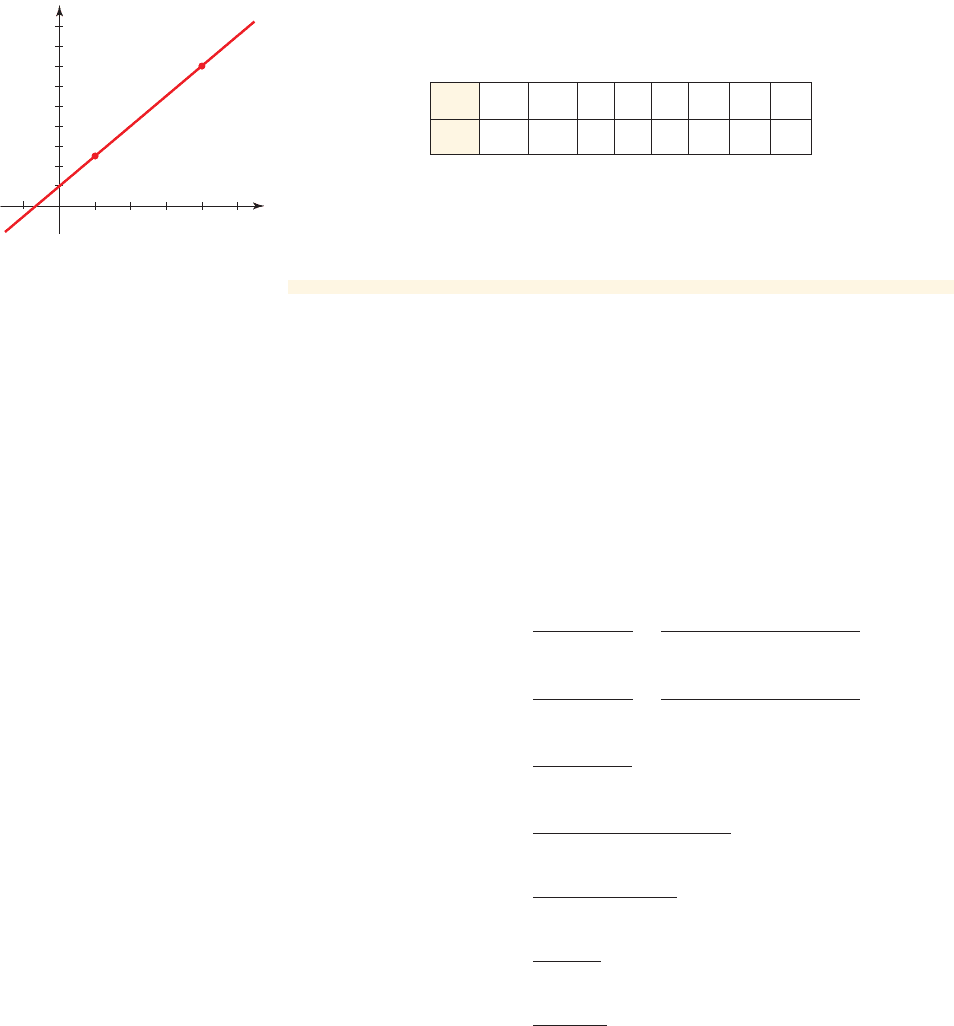
4
1
(1, 5)
(4, 14)
0
x
y
figure 2 Graph of the linear
function f 1x 2= 2 + 3x
(b) Since f is a linear function its graph is a line. So to obtain the graph of f, we
plot any two points from the table and connect them with a straight line. The
graph is shown in Figure 2.
■ NOW TRY EXERCISE 17 ■
example
3
Average Rate of Change of a Linear Function
Let f be the linear function . Find the average rate of change on the
following intervals.
(a) Between x ⫽ 0 and x ⫽ 1
(b) Between x ⫽ 1 and x ⫽ 4
(c) Between x ⫽ c and x ⫽ d
What conclusion can you draw from your answers?
Solution
(a)
(b)
(c) Definition
Use
Expand
Simplify numerator
Factor 3
Cancel common factor
= 3
=
31d - c2
d - c
=
3d - 3c
d - c
=
2 + 3d - 2 - 3c
d - c
f 1x 2= 2 + 3x =
12 + 3
#
d2- 12 + 3
#
c2
d - c
average rate of change =
f 1d 2- f 1c2
d - c
average rate of change =
f 16 2- f 112
6 - 1
=
12 + 3
#
62- 12 + 3
#
12
5
= 3
average rate of change =
f 11 2- f 102
1 - 0
=
12 + 3
#
12- 12 + 3
#
02
1
= 3
f 1x2= 2 + 3x
156 CHAPTER 2
■
Linear Functions and Models
2
■ Linear Functions and Rate of Change
In Example 3 we saw that the average rate of change of a linear function is the same
between any two points. In fact, for any linear function the average
rate of change between any two points is the constant m. For this reason, when deal-
ing with linear functions, we refer to the average rate of change as simply the rate of
change. We also call the number b the initial value of f. Of course, ; in
many applications we can think of b as the “starting value” of the function (see
Section 1.3).
b = f 102
f 1x 2= b + mx
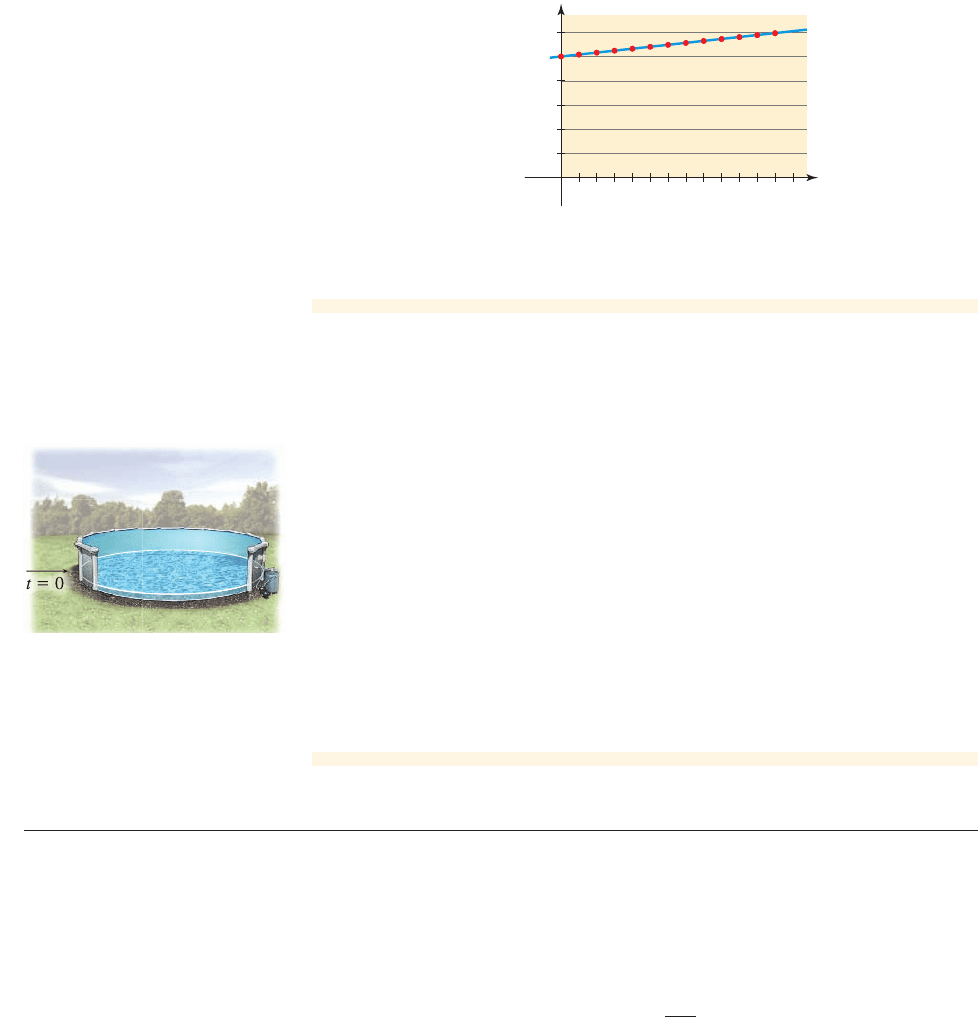
example
4
Linear Model of Growth
Toddlers generally grow at a constant rate. Little Jason’s height between his first and
second birthdays is modeled by the function
where is measured in inches and x is the number of months since his first
birthday.
(a) Is h a linear function?
(b) Make a table of values for h.
(c) What is Jason’s initial height?
(d) At what rate is Jason growing?
(e) Sketch a graph of h.
Solution
(a) Yes, h is a linear function for which b is 25.0 and m is 0.4.
(b) A table of values is shown in the margin.
(c) The initial value is the constant b, which is 25.0. This means that his height on
his first birthday was 25.0 in.
(d) Since h is a linear function its rate of change is the constant m, which in this
case is 0.4. This means that Jason grows 0.4 inch per month. Notice how the
table of values agrees with this observation.
h 1x2
h 1x2= 25.0 + 0.4x
Initial Rate of
value change
f 1x 2= b
T
+ m
T
x
Let f be the linear function .
■
The rate of change of f is the constant m.
■
The initial value of f is the constant b.
f 1x 2= b + mx
Month
x
Height
h(x) (in.)
0 25.0
1 25.4
2 25.8
3 26.2
4 26.6
5 27.0
6 27.4
7 27.8
8 28.2
9 28.6
10 29.0
11 29.4
12 29.8
Linear Functions and Rate of Change
It appears that the average rate of change is always 3 for this function. In fact, part
(c) proves that the average rate of change for this function between any two points
x ⫽ c and x ⫽ d is 3.
■ NOW TRY EXERCISE 21 ■
SECTION 2.2
■
Linear Functions: Constant Rate of Change 157
x
y
0
Height
(in.)
20
30
10
246
81012
Month
figure 3 Graph of h 1x 2= 25.0 + 0.4x
■ NOW TRY EXERCISE 53 ■
example
5
Finding a Linear Model from a Rate of Change
Water is being pumped into a swimming pool at the rate of 5 gal/min. Initially, the
pool has 200 gallons of water. Find a linear function that models the volume of wa-
ter in the pool at any time.
Solution
We need to find a linear function
that models the volume of water in the pool at time t. The rate of change of
volume is 5 gal/min, so . Since the pool has 200 gallons to begin with, we
have . So the initial value is . Now that we know m and b, we
can write
■ NOW TRY EXERCISE 55 ■
V1t 2= 200 + 5t
b = 200V10 2= 200
m = 5
V1t 2
V1t 2= b + mt
2
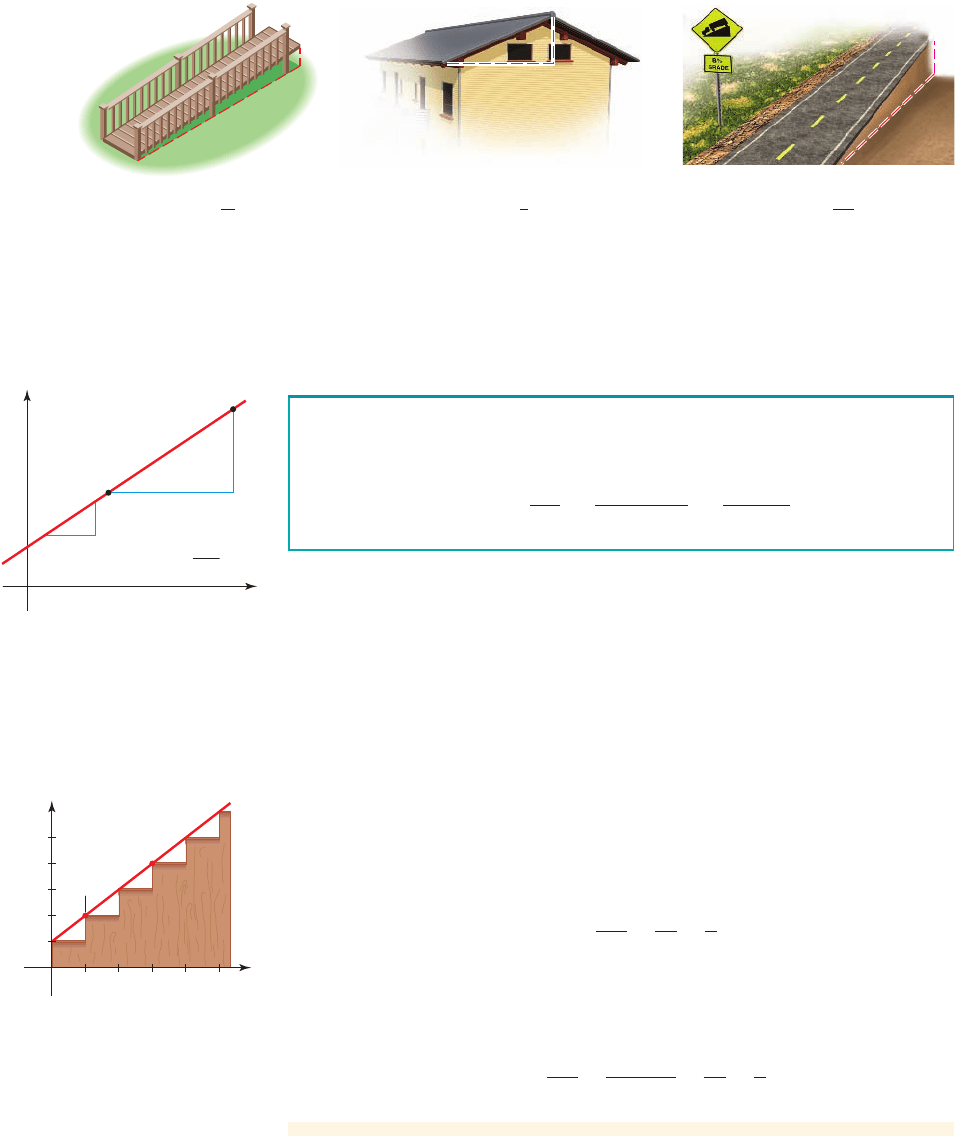
■ Linear Functions and Slope
An important property of a line is its “steepness,” or how quickly it rises or falls as
we move along it from left to right. If we move between two points on a line, the run
is the distance we move from left to right, and the rise is the corresponding distance
that we move up (or down). The slope of a line is the ratio of rise to run:
Figure 4 on page 158 shows some situations in which slope is important in real life
and how it is measured in each case. Builders use the term pitch for the slope of a
roof. The uphill or downhill slope of a road is called its grade.
slope =
rise
run
There are 200 gallons of water in
the pool at time . t = 0
(e) Since h is a linear function, its graph is a straight line. So to graph h, we can
plot any two points in the table and connect them with a straight line. See
Figure 3.
158 CHAPTER 2
■
Linear Functions and Models
The graph of a linear function is a line. In this case the run is
the change in the x-coordinate, and the rise is the corresponding change in the
y-coordinate. The slope of a line is the ratio of rise to run.
Slope of a Line
f 1x2= mx + b
Slope of a ramp Pitch of a roof Grade of a road
Slope=
1
12
Slope=
1
3
Slope=
8
100
100
8
1
3
1
12
figure 4
If and are different points on a line graphed in a coordinate
plane, then the slope of the line is defined by
slope ⫽
rise
run
⫽
change in y
change in x
⫽
y
2
⫺ y
1
x
2
⫺ x
1
1x
2
, y
2
21x
1
, y
1
2
From the similar triangles property in geometry it follows that the ratio of rise
to run is the same no matter which points we pick, so the slope is independent of the
points we choose to measure it (see Figure 5).
ris
e
rise
run
rise
run
run
slope=
(x⁄, y⁄)
(x¤, y¤)
0
x
y
figure 5 The slope of a line
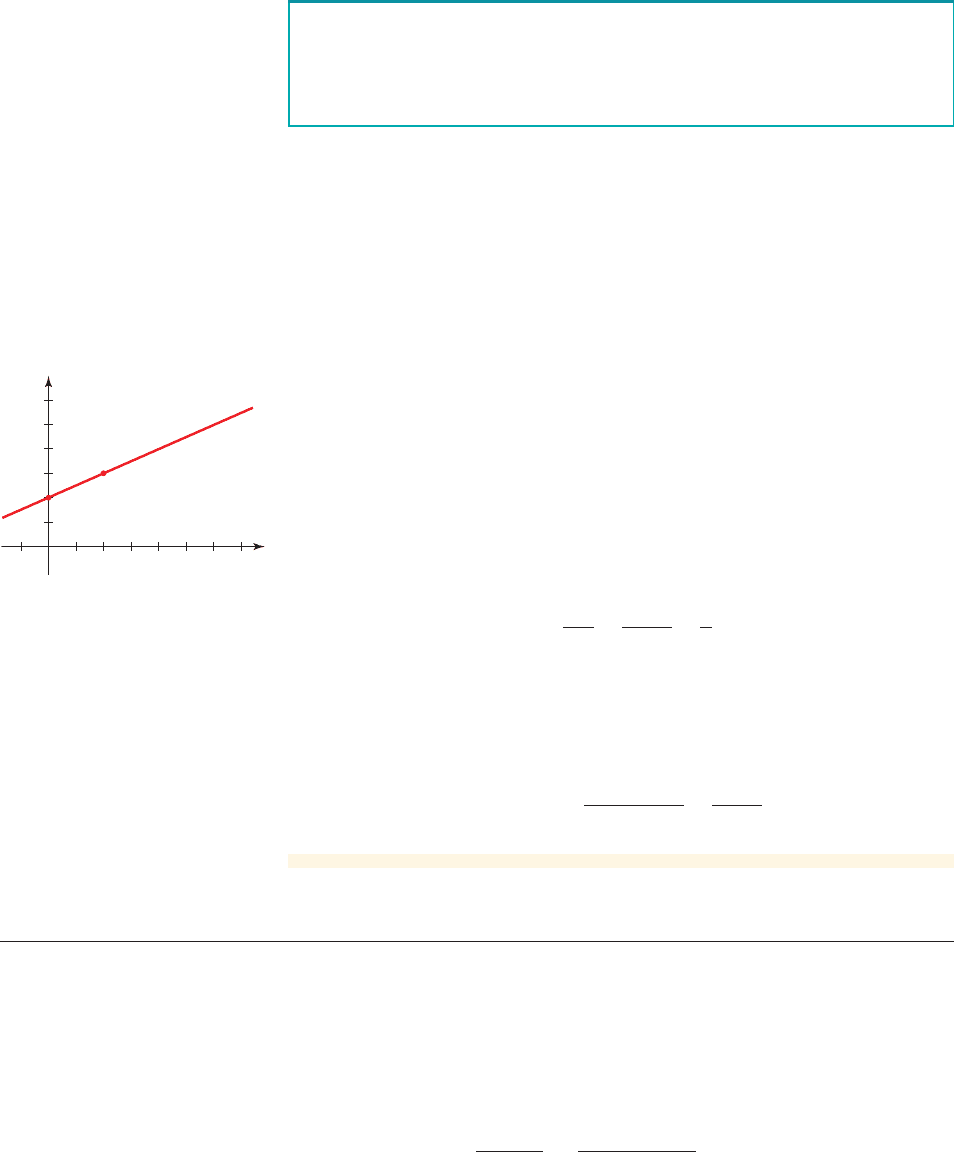
example
6
Finding the Slope of a Staircase
In Figure 6 we’ve placed a staircase in a coordinate plane, with the origin at the bot-
tom left corner. The red line in the figure is the edge of the trim board of the stair-
case. Find the slope of this line.
Solution 1
We observe that each of the steps is 8 inches high (the rise) and 12 inches deep (the
run), so the slope of the line is
Solution 2
From Figure 6 we see that two points on the line are (12, 16) and (36, 32). So from
the definition of slope we have
■ NOW TRY EXERCISE 57 ■
For any linear function , the slope of the graph of f is the con-
stant m and the y-intercept is . So we have the following description of the
graph of a linear function.
f 10 2= b
f 1x 2= b + mx
slope =
rise
run
=
32 - 16
36 - 12
=
16
24
=
2
3
slope =
rise
run
=
8
12
=
2
3
(12, 16)
12 24 36 48 60
8
16
24
32
40
(36, 32)
0
x (in.)
y
(in.)
figure 6 Slope of a staircase
SECTION 2.2
■
Linear Functions: Constant Rate of Change 159
example
7
Finding the Slope of a Line
Let f be the linear function .
(a) Sketch the graph of f.
(b) Find the slope of the graph of f.
(c) Find the rate of change of f.
Solution
(a) The graph of f is a line. To sketch the graph, we need only find two points on
the line. Since and , two points on the graph are
Sketching these points and connecting them by a straight line, we get the
graph in Figure 7.
(b) Since , we see that , so the graph of f is a line with slope
1. We can also find the slope using the definition of slope and the two points
we found in part (a):
So the graph of f is a line with slope 1.
(c) Since f is a linear function in which m is 1, it follows that the rate of change of
f is 1. We can also calculate the rate of change directly. Using the two values
of the function we found in part (a), we have
■ NOW TRY EXERCISE 25 ■
rate of change =
f 11 2- f 102
1 - 0
=
3 - 2
1
= 1
slope =
rise
run
=
3 - 2
1 - 0
=
1
1
= 1
m = 1f 1x2= 2 + 1ⴢ x
10, 22and11, 3 2
f 11 2= 3f 10 2= 2
f 1x 2= 2 + x
123
1
4
6
0
x
y
figure 7 Graph of f 1x 2= 2 + x
y-intercept Slope
f 1x 2= b
T
+ mx
T
2
■ Using Slope and Rate of Change
For the linear function f in Example 7 we found that the rate of change of f is the
same as the slope of the graph of f. This is true for any linear function. In fact if
and are two different values for x, let’s put and . Then the
points and are on the graph of f. From the definitions of slope and rate
of change we have
We summarize this very useful observation.
slope ⫽
y
2
⫺ y
1
x
2
⫺ x
1
⫽
f 1x
2
2⫺ f 1x
1
2
x
2
⫺ x
1
⫽ rate of change
1x
2
, y
2
21x
1
, y
1
2
y
2
= f 1x
2
2y
1
= f 1x
1
2x
2
x
1
Let f be the linear function .
■
The graph of f is a line with slope m.
■
The y-intercept of the graph of f is the constant b.
f 1x 2= b + mx
Linear Functions and Slope
160 CHAPTER 2
■
Linear Functions and Models
The difference between “slope” and “rate of change” is simply a difference in
point of view.
■
For the staircase in Example 6 we prefer to think that the trim board has a
slope of 2>3, although we can also think of the rate of change in the height
of the trim board as 2>3 (the trim board rises 2 inches for each 3-inch
change in the run).
■
For the swimming pool in Example 5 it is more natural to think that the rate
of change of volume is 5 gal/min, although we can also view 5 as being the
slope of the graph of the volume function (the graph rises 5 gallons for
every 1-minute change in time).
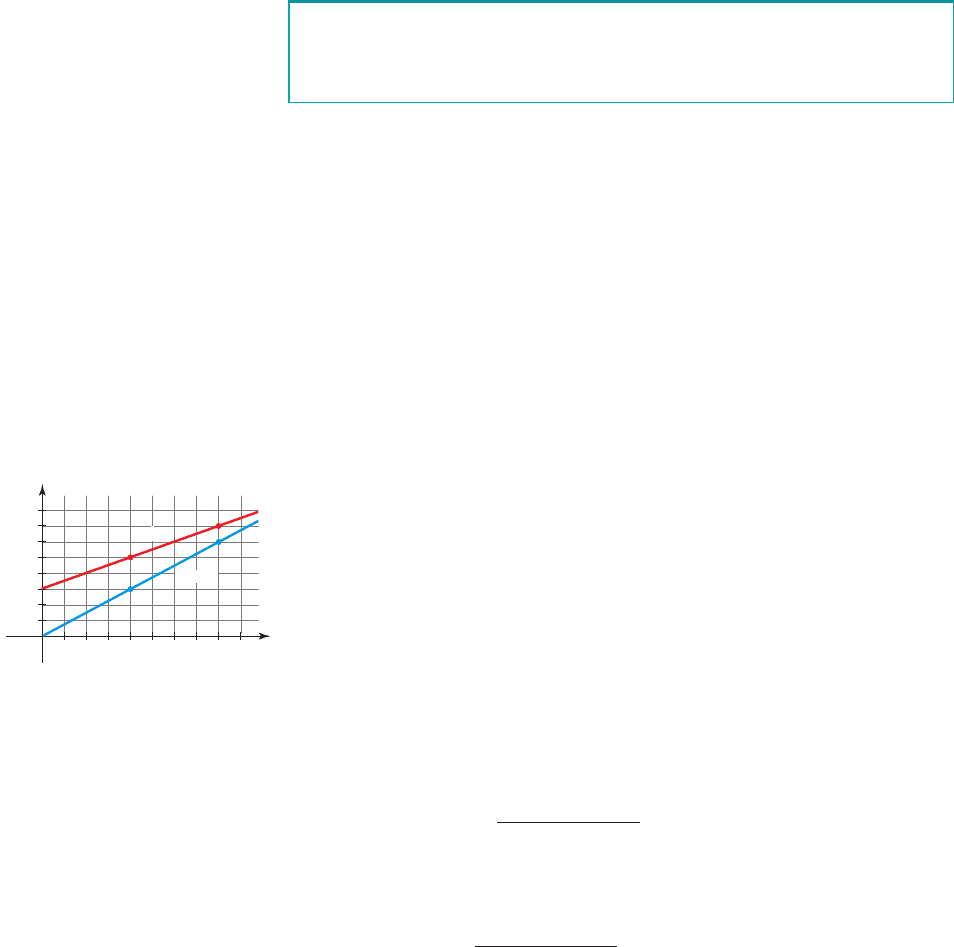
example
8
Finding Linear Functions from a Graph
John and Mary are driving westward along I-76 at constant speeds. The graphs in
Figure 8 show the distance y (in miles) that they have traveled from Philadelphia at
time x (in hours), where x ⫽ 0 corresponds to noon.
(a) At what speeds are John and Mary traveling? Who is traveling faster, and how
does this show up in the graph?
(b) Express the distances that John and Mary have traveled as functions of x.
(c) How far will John and Mary have traveled at 5:00 P.M.?
Solution
(a) From the graph we see that John has traveled 250 miles at 2:00 P.M. and 350
miles at 4:00 P.M. The speed is the rate of change, which is the slope of the
graph, so John’s speed is
/h John’s speed
Mary has traveled 150 miles at 2:00 P.M. and 300 miles at 4:00 P.M., so we
calculate Mary’s speed to be
/h Mary’s speed
(b) Let be the distance John has traveled at time x. We know that f is a linear
function, since the speed (average rate of change) is constant, so we can write
f in the form
In part (a) we showed that m is 50, and from the graph we see that the
y-intercept of John’s graph is . So the distance John has traveled at
time x is
John’s distance
f 1x2= 150 + 50x
b = 150
f 1x2= b + mx
f 1x 2
slope =
300 mi - 150 mi
4 h - 2 h
= 75 mi
slope =
350 mi - 250 mi
4 h - 2 h
= 50 mi
For the linear function we have
slope = rate of change = m
f 1x 2= b + mx
Slope and Rate of Change
x
y
0
100
200
300
400
123
4
Mary
John
figure 8 John and Mary’s trip
SECTION 2.2
■
Linear Functions: Constant Rate of Change 161
Similarly, Mary is traveling at mi/h, and the y-intercept of her graph is
, so the distance she has traveled at time x is
Mary’s distance
(c) Replacing x by 5 in the equations we obtained in part (b), we find that at 5:00 P.M.
John has traveled
and Mary has traveled
■ NOW TRY EXERCISE 59 ■
g15 2= 7515 2= 375 miles
f 15 2= 150 + 50152= 400 miles
g1x 2= 75x
b = 0
m = 75
2.2 Exercises
CONCEPTS
Fundamentals
1. Let f be a function with constant rate of change. Then
(a) f is a
_______ function.
(b) f is of the form .
(c) The graph of f is a
______________.
2. Let f be the linear function .
(a) The rate of change of f is
_______, and the initial value is _______.
(b) The graph of f is a
_______, with slope _______ and y-intercept _______.
3. We find the “steepness,” or slope, of a line passing through two points by dividing the
difference in the
____-coordinates of these points by the difference in the ____-
coordinates. So the line passing through the points (0, 1) and (2, 5) has slope
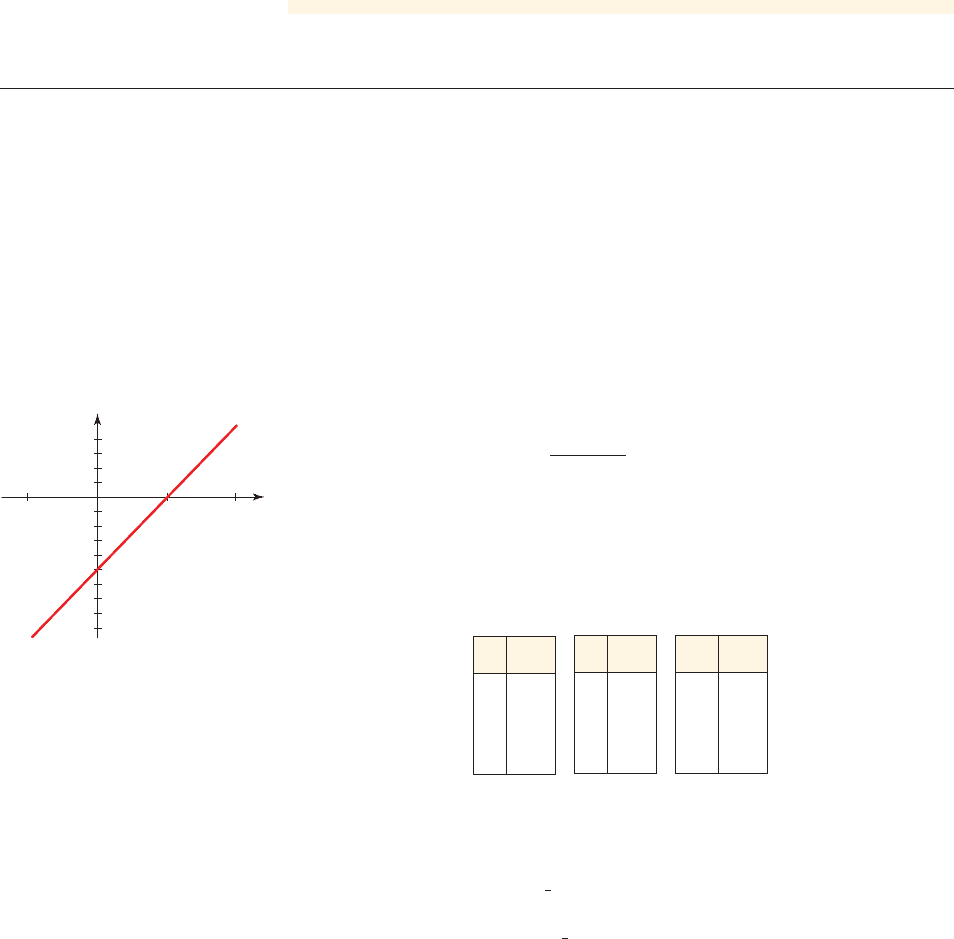
4. The graph of a linear function f is given in the margin. The y-intercept of f is
_______,
the slope of the graph of f is
_______, and the rate of change of f is _______.
ⵧ
-
ⵧ
ⵧ
-
ⵧ
= ________
f 1x 2= 7 - 2x
f 1x 2=
ⵧ
+
ⵧ
x
Think About It
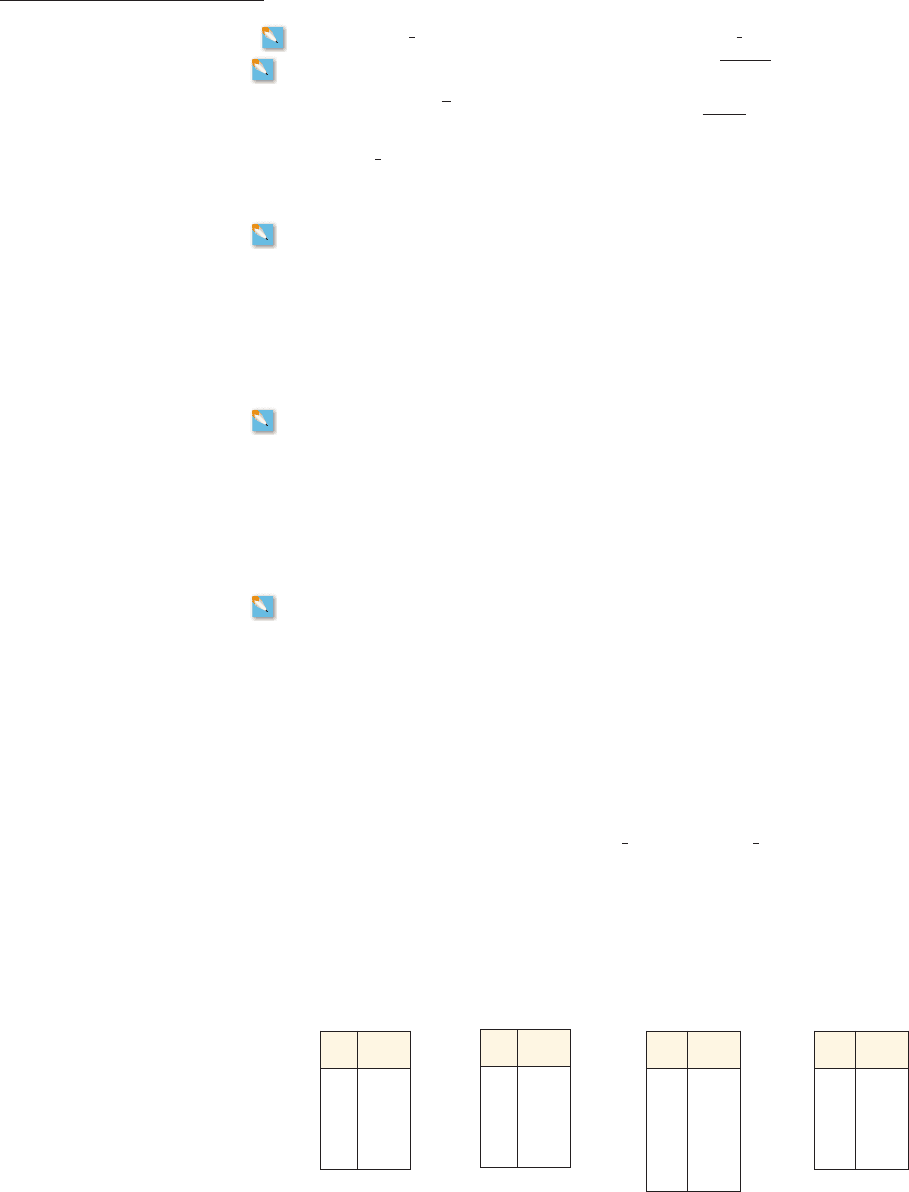
5. Which of the following functions is not linear? Give reasons for your answer.
0
x
y
f
2
_2
_4
_8
4
21
_1
x f(x)
0 5
2 7
4 9
6 11
x
g(x)
0 5
1 6
3 7
4 9
x h(x)
2 7
5 16
8 25
12 37
6. If a linear function has positive slope, does its graph slope upward or downward? What
if the linear function has negative slope?
7. Is a linear function? If so, find the slope and the y-intercept of the graph of f.
8. (a) Graph for , m ⫽ 1, and m ⫽ 2, all on the same set of axes. How
does increasing the value of m affect the graph of f ?
(b) Graph for , b ⫽ 1, and b ⫽ 2, all on the same set of axes. How
does increasing the value of b affect the graph of f ?
b =
1
2
f 1x 2= x + b
m =
1
2
f 1x 2= mx
f 1x 2= 2
x f(x)
0 8
1 5
2 2
3
- 1
162 CHAPTER 2
■
Linear Functions and Models
SKILLS
9–16 ■ Determine whether the given function is linear.
9. 10.
11. 12.
13. 14.
15. 16.
17–20
■ For the given linear function, make a table of values and sketch its graph.
17. 18.
19. 20.
21–24 ■ For the given linear function, find the average rate of change on the following intervals.
(a) Between and x ⫽ 1
(b) Between x ⫽ 1 and x ⫽ 2
(c) Between x ⫽ a and
21. 22.
23. 24.
25–34
■ For the given linear function,
(a) Sketch the graph.
(b) Find the slope of the graph.
(c) Find the rate of change of the function.
25. 26.
27. 28.
29. 30.
31. 32.
33. 34.
35–38
■ A verbal description of a linear function is given. Find the function.
35. The linear function f has rate of change 7 and initial value
36. The linear function has rate of change and initial value .
37. The graph of the linear function h has slope and y-intercept 9.
38. The graph of the linear function k has slope 2.5 and y-intercept 10.7.
39–42
■ A table of values for a linear function f is given.
(a) Find the rate of change and the initial value of f.
(b) Express f in the form .
39. 40. 41. 42.
x f(x)
-3
5
0 6
6 8
15 11
x f(x)
-2
16
0 12
1 10
3 6
7
-2
x f(x)
0 3
2 4
4 5
6 6
f 1x 2= b + mx
- 3
2
3
-
1
3
g
- 3.
F 1x 2=-0.3x - 6F 1x 2=-0.5x - 2
h 1t 2=-3t - 9h 1t 2= 2t - 6
f 1t 2= 4 + 2tf 1t 2= 6 + 3t
g1x 2=-2x + 10g1x 2=-3 - x
f 1x 2= 3 - 4xf 1x2= 4 + 2x
s 1x 2=-3x - 9
h 1x 2=-2x - 5
g1x 2= 5 + 15xf 1x 2= 4 + 2x
x = a + h
x =-1
s 1t 2=-2t - 6h 1t2= 6 - 3t
g1x 2= 4 + 2xf 1x 2= 6x + 5
f 1x 2= 12t + 72
3
f 1x 2=
2
3
1t - 22
f 1x 2=
x - 3
6
f 1x 2=-x + 26
f 1x 2= 15 + 2xf 1x 2= 4 - x
2
f 1x 2= 8 -
4
3
xf 1x 2= 3 +
1
2
x
SECTION 2.2
■
Linear Functions: Constant Rate of Change 163
43–48 ■ Find the slope of the line passing through the two given points.
43. (0, 0) and (4, 2) 44. (0, 0) and (2, ⫺6)
45. (2, 2) and (⫺10, 0) 46. (1, 2) and (3, 3)
47. (2, 4) and (4, 3) 48. (2, ⫺5) and (⫺4, 3)
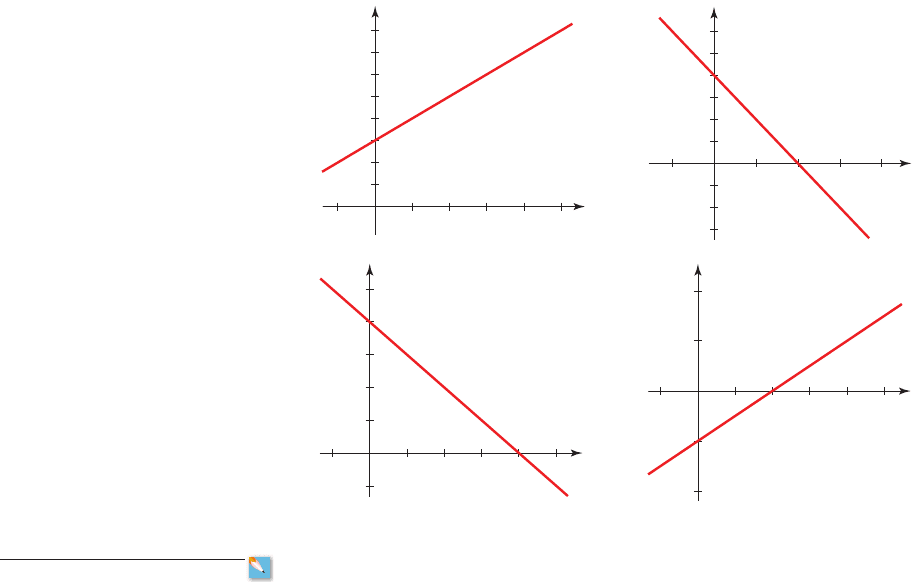
49–52
■ The graph of a linear function f is given.
(a) Find the slope and the y-intercept of the graph.
(b) Express f in the form .
49. 50.
51. 52.
f 1x 2= b + mx
53. Landfill The amount of trash in a county landfill is modeled by the function
where x is the number of days since January 1, 1996, and is measured in thousands
of tons.
(a) Is T a linear function?
(b) What is the initial amount of trash in the landfill in 1996?
(c) At what rate is the landfill receiving trash?
(d) Sketch a graph of T.
54. Cell Phone Costs Ingrid is in the process of choosing a cell phone and a cell phone
plan. Her choice of phones and plans is as follows:
Phones: $50 (basic phone), $100 (camera phone)
Plans: $30, $40, or $60 per month
The first graph on the following page represents the cost per month of cell phone
service for the $30 plan; the second graph represents the total cost of purchasing
the $50 cell phone and receiving cell phone service for x months at $40 per month.
(a) Why is the line in the first graph horizontal?
(b) What do the x and y coordinates in the graph of C (second graph) represent?
C 1x2
T1x 2
T1x 2= 32,400 + 4x
2
1
5
0
x
y
2
1
0
x
y
1
2
1_1 234
5
0
x
y
_1
_2
1
2
1_1 234
5
0
x
y
CONTEXTS