Stewart J. College Algebra: Concepts and Contexts
Подождите немного. Документ загружается.

194 CHAPTER 2
■
Linear Functions and Models
(c) In general, the slope is the average rate of change of the function. In this case
the slope is the average rate of increase in the pole vault record per year. So on
average, the pole vault record increased by 0.0266 meters per year.
(d) The year 2008 corresponds to x ⫽ 108 in our model. The model gives
So the model predicts that in 2008 the winning pole vault record will be
6.27 meters.
■ NOW TRY EXERCISE 17 ■
In the 2008 Olympic Games, Steven Hooker of Australia set an Olympic pole
vault record of 5.96 meters. This is considerably less than the prediction of the model
of Example 3. In Exercise 18 we explore how using only recent data can help to im-
prove our prediction.
y = 0.026611082+ 3.40 L 6.27
We can make a more accurate
prediction by using only recent data.
See Exercise 18.
example
4
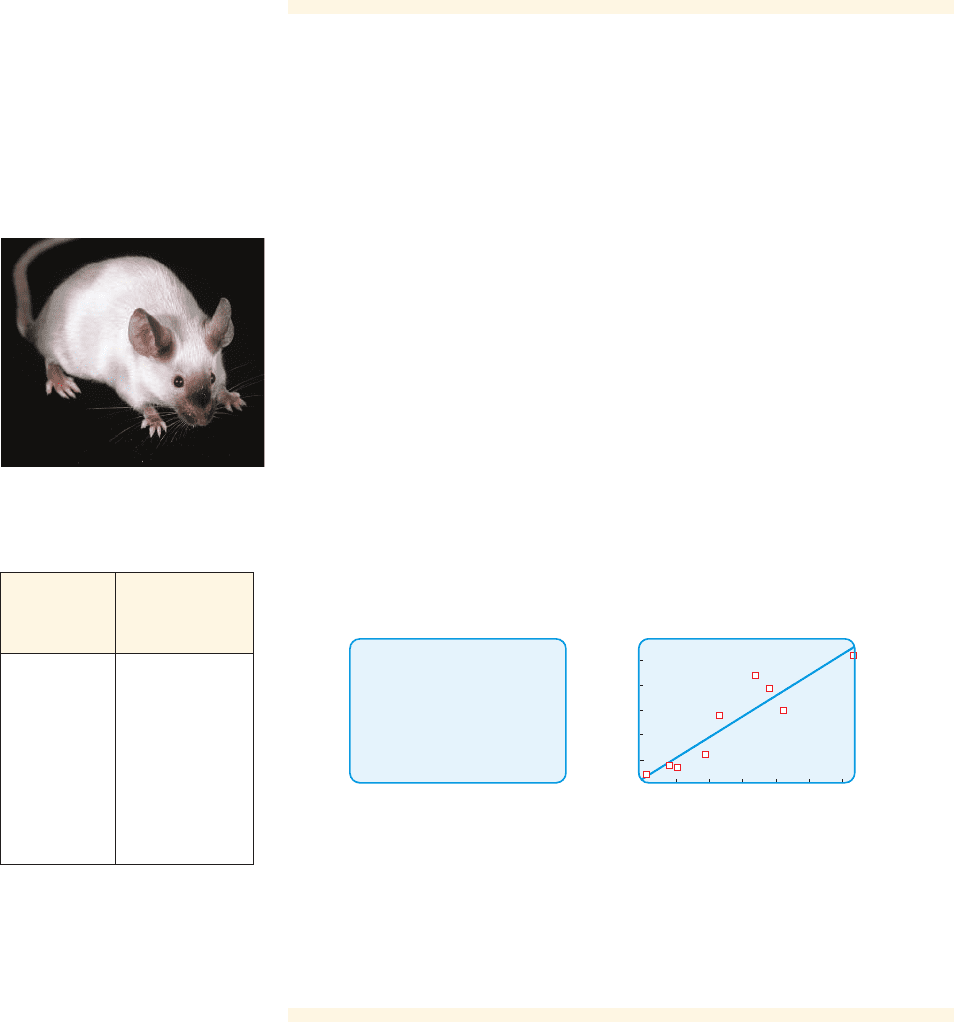
Regression Line for Links Between Asbestos and Cancer
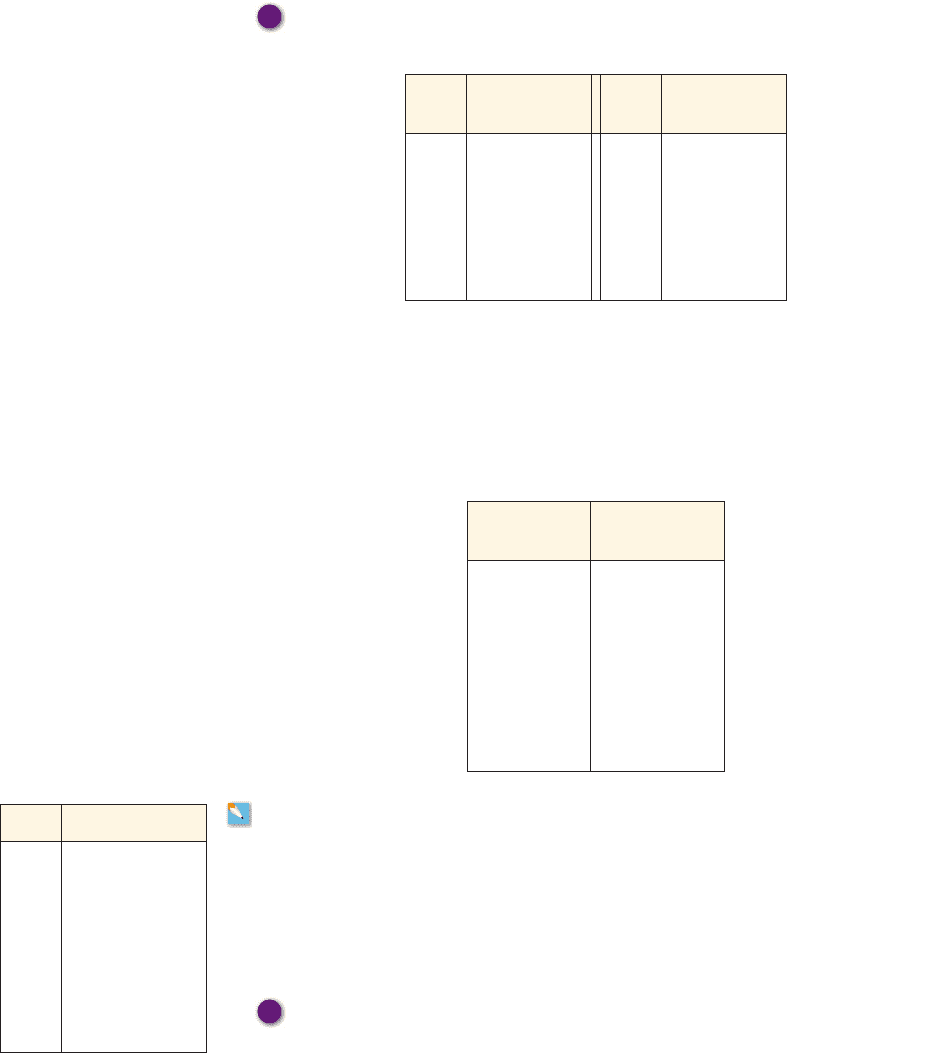
When laboratory rats are exposed to asbestos fibers, some of them develop lung tu-
mors. Table 3 lists the results of several experiments by different scientists.
(a) Find the regression line for the data. (Let x be the asbestos exposure and y the
percent of rats that develop tumors.)
(b) Make a scatter plot and graph the regression line. Does the regression line
appear to be a suitable model for the data?
(c) What does the y-intercept of the regression line represent?
Solution
(a) Using a calculator, we find the regression line (see Figure 8(a)):
(b) The scatter plot and regression line are shown in Figure 8(b). The regression
line appears to be a reasonable model for the data.
y = 0.0177x + 0.5405
Asbestos
exposure
(fibers/mL)
Percent of mice
that develop
lung tumors
50 2
400 6
500 5
900 10
1100 26
1600 42
1800 37
2000 28
3000 50
table 3
Asbestos-tumor data
55
(b) Scatter plot and regression line(a) Output of the
LinReg
command
0
3100
y=ax+b
a=.0177212141
b=.5404689256
LinReg
figure 8 Linear regression for the asbestos-tumor data
(c) The y-intercept is the percentage of mice that develop tumors when no
asbestos fibers are present. In other words, this is the percentage that normally
develop lung tumors (for reasons other than asbestos).
■ NOW TRY EXERCISE 19 ■
Eric & David Hosking/Corbis
SECTION 2.5
■
Linear Regression: Fitting Lines to Data 195
2
■ How Good Is the Fit? The Correlation Coefficient
For any given set of two-variable data it is always possible to find a regression line, even
if the data points don’t tend to lie on a line and even if the variables don’t seem to be re-
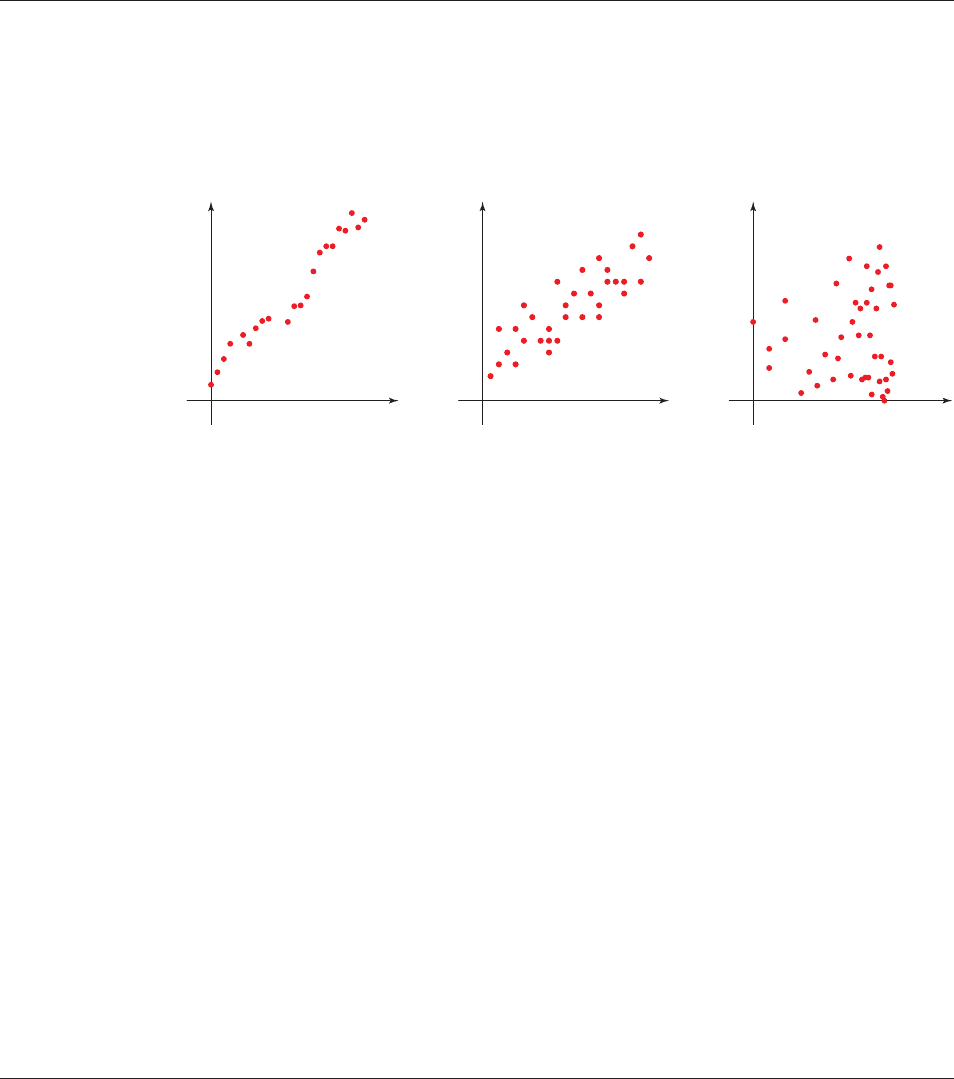
lated at all. Look at the three scatter plots in Figure 9. In the first scatter plot, the data points
lie close to a line. In the second plot, there is still a linear trend, but the points are more
scattered. In the third plot, there doesn’t seem to be any trend at all, linear or otherwise.
A graphing calculator can give us a regression line for each of these scatter plots.
But how well do these lines represent or “fit” the data? To answer this question, stat-
isticians have invented the correlation coefficient, usually denoted r. The correlation
coefficient is a number between and 1 that measures how closely the data follow
the regression line—or, in other words, how strongly the variables are correlated.
Many graphing calculators give the value of r when they compute a regression line.
If r is close to or 1, then the variables are strongly correlated—that is, the scatter
plot follows the regression line closely. If r is close to 0, then there is little correlation.
(The sign of r depends on the slope of the regression line.) The correlation coefficients
of the scatter plots in Figure 9 are indicated on the graphs. For the first plot, r is close
to 1 because the data are very close to linear. The second plot also has a relatively large
r, but not as large as the first, because the data, while fairly linear, are more diffuse.
The third plot has an r close to 0, since there is virtually no linear trend in the data.
The correlation coefficient is a guide in helping us decide how closely data points
lie along a line. In Example 1 the correlation coefficient is , indicating a very
high level of correlation, so we can safely say that the drop in infant mortality rates
from 1950 to 2000 was strongly linear. (The value of r is negative, since infant mor-
tality declined over this period.) In Example 4 the correlation coefficient is 0.92, which
also indicates a strong correlation between the variables. So exposure to asbestos is
clearly associated with the growth of lung tumors in rats. Does this mean that asbestos
causes lung cancer? See Exploration 4 for a closer look at this question.
- 0.99
- 1
- 1
yyy
xxx
r=0.98 r=0.84 r=0.09
figure 9
To ensure that your TI-83 calculator
returns the value of r when you
perform the
LinReg command,
open the
Catalog menu and start
DiagnosticOn.
2.5 Exercises
Fundamentals
1. For a set of data points, the line that best fits the scatter plot of the data is called the
______________ line.
2. (a) Using a regression line to predict trends outside the domain of our existing data is
called
______________.
CONCEPTS
196 CHAPTER 2
■
Linear Functions and Models
5–12 ■ A table of values is given.
(a) Make a scatter plot of the data.
(b) Find and graph the linear regression line that models the data.
y
10
20
30
1234
0
x
5.
6.
7.
8.
9.
10.
x 21 29 35 42 57 103
y 51 35 47 90 26 11
x 13 14 20 24 27 33
y 1.32 11.33 9.30 5.30 21.27 22.22
x 2378911
y 5.7 9.2 21.3 2.2 13.1 12.2
x 71 90 102 103 105 121
y 21.1 20.9 19.0 19.5 19.2 17.3
x 10 20 30 40 50 60
y 17.2 27.0 36.8 45.1 57.1 67.2
x 123456
y 3.1 8.2 13.5 18.2 23.4 28.7
y
10
20
30
1234
0
x
SKILLS
(b) Using a regression line to predict trends within the domain of our existing data is
called
______________.
Think About It
3. Can you find the regression line for any set of two-variable data, even if these data don’t
exhibit a linear trend?
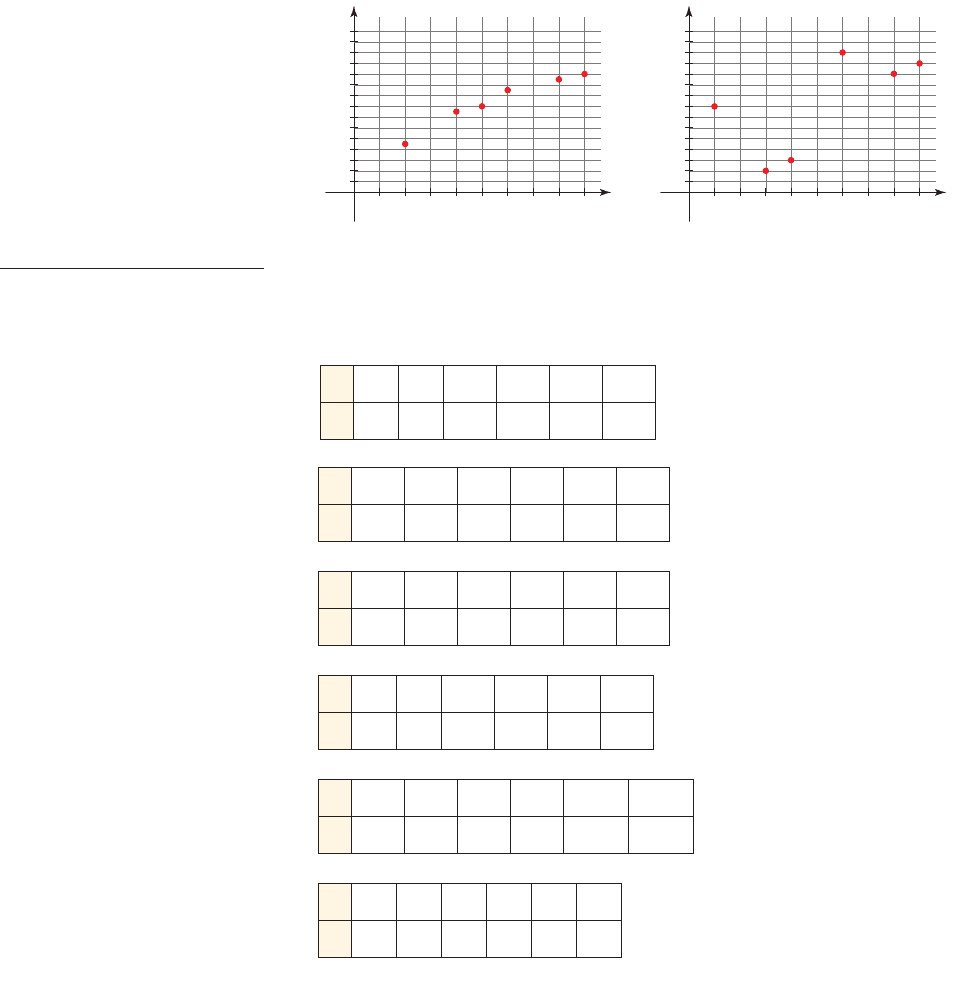
4. Try to visually draw the line of best fit to the scatter plot shown, then find the regression
line and compare to your “visual line.” Which of your lines is closer to the regression
line?
(a) (b)
SECTION 2.5
■
Linear Regression: Fitting Lines to Data 197
11.
12.
x 5 6 10 15 17 21
y 173 150 148 121 110 94
x 15 7111527
y 3.9 11.4 16.6 24.1 31.6 56.8
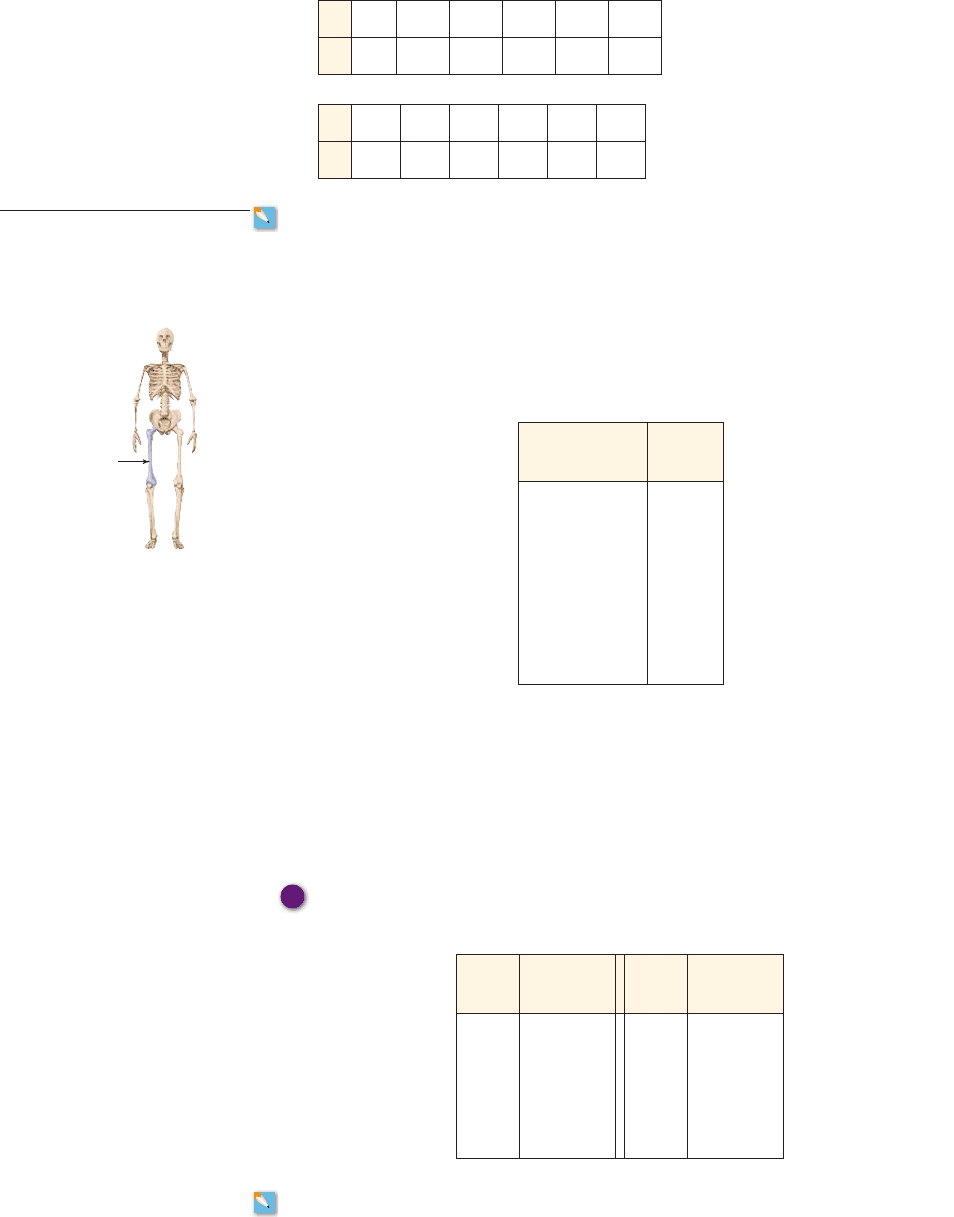
13. Height and Femur Length Anthropologists use a linear model that relates femur
(thigh bone) length to height. The model allows an anthropologist to determine the
height of an individual when only a partial skeleton (including the femur) is found. In
this problem we find the model by analyzing the data on femur length and height for the
eight males given in the table below.
(a) Make a scatter plot of the data.
(b) Find and graph the regression line that models the data.
(c) An anthropologist finds a femur of length 58 cm. How tall was the person?
Femur length
(cm)
Height
(cm)
50.1 178.5
48.3 173.6
45.2 164.8
44.7 163.7
44.5 168.3
42.7 165.0
39.5 155.4
38.0 155.8
CONTEXTS
Femur
14. Carbon Dioxide Levels The Mauna Loa Observatory, located on the island of
Hawaii, has been monitoring carbon dioxide ( ) levels in the atmosphere since 1958.
The following table lists the average annual levels measured in parts per million
(ppm) from 1984 to 2006.
(a) Make a scatter plot of the data.
(b) Find and graph the regression line that models the data.
(c) Use the linear model in part (b) to estimate the level in the atmosphere in 2005.
(d) Search the Internet to find the actual reported level in 2005, and compare this
to your answer in part (c).
CO
2
CO
2
CO
2
CO
2
Year
CO
2
level
(ppm)
1984 344.3
1986 347.0
1988 351.3
1990 354.0
1992 356.3
1994 358.9
Year
CO
2
level
(ppm)
1996 362.7
1998 366.5
2000 369.4
2002 372.0
2004 377.5
2006 380.9
R
R
15. Extent of Arctic Sea Ice The National Snow and Ice Data Center monitors the
amount of ice in the Arctic year round. The table on the next page gives approximate
198 CHAPTER 2
■
Linear Functions and Models
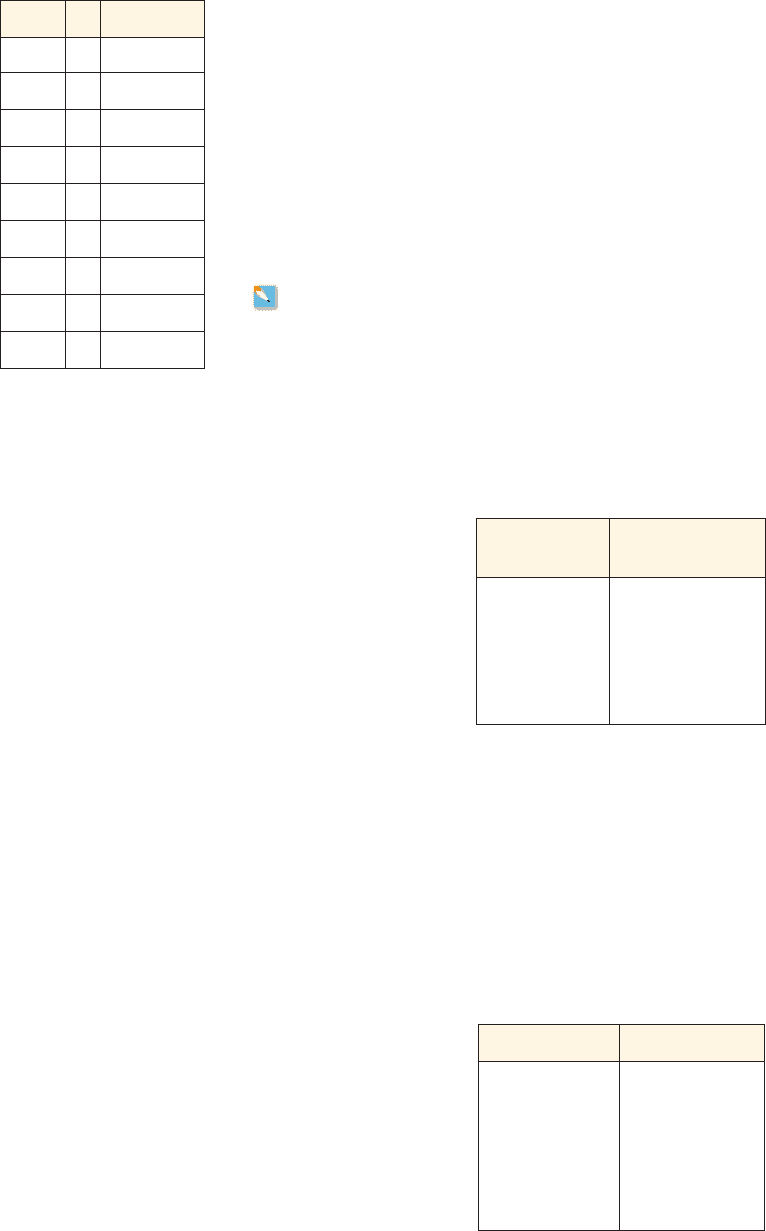
16. Temperature and Chirping Crickets Biologists have observed that the chirping rate
of crickets of a certain species appear to be related to temperature. The following table
shows the chirping rate for various temperatures.
(a) Make a scatter plot of the data.
(b) Find and graph the regression line that models the data.
(c) Use the linear model in part (b) to estimate the chirping rate at .100°F
Temperature
(ⴗF)
Chirping rate
(chirps/min)
50 20
55 46
60 79
65 91
70 113
75 140
80 173
85 198
90 211
values for the arctic ice extent in millions of square kilometers from 1980 to 2006, in
2-year intervals.
(a) Make a scatter plot of the data.
(b) Find and graph the regression line that models the data.
(c) Use the linear model in part (b) to estimate the arctic ice extent in 2001.
(d) Predict the arctic ice extent in 2008. Search the Internet to find the actual reported
arctic ice extent in 2008, and compare this to your prediction.
Year
Ice extent
(million km
2
)
1980 7.9
1982 7.4
1984 7.2
1986 7.6
1988 7.5
1990 6.2
1992 7.6
Year
Ice extent
(million km
2
)
1994 7.1
1996 7.9
1998 6.6
2000 6.3
2002 6.0
2004 6.1
2006 5.7
R
R
R
R
Year Life expectancy
1920 54.1
1930 59.7
1940 62.9
1950 68.2
1960 69.7
1970 70.8
1980 73.7
1990 75.4
2000 76.9
17. Life Expectancy The average life expectancy in the United States has been rising
steadily over the past few decades, as shown in the table.
(a) Find the regression line for the data.
(b) Make a scatter plot of the data, and graph the regression line. Does the regression
line appear to be a suitable model for the data?
(c) What does the slope of the regression line represent?
(d) Use the linear model you found in part (b) to predict the life expectancy in the year
2006.
(e) Search the Internet to find the actual 2006 average life expectancy. Compare it to
your answer in part (c).
18. Olympic Pole Vault The graph in Figure 7 (page 193) indicates that in recent years
the winning Olympic men’s pole vault height has fallen below the value predicted by
the regression line in Example 3. This might have occurred because when the pole vault
SECTION 2.5
■
Linear Regression: Fitting Lines to Data 199
Year x Height (m)
1972
0 5.64
1976
4
1980
8
1984
1988
1992
1996
2000
2004
was a new event, there was much room for improvement in vaulters’ performances,
whereas now even the best training can produce only incremental advances. Let’s see
whether concentrating on more recent results gives a better predictor of future records.
(a) Use the data in Table 2 (page 193) to complete the table of winning pole vault
heights in the margin. (Note that we are using x ⫽ 0 to correspond to the year 1972,
where this restricted data set begins.)
(b) Find the regression line for the data in part (a).
(c) Plot the data and the regression line on the same axes. Does the regression line
seem to provide a good model for the data?
(d) What does the regression line predict as the winning pole vault height for the 2008
Olympics? Has this new regression line provided a better prediction than the line in
Example 2? Compare to the actual result given on page 194.
19. Mosquito Prevalence The following table lists the relative abundance of mosquitoes
(as measured by the “mosquito positive rate”) versus the flow rate (measured as a
percentage of maximum flow) of canal networks in Saga City, Japan.
(a) Make a scatter plot of the data.
(b) Find and graph the regression line.
(c) What does the y-intercept of the regression line represent?
(d) Use the linear model in part (b) to estimate the mosquito positive rate if the canal
flow is 70% of maximum.
Noise level (dB) MRT score (%)
80 99
84 91
88 84
92 70
96 47
100 23
104 11
Flow rate (%)
Mosquito
positive rate (%)
022
10 16
20 12
60 11
90 6
100 2
20. Noise and Intelligibility Audiologists study the intelligibility of spoken sentences
under different noise levels. Intelligibility, the MRT score, is measured as the
percentage of a spoken sentence that the listener can decipher at a certain noise level in
decibels (dB). The following table shows the results of one such test.
(a) Make a scatter plot of the data.
(b) Find and graph the regression line.
(c) Find the correlation coefficient. Is a linear model appropriate?
(d) Use the linear model in part (b) to estimate the intelligibility of a sentence at a 94-dB
noise level.
200 CHAPTER 2
■
Linear Functions and Models
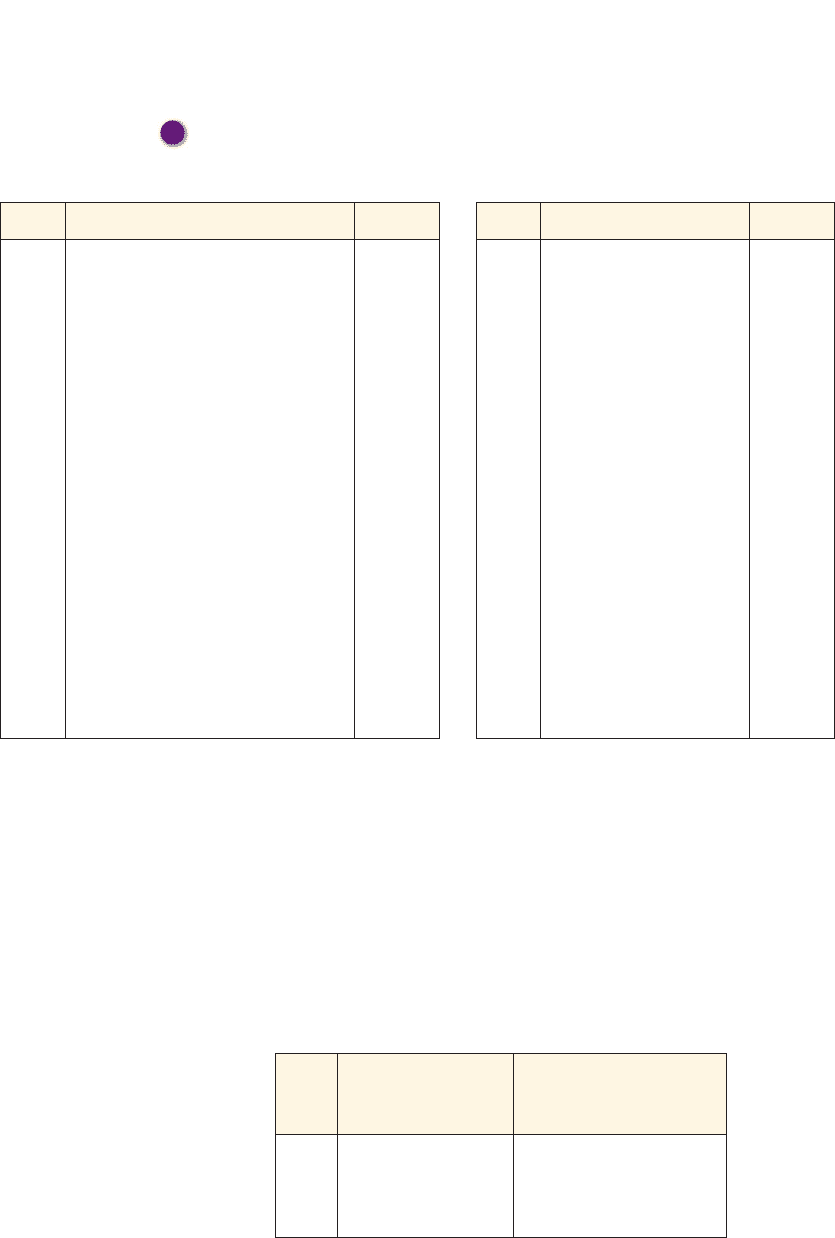
21. Olympic Swimming Records The tables give the gold medal times in the men’s and
women’s 100-m freestyle Olympic swimming event.
(a) Find the regression lines for the men’s data and the women’s data.
(b) Sketch both regression lines on the same graph. When do these lines predict that
the women will overtake the men in the event?
(c) Does this conclusion seem reasonable? Search the Internet for the 2008 Olympic
results to check your answer.
Year Gold medalist Time (s)
1908 C. Daniels, USA 65.6
1912 D. Kahanamoku, USA 63.4
1920 D. Kahanamoku, USA 61.4
1924 J. Weissmuller, USA 59.0
1928 J. Weissmuller, USA 58.6
1932 Y. Miyazaki, Japan 58.2
1936 F. Csik, Hungary 57.6
1948 W. Ris, USA 57.3
1952 C. Scholes, USA 57.4
1956 J. Henricks, Australia 55.4
1960 J. Devitt, Australia 55.2
1964 D. Schollander, USA 53.4
1968 M. Wenden, Australia 52.2
1972 M. Spitz, USA 51.22
1976 J. Montgomery, USA 49.99
1980 J. Woithe, E. Germany 50.40
1984 R. Gaines, USA 49.80
1988 M. Biondi, USA 48.63
1992 A. Popov, Russia 49.02
1996 A. Popov, Russia 48.74
2000 P. van den Hoogenband, Netherlands 48.30
2004 P. van den Hoogenband, Netherlands 48.17
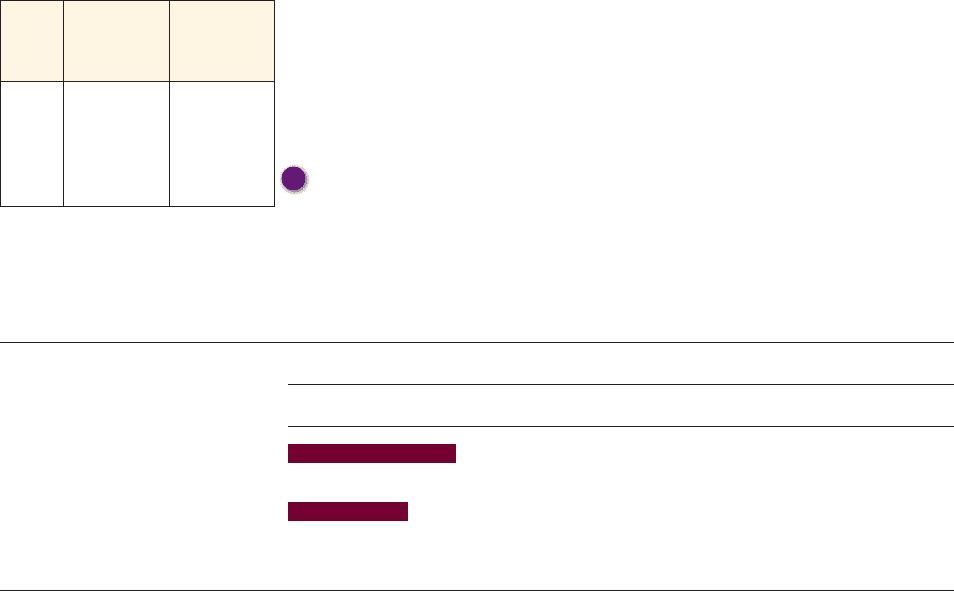
22. Living Alone According to the latest U.S. Census Bureau survey, the number of
Americans living alone now exceeds the number of households composed of the classic
nuclear family: a married couple and their natural children. The table below shows a
detailed account of this trend from 1970 to 2000.
(a) Find the regression line for the percentage of single households as related to the
number of years since 1970.
(b) Find the regression line for the percentage of married households as related to the
number of years since 1970.
(c) Graph the regression lines found in parts (a) and (b), along with a scatter plot of the data.
(d) Use the models found in parts (a) and (b) to predict the percentage of single
households and percentage of married households in 2010. Do you think this is a
reasonable prediction?
Year Gold medalist Time (s)
1912 F. Durack, Australia 82.2
1920 E. Bleibtrey, USA 73.6
1924 E. Lackie, USA 72.4
1928 A. Osipowich, USA 71.0
1932 H. Madison, USA 66.8
1936 H. Mastenbroek, Holland 65.9
1948 G. Andersen, Denmark 66.3
1952 K. Szoke, Hungary 66.8
1956 D. Fraser, Australia 62.0
1960 D. Fraser, Australia 61.2
1964 D. Fraser, Australia 59.5
1968 J. Henne, USA 60.0
1972 S. Nielson, USA 58.59
1976 K. Ender, E. Germany 55.65
1980 B. Krause, E. Germany 54.79
1984 (Tie) C. Steinseifer, USA 55.92
N. Hogshead, USA 55.92
1988 K. Otto, E. Germany 54.93
1992 Z. Yong, China 54.64
1996 L. Jingyi, China 54.50
2000 I. DeBruijn, Netherlands 53.83
2004 J. Henry, Australia 53.84
R
R
MEN WOMEN
Year
Percentage of single
households
Percentage of married
households with children
under age 18
1970 17.6 40.3
1980 22.7 30.9
1990 24.6 26.3
2000 25.5 24.1
SECTION 2.6
■
Linear Equations: Getting Information from a Model 201
2
2.6 Linear Equations: Getting Information from a Model
■
Getting Information from a Linear Model
■
Models That Lead to Linear Equations
IN THIS SECTION… we learn how to get information from a model about the situation
being modeled. Getting this information requires us to solve one-variable linear equations.
GET READY… by reviewing how to solve linear equations in Algebra Toolkit C.1. Test
your skill by doing the Algebra Checkpoint at the end of this section.
2
■ Getting Information from a Linear Model
In Example 4 in Section 2.3 we modeled the volume y of water in a swimming pool
at time x by the two-variable equation
Two-variable equation
If the pool has a capacity of 10,000 gallons, when will the pool be filled? To answer
this question, we replace y by 10,000 in the equation. This gives us the one-variable
equation
One-variable equation
This equation says that at time x the volume y of water in the pool is 10,000. So the
value of x that makes the last equation true is the answer to our question. We’ll solve
this equation graphically and algebraically in Example 1.
10,000 = 200 + 5x
y = 200 + 5x
example
1
Getting Information from a Linear Model
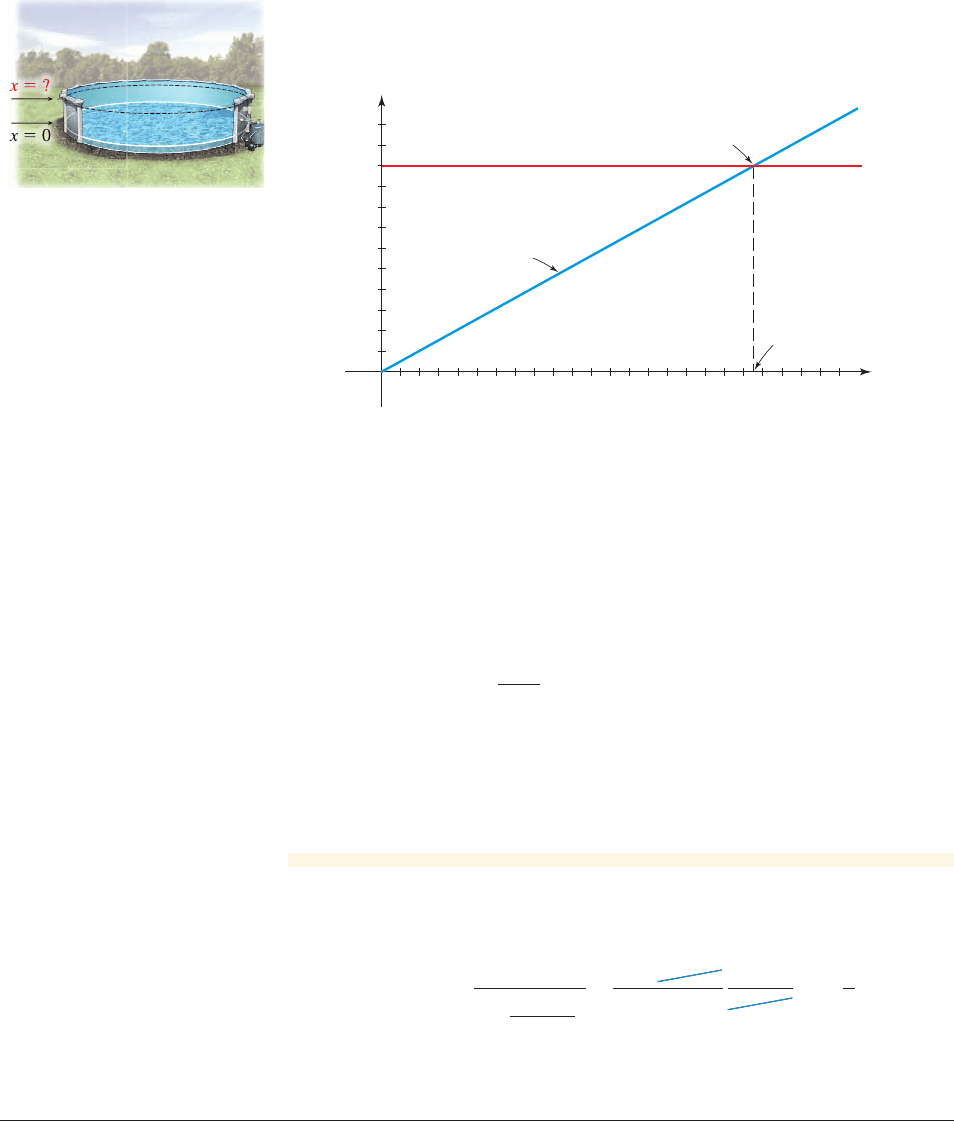
A swimming pool is being filled with water. The linear equation
models the volume y of water in the pool at time x (see Example 5, p. 157). If the
pool has a capacity of 10,000 gallons, when will the pool be filled?
Solution 1 Graphical
A graph of is shown in Figure 1 on page 202. Since the pool is filled
when the volume y is 10,000, we also graph the line . The pool is filled aty = 10,000
y = 200 + 5x
y = 200 + 5x
23. Women in Science and Engineering The number of women receiving doctoral
degrees in science and engineering has been rising steadily. The table gives a detailed
account of these doctoral degrees from 2002 to 2006.
(a) Find the regression line for the number of science and engineering doctorates as a
function of the number of years since 2002.
(b) Find the regression line for the number of women receiving doctoral degrees in
science and engineering as a function of the number of years since 2002.
(c) Graph the regression lines along with the scatter plots of the data.
(d) Use the model found in part (b) to predict the number of women who receive
doctorates in science and engineering in 2007. Search the Internet to find the actual
number of women who received doctorates in science and engineering in 2007, and
compare it to your answer.
R
R
Year
All
S&E
doctorates
Women
S&E
doctorates
2002 24,609 9172
2003 25,282 9519
2004 26,275 9856
2005 27,989 10,539
2006 29,854 11,469
Science and engineering doctorates
202 CHAPTER 2
■
Linear Functions and Models
the time x where these two graphs intersect. From the figure we see the height of the
graph of reaches 10,000 when x is about 1950. So the pool is filled in
about 1950 minutes.
y = 200 + 5x
2
■ Models That Lead to Linear Equations
Recall that a model is a function that represents a real-world situation. Here we construct
models that lead to linear equations. (Getting information from these models requires us
to solve linear equations.) In constructing models, we use the following guidelines.
8000
6000
4000
2000
12,000
10,000
400 800
Pool is filled when
y=10,000 gallons
Pool is filled in
about 1950 minutes
y=10,000
y=200+5x
2400200016001200
0
y
x
figure 1 Graphs of
and y = 10,000y = 200 + 5x
We want to find the time x when the
pool is filled.
Solution 2 Algebraic
The pool is filled when the volume y is 10,000 gallons. Replacing y by 10,000 in the
equation gives us a one-variable equation in the variable x. We solve
this equation for x, the time when the pool is filled.
Equation
Replace y by 10,000
Subtract 200 from each side
Divide by 5, and switch sides
Calculator
So 1960 is a solution to the equation. This means that it takes 1960 minutes to fill the
pool. Notice that the algebraic solution gives us an exact answer, whereas the graph-
ical solution is approximate.
■ NOW TRY EXERCISE 21 ■
In Example 1 the solution is 1960 minutes. Such a large number of minutes is
better understood if it is stated in hours:
So it takes 32 hours and 40 minutes to fill the pool.
1960 minutes =
1960 minutes
60
minutes
hour
=
1960 minutes
60
hour
minutes
= 32
2
3
hours
x = 1960
x =
9800
5
9800 = 5x
10,000 = 200 + 5x
y = 200 + 5x
y = 200 + 5x

SECTION 2.6
■
Linear Equations: Getting Information from a Model 203
In the next example we construct a model involving simple interest. We use the
following simple interest formula, which gives the amount of interest I earned
when a principal P is deposited for t years at an interest rate r:
When using this formula, remember to convert r from a percentage to a decimal. For
example, in decimal form, 5% is 0.05. So at an interest rate of 5% the interest paid
on a $1000 deposit over a 3-year period is .I = Prt = 100010.05 213 2= $150
I = Prt
example
2
Constructing and Using a Model (Interest)
Mary inherits $100,000 and invests it in two one-year certificates of deposit. One cer-
tificate pays 6%, and the other pays simple interest annually.
(a) Construct a model for the total interest Mary earns in one year on her
investments.
(b) If Mary’s total interest is $5025, how much money did she invest in each
certificate?
Solution
(a) Choose the variable. The variable in this problem is the amount that Mary
invests in each certificate. So let
Translate words to algebra. Since Mary’s total inheritance is $100,000
and she invests x dollars at 6%, it follows that she invested at
in the second certificate. Let’s translate all the information given in the
problem into the language of algebra.
4
1
2
%
100,000 - x
x = amount invested at 6%
4
1
2
%
1. Choose the variable. Identify the varying quantity in the problem (the
independent variable) and give it a name, such as x.
2. Translate words to algebra. Express all the quantities given in the
problem in terms of the variable x.
3. Set up the model. Express the model algebraically as a function of the
variable x.
In Words In Algebra
Amount invested at 6% x
Amount invested at %4
1
2
100,000 - x
Interest earned at 6%
0.06x
Interest earned at %4
1
2
0.0451100,000 - x2
How to Construct a Model
Set up the model. We are now ready to set up the model. The function we
want gives the total interest Mary earns (the interest she earns at 6% plus the
interest she earns at ).4
1
2
%