Shani G. Radiation Dosimetry: Instrumentation and Methods
Подождите немного. Документ загружается.


410 Radiation Dosimetry: Instrumentation and Methods
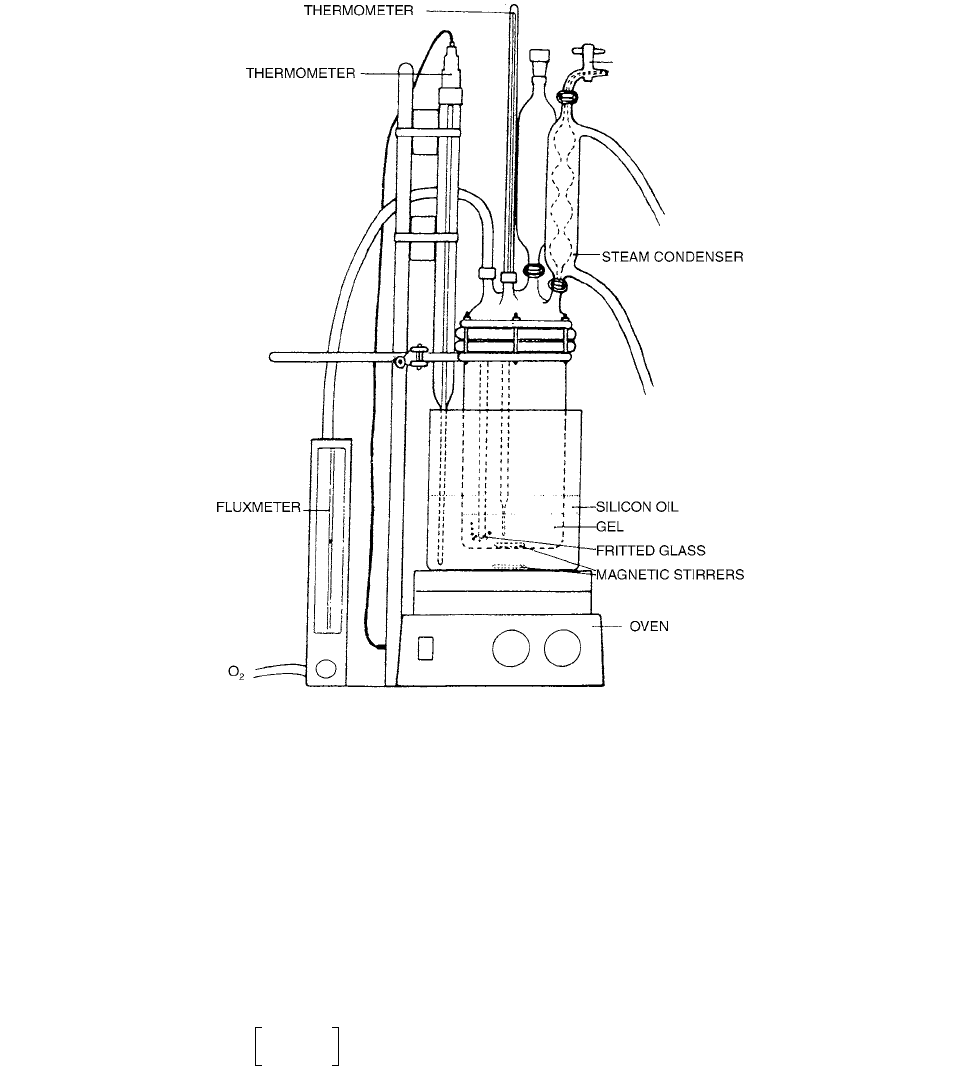
steam recovery, and a Pyrex tube with a fritted glass end-
ing to bubble oxygen into the gel. The container is put
into a Si oil bath, over an oven whose power supply is
controlled by a thermometer plunged into a the Si oil. In
the oven plate a magnetic stirrer with an independent
power supply is incorporated. A view of the apparatus is
shown in Figure 9.10.
From the dose-response result, one can estimate the
G value of this dosimeter.
(9.14)
where R
a
is the relaxation-rate increase per unit concen-
tration of ferrous ion, R
b
is the relaxation-rate increase
per unit concentration of ferric ion, and
is the density
(kg m
3
).
The resulting density of the doped gel was
1076 kg
m
3
. From the experimental results of Prasad et al. [22] for
relaxation rates vs. ion concentrations, one obtains
(9.15)
Assuming this value, the ferrous-ion yield becomes
G 183 (Fe
3
ions per 100 eV)
The diffusion problem in the traditional Fe(II/III) aga-
rose gel system employed in MRI studies of radiation
dosimetry was studied by Balcom et al. [11] The diffusion
coefficient of Fe(III) in 1% agarose gel at pH 1.1 is D
2.7 0.3 10
6
cm
2
s
-1
. The diffusion coefficient of
Fe(II) is D 3.3 0.5 10
6
cm
2
s
1
. Measurement of
the diffusion coefficients permits simulation of the MRI-
signal intensity from phantoms with model radiation dose
distributions.
The basis for the investigated diffusion measurement
is the linear relationship between spin-lattice relaxation
rates and paramagnetic concentration. The paramagnetic
may be either Fe(II) or Fe(III). The H relaxation rate of
water protons in a gel is a first-order process governed by
Equation (9.16):
(9.16)
where
C is the concentration of the paramagnetic ion, b
is the molar relaxivity, and a is the inverse natural lifetime
of water in this environment. The values of a and b are
determined for each paramagnetic species through a sys-
tematic calibration.
The signal intensity at any point in the profile, ignor-
ing instrumental factors, is given by:
(9.17)
where
is the proton density, TE is the echo time, and T
2
is the spin-spin relaxation time of the water. If the delay
t
d
after the first 180° pulse is set equal to (ln2 T
1
), the
signal from that point in space will be zero. Signal vari-
ation along the profile is primarily determined by the
spatial variation of T
1
in the last term of Equation (9.17).
FIGURE 9.9 The spin-echo amplitude taken from measurements in a FeSO
4
agarose gel, with a one-exponential three-parameter fit.
(From Reference [10]. With permission.)
G RD()9.64 10
9
R
b
R
a
()
Fe
3
ions per 100 eV()
R
b
R
a
()10.2 0.4()s
1
mM
1
9.8 10
3
s
1
M
1
1T
1
abC
S
exp TET
2
()1 2exp t
d
T
1
()[]
Ch-09.fm Page 410 Friday, November 10, 2000 12:04 PM
Gel Dosimetry 411
The spatial variation of concentration is governed by
the one-dimensional diffusion equation
(9.18)
The solution to Equation (9.18) for free diffusion into a
semi-infinite slab from a constant concentration reservoir
is given by
(9.19)
The ratio
CC
0
is the normalized concentration, D the
diffusion coefficient, x the spatial position, and t the
elapsed time of the experiment. The initial boundary con-
ditions are
C C
0
for x 0 and C 0 for x 0. The
boundary conditions require that for the length of the
experiment the reservoir stay at a fixed concentration and
be well-mixed.
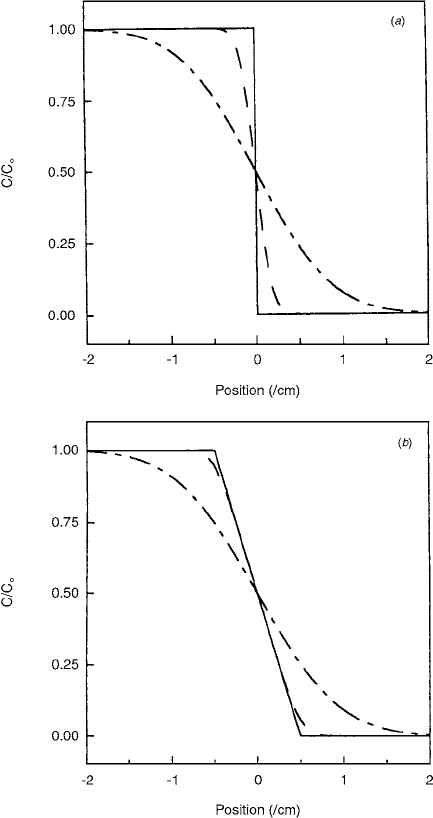
Figure 9.11 shows the concentration variation with
position for the two initial boundary conditions at times
0, 1, and 24 h. It is seen that the initial boundary has a
significant influence on the curves only at very short times.
After 8 h, the Fe(III) concentration was 25% and 75% of
the initial value at a distance of 0.27 cm from the step
function boundary and a distance of 0.34 cm from the
center of the broad boundary. After only 24 h, the corre-
sponding values were 0.47 cm and 0.51 cm, respec-
tively. These two values are strikingly similar, considering
the difference between the initial conditions of the two
systems. After 24 h, for the case of Fe(III) in agarose gel
phantoms, the details of the initial boundary are unimpor-
tant, compared to the effects of diffusion in determining
the variation of concentration with position.
NMR relaxation times T
1
and T
2
of agarose and Fricke
agarose gels have been measured by Luciani et al. [12] in
the range 17–51 MHz. The analysis of the spin-echo
curves indicates multi-exponential behavior, characterized
by three components, at all the examined frequencies. The
relative
T
2
values, ranging from a few to a hundred milli-
seconds, can be attributed to different species of water
molecules present in the gel. Two of these components
are characterized by relaxation rates and more
sensitive than R
1
to gamma irradiation, with the sensitivity
FIGURE 9.10 A view of the apparatus for the dosimeter gel preparation. (From Reference [10]. With permission.)
C
t
-------
D
2
C
x
2
---------
Cx, t()
C
0
-----------------
Erfc
x
4Dt()
12
--------------------
R
2
a
R
2
b
Ch-09.fm Page 411 Friday, November 10, 2000 12:04 PM
412 Radiation Dosimetry: Instrumentation and Methods
S being S(R
1
) 0.066 s
1
Gy
1
, S( ) 0.088 s
1
Gy
1
,
S( ) 0.17 s
1
Gy
1
. The three T
2
values decrease as
a function of frequency, but no gain in dose sensitivity is
obtained by changing the working frequency in the exam-
ined range. It was possible to estimate the irradiation yield
from three independent parameters, R
1
, , and .
Preparation of the agarose gels was as follows: agarose
powder, Sigma Chemicals, type VII, was dissolved in triple-
distilled water, then boiled to obtain a clear solution. It was
subsequently oxygenated by bubbling the gas through it for
30 min and allowed to cool to 36°C before the Fricke solu-
tion was added. All steps after boiling were conducted under
constant stirring. Volumes of about 70
l were then poured
into 5-mm-diameter NMR tubes and allowed to gel at room
temperature. The final concentrations were 1.5-mM ferrous
ammonium sulphate, 1-mM sodium chloride, 50-mM sul-
phuric acid, and 1% agarose by weight. [12]
FERRIC AGAROSE GEL
The diffusion of ferric ions produced by irradiation in a
dosimeter gel, consisting of a ferrous sulphate solution and
agarose gel, has been studied by Olsson et al. [13] The
purpose of the study was to measure the diffusion coefficient
of ferric ions in the gel, to investigate how the diffusion of
ferric ions affects a dosimetric image with time, and to
evaluate when it is necessary to correct for this distortion.
The diffusion coefficient of ferric ions in the gel was found
to be 1.91
10
2
cm
2
h
1
5%. It was shown that the dose
image obtained with an MR scanner deteriorates due to dif-
fusion. This deterioration can be predicted with the aid of the
measured diffusion coefficient. It was concluded that if the
MR measurements (1T
1
image) of a typical depth-dose
distribution are carried out within 2 hours of irradiation, the
diffusion will not have a significant effect on the results.
Among the dosimeters used to measure ionizing radi-
ation, the dosimeter gel has recently been recognized as
a new and interesting tool for the determination of
absorbed dose distributions. The dosimeter consisted of a
ferrous sulphate solution mixed with a gel, usually agarose
gel. The radiolysis induced by the radiation produces
ferric ions in an amount proportional to the absorbed
dose. The concentration of ferric ions is also proportional
to the inverse of the proton spin-lattice relaxation time,
1T
1
, which can be measured by magnetic resonance
imaging (MRI). To maintain the spatial distribution of the
produced ferric ions over a period of time, sufficient to
allow measurements in an MR scanner, the ferrous sul-
phate solution is incorporated within a gel.
The diffusion of medium-sized solutes in uncharged
dilute gels, such as the diffusion of ferric ions in agarose,
can be regarded as normal aqueous diffusion in the pres-
ence of an inert polymer matrix. The main effect of the
polymer matrix is to increase the path length traveled by
a diffusing solute. A number of equations predicting the
ratio of the diffusion coefficient in a gel, D, to the corre-
sponding aqueous diffusion coefficient, D
aq
, have been
proposed. The equation of Mackie and Meares,
(9.20)
where
p
is the polymer volume fraction of the gel ,
has been shown to agree well with experimental data.
This equation is an attractive alternative to experiments,
provided that an accurate value of D
aq
is available. Unfor-
tunately, the value of the aqueous diffusion coefficient
D
aq
for the ferric ion, valid for the present electrolyte
mixture, could not be found in the literature. The exper-
imental approach of determining D was thus chosen since
FIGURE 9.11 Simulation of the integrated diffusion equation at
times 0 (—), 1 h (---), and 24 h (—
•
—) for (
a) step function and
(
b) extended initial boundary conditions. The plot is generated
with
D 2.7
10
6
cm
2
s
1
and the initial boundary is centered
about
x 0 cm. (From Reference [11]. With permission.)
R
2
a
R
2
b
R
2
a
R
2
b
DD
aq
1
p
()
2
1
p
()
2
Ch-09.fm Page 412 Friday, November 10, 2000 12:04 PM
Gel Dosimetry 413
a reliable and precise technique of measuring diffusion
coefficients in gels was available. [13]
The dosimeter gel is a mixture of ferrous sulphate
solution and agarose gel. In the dosimeter gel, the final
concentrations of the ingredients were: ferrous ammonium
sulphate, 1.0 mM; sodium chloride, 1.0 mM; sulphuric
acid, 50 mM; and for SeaPlaque and SeaGel, 1.25 and
0.25% by weight, respectively.
A diaphragm diffusion cell was used, which consists of
two compartments (A and B) separated by a gel diaphragm
of known thickness, l, and area, A. Each compartment con-
tains a well-stirred solution of known volume, V
A
and V
B
,
respectively. The solution in compartment A initially con-
tains the solute being studied, while solution B is pure
solvent. A pseudo-steady-state diffusional solute flux, N,
through the diaphragm is attained after an initial time delay,
t
0
. Measurement of the solute concentrations, C
A
and C
B
, is
then started and continued for a period of approximately
4
t
0
or longer. Assuming one-dimensional diffusional flux,
perfect mixing, and negligible mass-transfer resistance at
the gel-liquid interface, the diffusional flux is given by
(9.21)
where (1
p
) is identified as the void fraction of the gel
that is accessible to the diffusing solute. Equation (9.21)
is simply the well-known Pick law, integrated over the
diaphragm from x 0 to x l, assuming constant D and
a porous medium. However, C
A
and C
B
are not constant,
and Equation (9.21) is not a suitable “working equation.”
With the aid of a material balance and the assumption of
a pseudo-steady state, a convenient Equation (9.22) is
obtained. Plotting the experimental values of the left-hand
side as a function of time t, the diffusion coefficient is
obtained from the slope of the straight line: [13]
(9.22)
Here, and are the concentrations of chambers A
and B, respectively, at t
0
. Many authors simply ignore the
very existence of (1
p
) or implicitly assume it to be
unity. While dubious in many cases, the latter assumption
is justified for the present case since
p
is very low and
the size of the diffusing ferric ion is several orders of
magnitude smaller than the “pore radius” of the gel.
A standard procedure for an accurate estimate of a 1/
T
1
map is to calculate it from a set of spin-echo images with
different repetition times. The total scanning time for this
procedure may be more than one hour. When diffusion is the
parameter to be studied, an hour may be a rather long acqui-
sition time, as the diffusion may be significant during this
time. Therefore, single images, in which the echo-amplitude
(or MR signal) can be approximated as linear with 1
1
(which also means linear with respect to the absorbed dose)
are used. An absorbed dose of 30 Gy yields T
1
values in the
region of 650 ms and, for non-irradiated gel, 1700 ms (at
1.0 T); T
2
for the gel is approximately 80 ms. In a spin-echo
sequence with a short repetition time (TR 100 ms) and
echo-time (TE 23 ms), the MR signal is approximately
linearly dependent on 1T
1
(or the absorbed dose). The rel-
ative signal can be calculated from [13]
A value of D 1.91 10
2
cm
2
h
1
(5%) was
obtained from three identical but separate experiments. This
can be compared with the result of Schulz et al. [14] They
used a method of unsteady-state diffusion into agarose slabs
and obtained D 1.58 10
2
and 1.83 10
2
cm
2
h
1
for sulphuric acid concentrations of 25 and 12.5 mM,
respectively. The temperature at which their measurements
were carried out was not given. [13]
Gambarini et al. [15] described a technique to obtain
three-dimensional (3D) imaging of an absorbed dose by
optical transmittance measurements of phantoms com-
posed of agarose gel in which a ferrous sulphate and
xylenol orange solution were incorporated. The analysis
of gel samples was performed by acquiring transmittance
images with a system based on a CCD camera provided
with an interference filter matching the optical absorption
peak of interest. The proposed technique for 3D measure-
ments of an absorbed dose is based on the imaging of
phantoms composed of sets of properly piled up gel slices.
Gel containing
10
B in the amount typically accumu-
lated in tumors for BNCT was analyzed by Gambarini
et al. [16] The isodose curves were obtained from NMR
analysis of a phantom of borated gel after irradiation in
the thermal column of a nuclear reactor.
In NMR analysis, a good result is achieved if the
dosimeter response
R is defined as the difference between
the relaxation rate (1T) measured in the irradiated sample
and that measured, at the same time, in an un-irradiated
sample from the same gel preparation:
(9.24)
The highest sensitivity has been obtained with the follow-
ing gel composition.
• Ferrous sulphate solution: 1mM Fe(NH
4
)-6H
2
O,
50 mM H
2
SO
4
in the amount of 50% of the final
weight
• Agarose SeaPlaque: [C
12
H
14
O
5
(OH)
4
] in the
amount of 1% of the final weight
• Highly purified water: H
2
O in the amount of
49% of the final weight
N 1
p
()D
C
A
C
B
l
---------------------
C
A
C
B
C
A
0
C
B
0
------------------------
ln
1
p
()DA
l
-------------------------------
1
V
A
------
1
V
B
------
tt
o
()
C
A
0
C
B
0
Se
TET
2
12e
TR TE 2()T
1
e
TRT
1
[]/
1 e
TRT
1
e
TRT
2
()
R 1T()
irr
1T()
blank
(9.23)
Ch-09.fm Page 413 Friday, November 10, 2000 12:04 PM
414 Radiation Dosimetry: Instrumentation and Methods
The sensitivity of this gel is better than that of the standard
Fricke dosimeter; in the
-ray field of a
137
Cs biological
irradiator delivering a dose rate of 0.14 Gys
1
, the dose-
response curve, obtained by measuring the transverse
relaxation rates (1T
2
) with a Somatom Siemens imaging
analyser operating at 1.5 T, 63 MHz, shows good linearity
up to 40 Gy, with slope equal to 0.2 s
1
Gy
1
.
The additional absorbed dose due to 40
gg
1
of
10
B
has been evaluated by means of the relation:
(9.25)
where
D is the absorbed dose in Gy,
3.837 10
21
cm
2
is the reaction cross section,
F 4 10
5
is the
10
B fraction by weight,
N 6 10
22
is the number of atoms per gram of
10
B,
E 2.28 MeV is the energy released per event, and
= the thermal neutron fluence in ncm
2
.
For the absorbed dose per unit fluence:
Gels infused with the Fricke solution limit the diffu-
sion rate and can be scanned in 3D using magnetic res-
onance imaging (MRI). While most of the development
of MRI dosimetry has been with Fricke solution infused
in protein gelatin, more promising results have been
obtained in a new polymer gelatin system. However, this
MRI approach has several drawbacks. This technique
requires access to MRI facilities in reasonable proximity
to the irradiation facilities. With the current sensitivity and
signal-to-noise ratio of MRI, good dosimetric images have
been produced only for thick image slices through the gel.
The chemical preparation of the acrylamide polymer is
potentially very toxic and also requires that the gel be free
of oxygen in order for the reaction to proceed. [17]
Optical methods have been used to map 2D dose dis-
tributions in slices of gel containing ferrous sulphate–
benzoic acid–xylenol orange (FBX) solution. Optical com-
puted tomography (OCT) reconstruction techniques have
been introduced to map 3D dose distributions in cylindrical
and spherical volumes of polymer gel material. The change
in optical attenuation of the acrylamide gels is due mainly
to optical scattering, and this will ultimately limit dose
sensitivity accuracy.
Kelly et al. reported the use of radiochromic gels in
order to improve safety, convenience, and the performance
of optical CT dosimetry. The optical densities of radio-
chromic compounds like the FBX solution show an
increase with absorbed dose when irradiated with x-ray
photons and the change is due to absorption rather than
scattering of light. FBX was chosen over standard Fricke
solution because it could be probed using light of longer
wavelength (
543.5 nm) in order to reduce Rayleigh
scattering and thereby increase our signal-to-noise ratio.
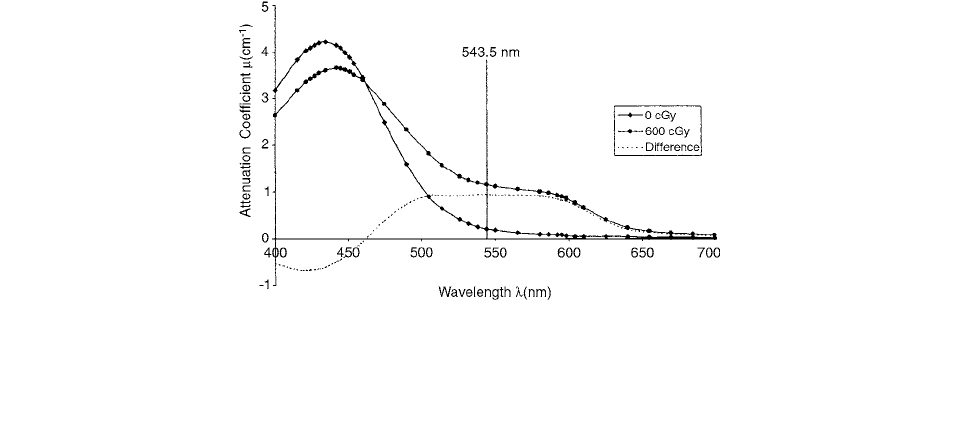
The radiochemistry of the FBX liquid dosimeter has
been shown to have properties very similar to the standard
liquid Fricke solution. When the ferrous ion (Fe
2
) is
irradiated, it oxidizes to form the ferric ion (Fe
3
), and
the corresponding complex with xylenol causes a change
in absorption, which has a broad peak centered at a wave-
length of 540 nm (Figure 9.12). The radiation-induced
change in the absorption spectrum is known to be a lin-
early proportional to the radiation dose and can be probed
easily using a helium-neon laser beam at a wavelength of
543.5 nm.[17]
D 1.602 10
10
FNE
Gy()
D 3.364 10
12
Gy cm
2
()
FIGURE 9.12 Change in FBX-gel absorption spectrum due to irradiation. The attenuation of the un-irradiated gel (0 cGy curve) and
the irradiated gel (600 cGy curve) were measured using water as the reference. The difference between the two curves gives the change
in the absorption coefficient due to the irradiation, consisting of a broad peak centered near 540 nm. The vertical line indicates the
frequency of the He-Ne laser used to probe the FBX-gel system. (From Reference [17]. With permission.)
Ch-09.fm Page 414 Friday, November 10, 2000 12:04 PM
Gel Dosimetry 415
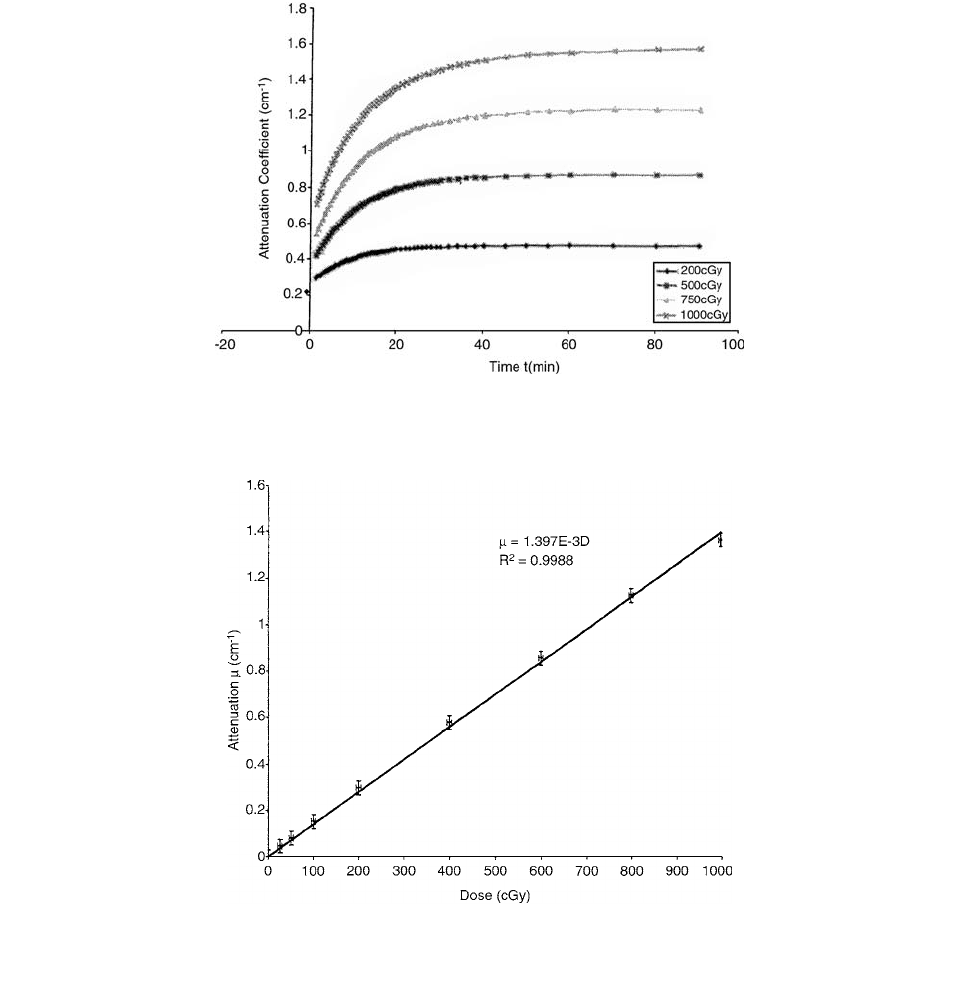
Figure 9.13 shows the reaction completion time of the
exposed FBX-gel. Samples were irradiated in methacrylate
cuvettes (4.5 ml, 1.0-cm pathlength) to doses of 200, 500,
1000, and 2000 cGy. Immediately following the irradia-
tion, the absorption of the samples was measured as a
function of time with a spectrophotometer. The tempera-
ture of the cuvettes was maintained at 10°C by placing the
cuvettes in a thermal reservoir filled with double-distilled
water. In Figure 9.13, the 200-cGy sample reached quasi-
saturation and stabilized after 40 min. The attenuation of
the 1000-cGy sample, on the other hand, was still notice-
ably changing after 60 min.
The dose response curve for the preparation of FBX-
gelatin is plotted in Figure 9.14. Cylinders of gel were irra-
diated with a 4.0-cm 4.0-cm field of
60
Co gamma-rays.
The optical characteristics of a ferrous benzoic acid
xylenol orange in gelatin (FBXG) have been studied by
Bero et al. [18] over the wavelength range 300–700 nm
as a function of radiation dose. The un-irradiated gel
exhibits a strong absorption peak at 440 nm; with increas-
ing dose, this peak starts to reduce in intensity, while a
new broad peak centered at 585 nm begins to appear.
Using
60
Co gamma-rays, the absorption coefficients for
these two peaks were found to vary linearly with dose up
FIGURE 9.13 Graph showing the reaction completion time for FBX-gel irradiated to a dose of 1000 cGy. The graph clearly indicates that
at least a 1-h post irradiation time is required before the dose distribution can be scanned optically. (From Reference [17]. With permission.)
FIGURE 9.14 Plot of the reconstructed attenuation coefficient vs. dose for FBX-gelatin. The error in the dose corresponds to an
uncertainty of
2%, while the error in the reconstructed attenuation is a fixed value of 0.03. (From Reference [17]. With permission.)
Ch-09.fm Page 415 Friday, November 10, 2000 12:04 PM
416 Radiation Dosimetry: Instrumentation and Methods
to at least 30 Gy with slopes of 0.028 cm
1
Gy
1
(440
nm) and 0.069 cm
1
Gy
1
(585 nm). The NMR response
of FBXG gels was found to be marginally reduced com-
pared to the standard Fricke dosimeter in gel form, and
the NMR technique was much less sensitive than the opti-
cal read-out method.
The FBXG dosimeter has two main constituents: 75%
by volume is the gel component, and the modified Fricke
solution makes up the rest. The gels were prepared by mixing
5% by weight gelatin with “Milli-Q” (highly purified) water;
the mixture was heated to 45°C under constant stirring until
the gelatin powder was completely dissolved. The FBX
solution consisted of 0.5 mM ferrous ammonium sulphate,
25 mM sulphuric acid, 1mM benzoic acid, and 0.1 mM
xylenol orange (sodium salt). The benzoic acid crystals were
put into the ion-indicator solution and heated until they dis-
solved, and then this mixture was added to the inorganic
components; all these concentrations, are expressed rel-
ative to the final FBXG volume.
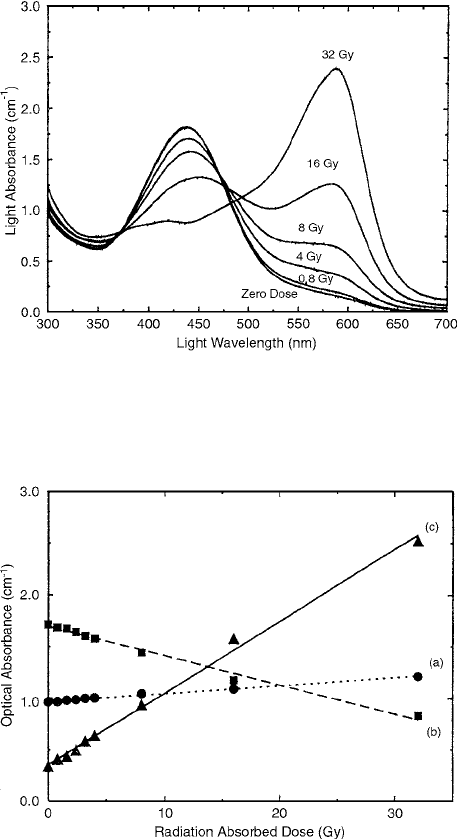
Figure 9.15 shows the optical absorption spectra for
FBXG exposures of 0–32 Gy. The most prominent features
of these data are two broad peaks at 440 and 585 nm; the
440 nm peak, which is a feature of the un-irradiated gel,
consistently reduces with increasing dose and has almost
disappeared at 32 Gy. By contrast, the 585-nm absorbance
increases from a very low value at zero dose to become a
very strongly defined peak at higher doses. The absorbance
at 304, 440, and 585 nm is plotted as a function of dose in
Figure 9.16, where it is clear that the 585-nm response gives
both the greatest sensitivity and the lowest detectable dose
(estimated to be about 0.5 Gy).
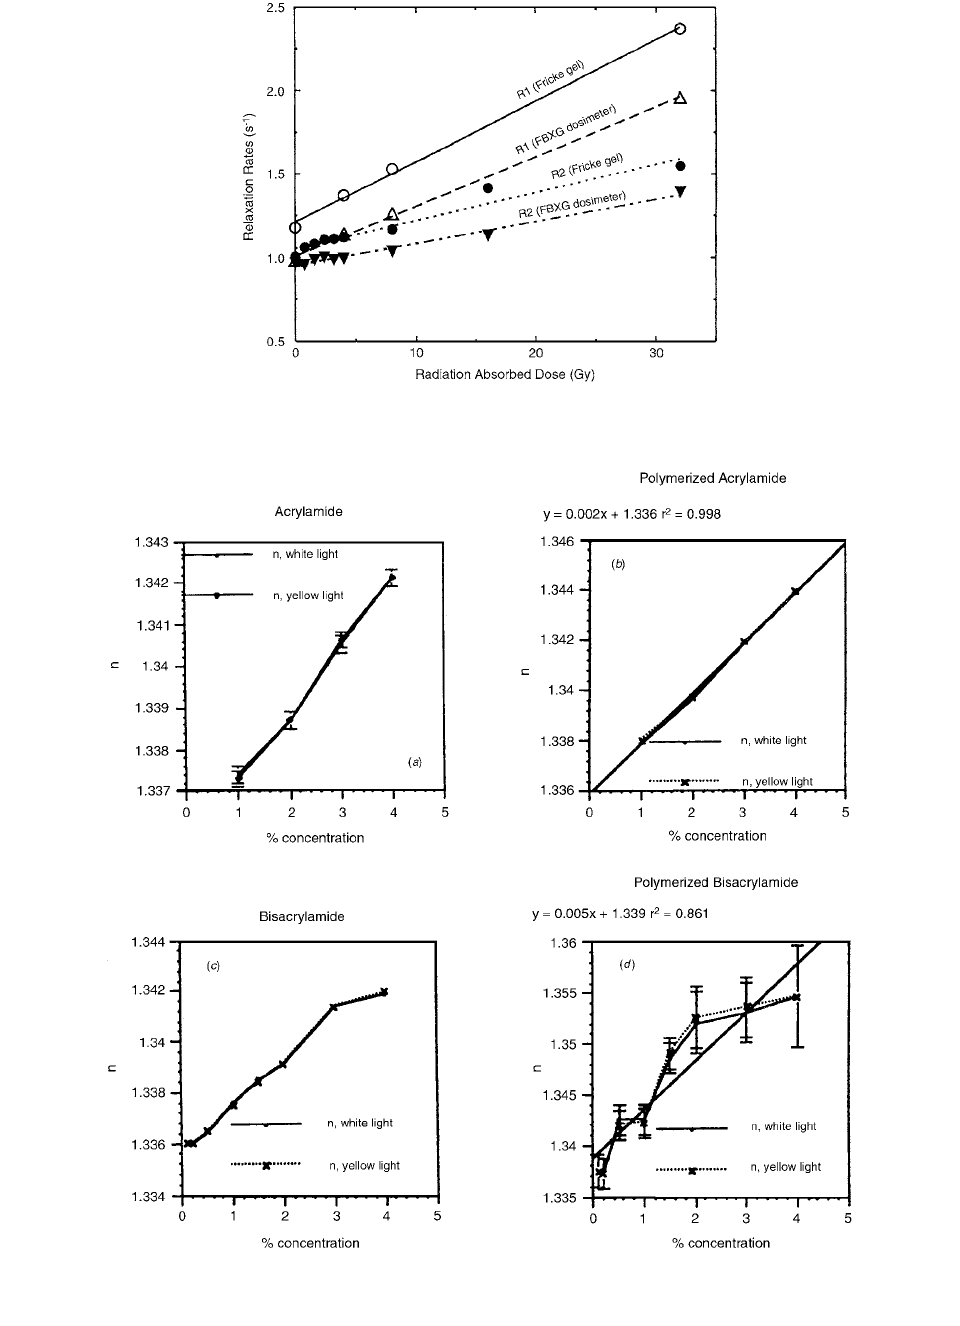
NMR measurements of
R
1
and R
2
are shown in Figure
9.17 as a function of dose for the conventional Fricke doped
gelatin gel and for FBXG. The FBXG R
1
, R
2
dose responses
are slightly smaller than those of the simple Fricke gel and
much smaller than the optical response at 585 nm.
III. APPLICATION OF BANG POLYMER GEL
Optical properties of the BANG polymer gel were dis-
cussed by Maryanski et al. [19] The dose-response mech-
anism relies on the production of light-scattering polymer
micro-particles in the gel at each site of radiation absorp-
tion. The scattering produces an attenuation of transmit-
ted light intensity that is directly related to the dose and
independent of dose rate. For the BANG polymer gel (bis,
acrylamide, nitrogen, and gelatin), the shape of the dose-
response curve depends on the fraction of the cross-link-
ing monomer in the initial mixture and on the wavelength
of light. At 500 nm the attenuation coefficient (
)
increases by approximately 0.7 mm
1
when the dose
increases from 0 to 5 Gy. The refractive index of an
irradiated gel shows no significant dispersion in the vis-
ible region and depends only slightly on the dose. The
average sizes of the cross-linked particles produced by
radiation, as a function of dose, was established. The
particle sizes increase with dose and reach approximately
the wavelength of red light.
The BANG polymer gels, prepared by Marganski et al.,
contain 5% by weight gelatin, 89% water, and 6% acrylic
monomers acrylamide and bis (i.e., N,N-methylene-bis-
acrylamide), with four different fractions of the cross-linking
monomer bis in the monomer feed. Expressed in percent-
age units (%C) as 17, 33, 50, and 67%C. The gels are
irradiated in test tubes to graded doses using 250-kV
x-rays, with a dose rate of 3.5 Gy min
1
.
Figure 9.18. demonstrates that the refractive index does
not increase significantly when a solution of monomers is
FIGURE 9.15 FBXG optical absorbance spectra for samples
irradiated to 0.8, 4, 8, 16, and 32 Gy. (From Reference [18]. With
permission.)
FIGURE 9.16 FBXG dose response curves at different wave-
lengths: (a) at 304 nm, (b) at 440 nm, (c) at 585 nm. (From
Reference [18]. With permission.)
Ch-09.fm Page 416 Friday, November 10, 2000 12:04 PM
Gel Dosimetry 417
FIGURE 9.17 A comparison between the NMR relaxation rates of FBXG gel and the standard Fricke gel dosimeter; solid lines are
for Fricke gel and dashed lines are for FBXG. (From Reference [18]. With permission.)
FIGURE 9.18 (a), (b), (c), (d) The concentration dependence of the index of refraction for (a) acrylamide and (c) bis monomer
solutions and (b), (d) for corresponding polymers. (From Reference [19]. With permission.)
Ch-09.fm Page 417 Friday, November 10, 2000 12:04 PM

418 Radiation Dosimetry: Instrumentation and Methods
polymerized thoroughly by chemical means. This effect
can be expected to be even smaller when the polymeriza-
tion is only fractional, as it is in polymer gels irradiated
to low doses. Figure 9.19 shows how the refractive index
depends on the dose for two cross-linker fractions. The
changes overall do not exceed 0.5% at the maximum dose
of 14 Gy; therefore, it can be expected that refraction in
the regions of high-dose gradient should not significantly
distort the optical density projections in the optical scanner.
Calculated average upper limits of the particle sizes
produced within several dose intervals are shown in
Figure 9.20.
FIGURE 9.19 (a), (b) The dose dependence of the refractive index of polymer gels. (a) 50%C BANG, (b) 67%C BANG. (From
Reference [19]. With permission.)
FIGURE 9.20 Maximum sizes of radiation-induced cross-linked polyacrylamide panicles for seven dose intervals. The power law
fits are as follows:
(From Reference [19]. With permission.)
17%C
33%C
50%C
67%C
2a 304.2D
0.171
2a 312.0D
0.246
2a 363.3D
0.266
2a 288.6D
0.246
r
2
1.00
r
2
0.91
r
2
0.91
r
2
0.97
Ch-09.fm Page 418 Friday, November 10, 2000 12:04 PM
Gel Dosimetry 419
The effects of varying the weight fraction (%C) of
the cross-linker N,N-methylene-bisacrylamide (bis) per
total amount of monomer (6% w/w), and the NMR mea-
surement temperature, on the dose response of the trans-
verse relaxation rate (R
2
) of bis-acrylamide-nitrogen-gel-
atin (BANG) aqueous polymer gel dosimeters have been
investigated by Maryanski et al. [20] The gel samples
were irradiated in test tubes with 250-kV x-rays, and the
water proton NMR transverse relaxation rates were mea-
sured at 0.47 T using a Carr-Purcell-Meiboom-Gill mul-
tiecho pulse sequence. Both the dose sensitivity (slope
of the linear portion of an R
2
-dose response) and the
maximum rate at which the R
2
-dose response saturated
(R
max
2
) were found to depend strongly on the cross-linker
fraction and on the temperature of the R
2
measurement.
The dose sensitivity peaked at approximately 50%C and,
for this composition, varied from 0.14 s
1
Gy
1
at 40°C
to 0.48 s
1
Gy
1
at 10°C. The maximum transverse relax-
ation rates ranged from 0.8 s
1
at 33%C and 40°C to
11.8 s
1
at 83%C and 5°C. These results suggest that
water proton transverse relaxation in the gel is controlled
by an exchange of magnetization between the aqueous
phase and the semi-solid protons associated with the
polymer, and that the latter experience spectral broaden-
ing from immobilization, which increases with cross-
linking or cooling.
Solutions were prepared in 100-ml quantities. Gelatin
(5% w/w), acrylamide, and bis (6% w/w total comono-
mers) were dissolved in water (89% w/w) at 60°C. The
bis weight fraction (%C) per total amount of comonomer
was varied from 17%C to 83%C. Two ml of each solution
were poured into glass test tubes, which were maintained
at 60°C in a water bath. Humidified nitrogen gas was
bubbled through each sample for 2 min, using Pasteur
micropipettes, and then the test tubes were hermetically
sealed with rubber stoppers and refrigerated.
Gelled samples were equilibrated at room temperature
(21°C) and irradiated to different doses with 250-kV x-rays
filtered through 2 mm Al and with a dose rate of 3.5 Gy
min
1
. The doses to the gel were assumed to be equal to
those measured in the Fricke solution, irradiated to graded
doses in identical test tubes. The gel proton NMR trans-
verse relaxation rates (R
2
1/T
2
) were measured 1 day
following the irradiation using an IBM Minispec NMR
pulsed spectrometer operating at 20 MHz. A multiecho
Carr-Purcell-Meiboom-Gill (CPMG) pulse sequence was
employed, with pulse spacing
1 ms and with each
eighth echo sampled. The amplitude of the last echo was
always less than one-fifth of the first. The temperature of
the samples was varied from 5°C to 40°C using an auto-
mated water heater-circulator.
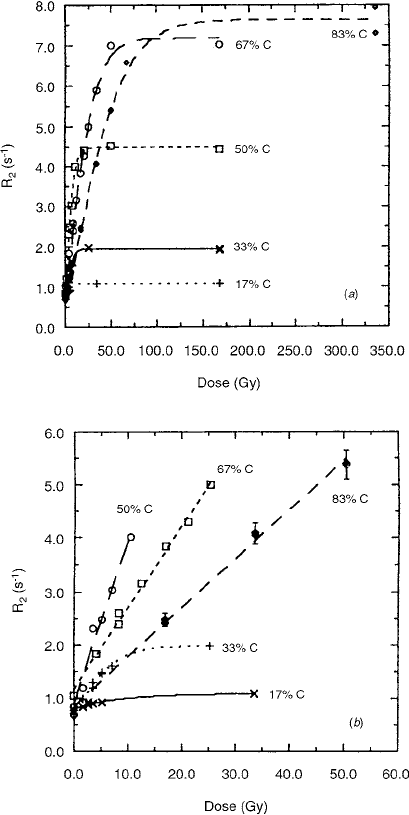
Figure 9.2la shows dose-response curves obtained
from NMR measurements performed at 20°C on gels of
varying %C. Figure 9.21b shows the lower-dose region
for the same set of data. It is evident from these data that
the amount of cross-linker in the monomer mixture sig-
nificantly affects the
R
2
sensitivity (defined as the initial
R
2
increment per unit dose) and the dynamic range over
which changes in R
2
reflect variations in dose.
Figure 9.22a illustrates the dependence of the R
2
sen-
sitivity on crosslinker content for three different temper-
atures at which R
2
was measured. It can be seen that the
sensitivity peaks at about 50%C and increases with
decreasing temperature for any %C.
Figure 9.22b shows the dependence of the dose sen-
sitivity on the temperature of NMR measurement for sev-
eral different weight fractions of the cross-linker (%C). It
is worth noting that this dependence is most pronounced
for the same cross-linker fraction at which the sensitivity
is at its maximum (about 50%C).
FIGURE 9.21 (a) Dose-response curves obtained from R
2
, mea-
sured at 20°C in gels with different weight fractions of cross-
linker per total comonomer (%C). (b) Lower-dose region of the
data from (a). (From Reference [20]. With permission.)
Ch-09.fm Page 419 Friday, November 10, 2000 12:04 PM