Shani G. Radiation Dosimetry: Instrumentation and Methods
Подождите немного. Документ загружается.

390 Radiation Dosimetry: Instrumentation and Methods
Detectors with two different resistivities were designed.
Type 1 had a resistivity of 10 cm, and detectors of type
2 had a resistivity of 0.2 cm. The ionization volume was
about 0.3 mm
3
, with a front surface of about 4 mm
2
. The
detectors were encapsulated in a water-resistant epoxy resin
(Araldite D). During the measurements they were in the
short-circuit mode, connected to an integrating electrometer
with a very low and stable input offset voltage.
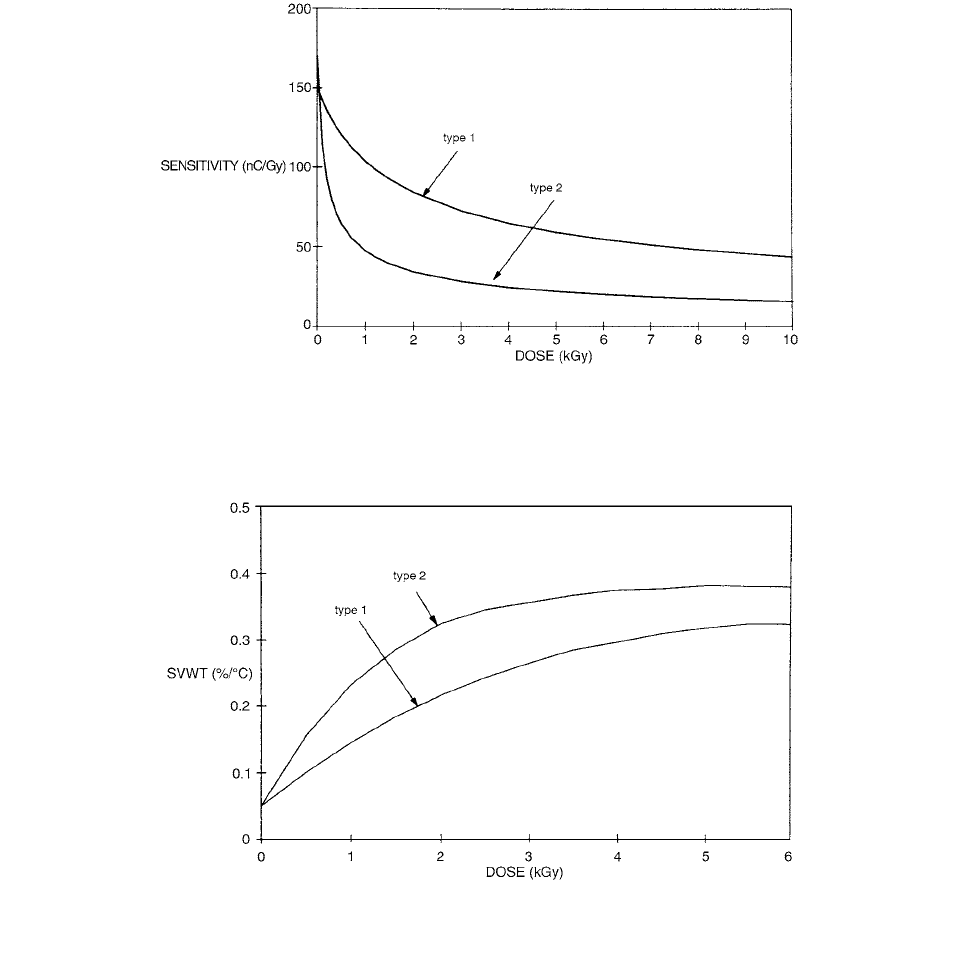
The reduction in sensitivity as a function of pre-
irradiation with 20-MeV electrons is shown in Figure 8.49
for the two detector types. As can be seen, the detectors
made on low-resistivity silicon (type 2) show a faster
decrease in sensitivity compared to the detectors of type 1.
Figure 8.50 shows the sensitivity variation with tem-
perature (SVWT) as a function of pre-irradiation dose with
20-MeV electrons for the two detectors. Detectors of type
2 showed a slightly faster variation with accumulated dose
than detectors of type 1. The saturation value of about
0.4% per C was, however, the same for the two types of
detectors.
The sensitivity of a cylindrical p-type silicon detector
was studied by Piermattei et al. [27] by means of air and
water measurements using different photon beams. A lead
filter cap around the diode was used to minimize the
dependence of the detector response as a function of the
brachytherapy photon energy.
FIGURE 8.49 The sensitivity as a function of accumulated dose of 20-MeV electrons for the two types of detectors. From Reference
[26]. With permission.)
FIGURE 8.50 The sensitivity variation with temperature (SVWT) as a function of accumulated dose of 20-MeV electrons for the
two types of detectors.
(From Reference [26]. With permission.)
Ch-08.fm Page 390 Friday, November 10, 2000 12:03 PM
Solid-State Dosimeters 391
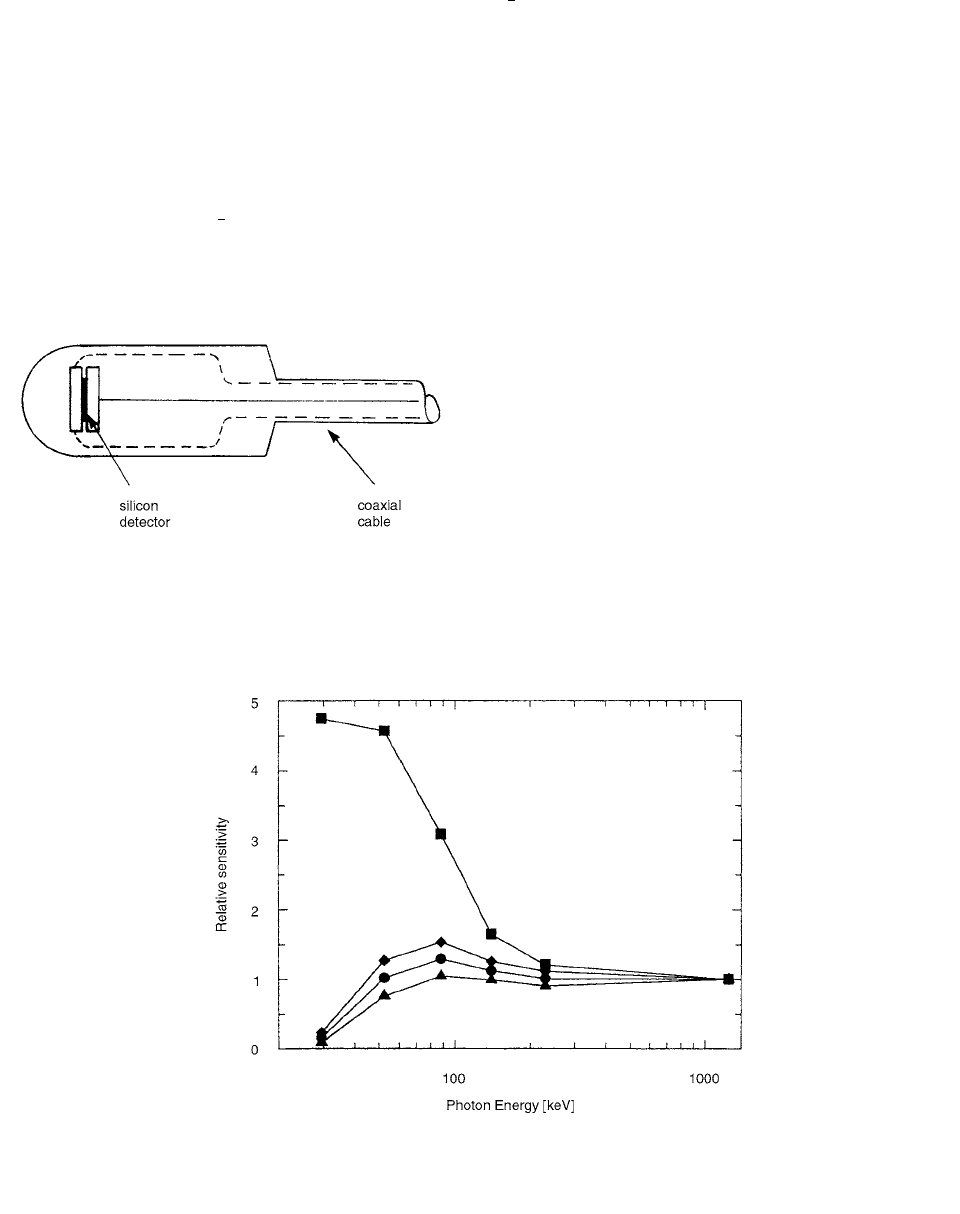
The silicon diode EDD-5, designed as a direct patient-
dose monitor for
60
Co irradiation, manufactured by Scan-
ditronix, is a p-type delector with a build-up of 5 mm for
60
Co
-ray beams. The geometrical features (10 mm in
length, 5 mm in diameter) are shown in Figure 8.51. The
cylindrical symmetry of the EDD-5 gives an angular
dependence 2%, while the sensitivity increases by 0.4%
per °C in the temperature range 20°C–40°C.
Figure 8.52 shows the sensitivity of the EDD-5 silicon
diode as a function of the photon beam energy normalized
to the value obtained for the
60
Co
-ray beam. The uncer-
tainty of the sensitivity values was estimated to be within
4% (2
).
A mean sensitivity, (r), of the unshielded and
shielded EDD-5 diode at distances r, between 1 and 10 cm,
from a point source in water, was calculated as the sum
of the diode sensitivities weighted by the absorbed dose
in water: [27]
(8.18)
where (E
i
,r) are at distance r from the source in water;
the relative photon fluences at energy E
i
, (
en
(E
i
)/
)
water,
are the mass energy absorption coefficients in water for
photon energy E
i
; and S(E
i
) are the diode sensitivities
given by the solid lines, shown in Figure 8.52, which
connect the experimental data.
IV. OTHER SOLID-STATE DOSIMETERS
VeriDose solid-state diode dosimeters are commercially
available solid-state diode dosimeters. [28] Their charac-
teristics are as follows:
• hemispherical shape improves isotropic response
and reduces angular and field-size dependencies
• waterproof design with appropriate build-up for
all clinical photon and electron energies
•flat bottom permits secure, easy placement on
the patient
• color-coded for ease of identification
• dose rate independent
• responds to photons and electrons
FIGURE 8.51 Scheme of the EDD-5 diode. The effective thick-
ness of the sensitive volume, approximately 60
m, is located
in a drop shape-encaptulation with outer dimensions 10 mm in
length and 5 mm in diameter.
(From Reference [27]. With per-
mission.)
S
Sr()
E
i
,r()E
i
en
E
i
()
------------------
water
i
SE
i
()
E
i
,r()E
i
en
E
i
()
------------------
water
i
FIGURE 8.52 Relative sensitivity of an EDD-5 diode, unshielded () and shielded, with a cylindrical closed-ended lead cap, 0.15
(
), 0.22 (), and 0.25 mm () thick, as a function of the photon energy. Data are normalized to the
60
Co
-ray beam. Continuous
lines connect experimental data. (From Reference [27]. With permission.)
Ch-08.fm Page 391 Friday, November 10, 2000 12:03 PM
392 Radiation Dosimetry: Instrumentation and Methods
• responds to dose rates of 1.0 cGy/min to 1000
cGy/min
•
60
Co x-ray beams, pulsed (linear-accelerator)
x-ray beams, and electron beams.
• optimized for use with all Nuclear Associates
patient dose monitors and high-quality medical-
grade ionization-chamber electrometers.
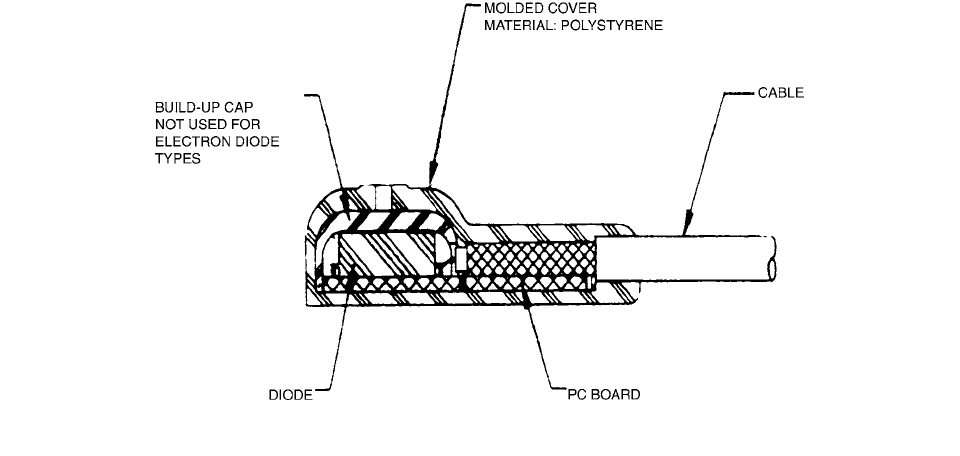
Nuclear Associates VeriDose diode detectors are solid-
state, silicon-based radiation detectors that utilize a
p-n
junction. These rugged diodes are encased within an FDA-
approved polystyrene material. A low-noise coaxial cable
is used to connect the diode to an electrometer. When
attached to an electrometer, these diodes provide enhanced
sensitivity and instantaneous response time.
VeriDose diodes are constructed using a “parallel-
plate” geometry with planar electrodes opposing each
other at a given spacing. They are platinum-doped n-type
diodes; their nominal sensitivity is 1.5 nC/cGy; and their
sensitivity volume is 0.25 mm
2
.
Figure 8.53 shows a cross
section of the diode assembly.
A high-precision patient dosimetry method has been
developed by Heukelom et al. [29], based on the use of
p-type diodes. Entrance as well as exit dose calibration
factors have to be determined under reference irradiation
conditions. A set of correction factors must be available.
The measurements were made using a set of seven
p-type diodes (type EDP-20, Therados). Each diode was
encapsulated by a hemispherical build-up cap of 2.2-mm
stainless steel and 2.8-mm epoxy, which together is equiv-
alent to approximately 2 cm water for 8-MV x-rays.
Dose calibration factors, and , defined as
D
ref
/R
ref
, were measured under reference conditions for
each diode. For each diode, the variation of the calibration
factors has therefore been investigated systematically as
a function of phantom thickness, field size at the isocenter,
SSD, the presence of wedges, and temperature. The influ-
ence of these variations in irradiation conditions on the
calibration factor can be expressed as a correction factor,
C
i
. The subscript i refers to the actual irradiation condition,
e.g., C
thickness
, C
field size
, C
SSD
, C
wedge
and C
temp
. The dose value
at the entrance or exit point, determined from the diode
reading, can be expressed as
(8.19)
in which the C
i
values are independent of each other.
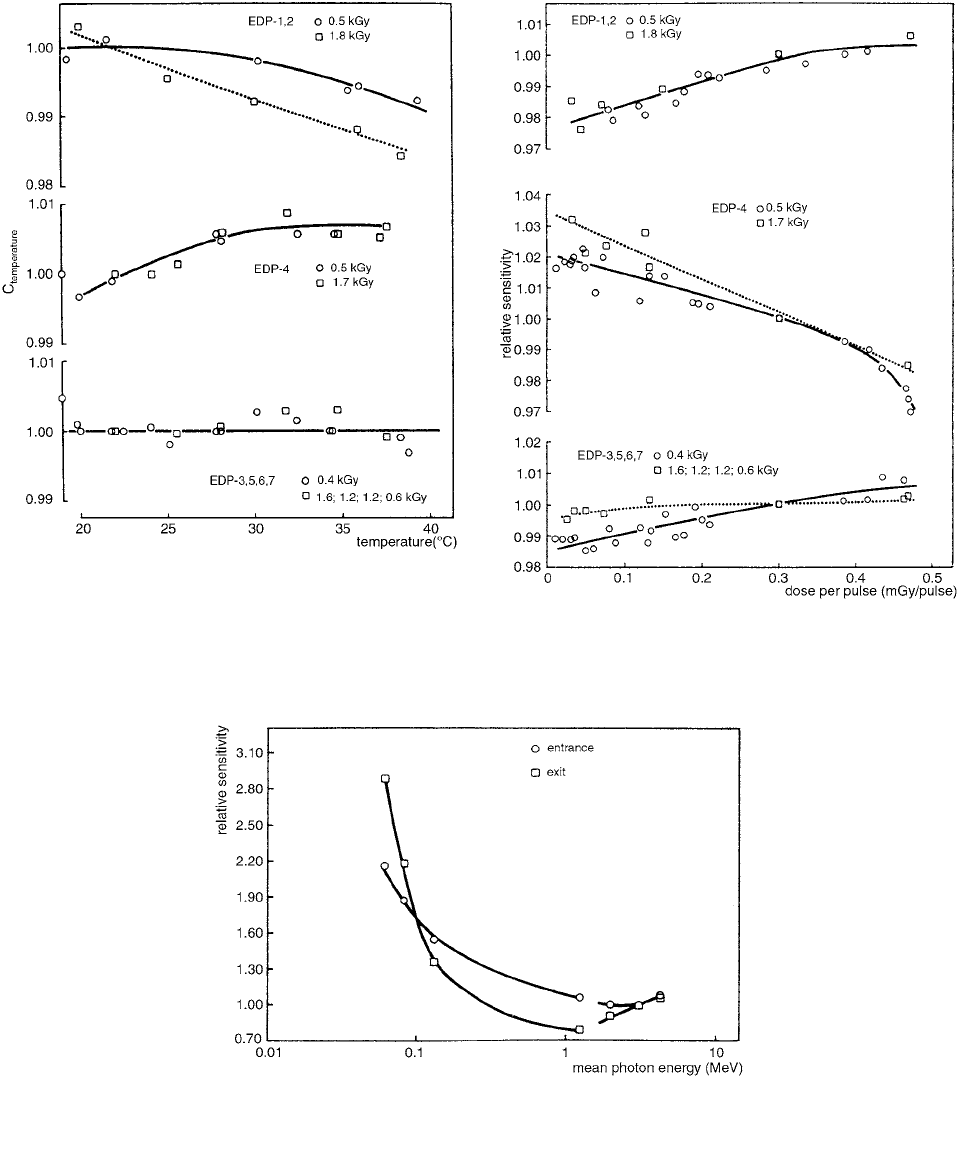
In Figure 8.54, C
temperature
is plotted against the temper-
ature of the water present in a Perspex container on which
the diodes were positioned. The temperature dependence
has been determined for two integrated dose values, repre-
senting the situation after about 0.5 year and 1.5 years of
clinical use. The variation in sensitivity of the diodes as a
function of the dose per pulse is indicated in Figure 8.55,
again for two integrated dose values.
The sensitivity of all diodes as a function of the mean
primary photon beam energy, normalized to the value for
the 8-MV photon beam, is indicated in Figure 8.56 for both
the entrance- and exit-side geometries. Mean photon ener-
gies were derived from mass attenuation coefficients.
These were obtained for the low-energy photon beams
from half-value layers measured in copper. For the mega-
voltage photon beams, mass attenuation coefficients were
estimated from percentage depth-dose values for a small
field size.
The energy dependence of the response of silicon
detectors was determined first by the increase in cross
section of the photoelectric effect in silicon relative to
FIGURE 8.53 Cross section of a VeriDose diode detector. (From Reference [27]. With permission.)
N
D
entrance
N
D
exit
D
diode
R
diode
N
D
C
i
i
Ch-08.fm Page 392 Friday, November 10, 2000 12:03 PM
Solid-State Dosimeters 393
water for decreasing photon energy and to pair production
for high energies.
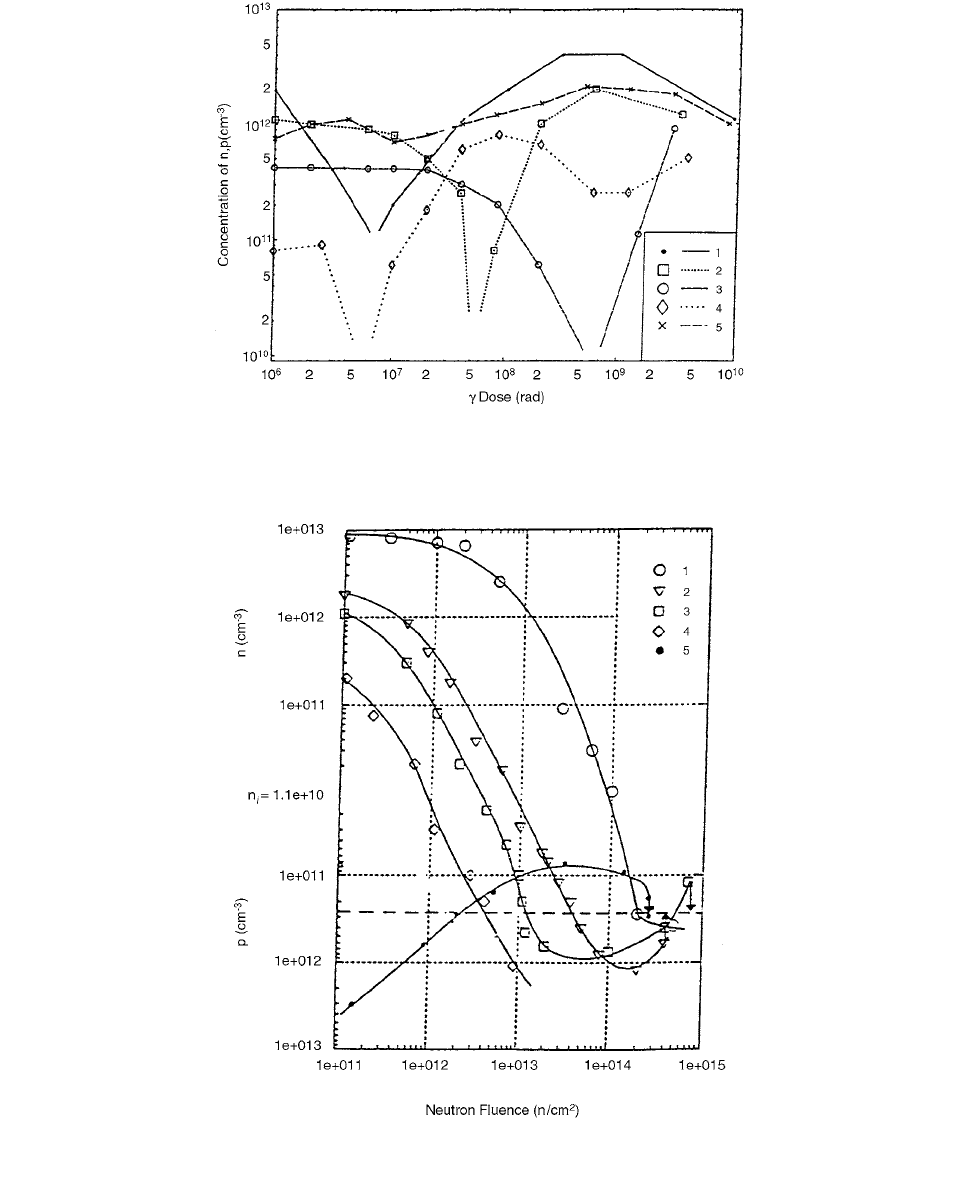
A variety of high-purity silicon grown on the basis of
different manufacturing technologies by Khivrich et al.
[30] was exposed to gamma irradiation (up to a dose of
10
8
rad(Si)) and to neutron irradiation (up to a fluence
of 10
15
n/cm
2
). Observation was made of the conduction
type and carrier concentration as a function of dose.
The conversion point (n-Si to p-Si) of gamma-irradiated
silicon was found to vary over 2 orders of magnitude of
FIGURE 8.54 The correction factor C
temperature
plotted against
the temperature of water in a Perspex container on which the
diodes were positioned.
C
temperature
was determined for different
values of the total dose delivered to these diodes. (From Refer-
ence [29]. With permission.)
FIGURE 8.55 The relative sensitivity of the diodes as a function
of the dose per pulse for different values of the total dose delivered
to these diodes. (From Reference [29]. With permission.)
FIGURE 8.56 The relative sensitivity of the diodes plotted against the mean photon energy as determined at the entrance (O) and
exit (
) sides of the rod phantom. (From Reference [29]. With permission.)
Ch-08.fm Page 393 Friday, November 10, 2000 12:03 PM
394 Radiation Dosimetry: Instrumentation and Methods
gamma dose for different manufacturers of high-purity
silicon, independent of the initial carrier concentration.
A systematic study of the radiation hardness of high-
purity silicon allowed the development of silicon detec-
tors working under harsh radiation environments and
operating over a wide range of dose. High-purity silicon
PIN diodes were calibrated using an epithermal neutron
beam to determine whether response in terms of 1-MeV(Si)
FIGURE 8.57 Charge carrier concentration vs gamma dose (in air) for high purity-Si from different manufacturers with different
initial charge carrier concentrations in cm
3
n-Si: curve (1) 2.5 10
12
cm
3
(NTD), (2) 1.05 10
12
cm
3
(ZTMK), (3) 5 10
11
cm
3
(producer 2), (4) 6 10
10
cm
3
(producer 3); p-Si: (5) 6 10
11
cm
3
(ZTMK). (From Reference [30]. With permission.)
FIGURE 8.58 Charge carrier concentration in high-purity silicon with efferent initial resistivity in kcm vs. neutron fluence, n-Si:
curve (1) 0.39 k
cm, (2) 2.5 kcm, (3) 5 kcm, (4) 40 kcm; p-Si:( 5) 3.2 kcm. (From Reference [30]. With permission.)
Ch-08.fm Page 394 Friday, November 10, 2000 12:03 PM
Solid-State Dosimeters 395
neutrons was independent of the calibration spectrum
used.
Figure 8.57 shows the change of charge carrier con-
centration (electrons or holes) and the conductivity type
vs. gamma dose in air from a
60
Co source. All of the high
purity n-Si samples investigated showed conversion to
p-type. However, there does not exist for these particular
samples a correlation between the conversion dose and the
initial charge carrier concentration, as is the case for silicon
manufactured using the same technological process but
with different initial concentrations of charge carriers.The
conversion dose for n-Si with
~ 20 kcm of producer 3
is two orders of magnitude less than for n-Si with
~ 9 kcm
of producer 2; see Figure 8.57 curves 3, 4.
The hole concentration in high-purity p-type silicon
does not change significantly (Figure 8.57, curve 5). This
corresponds to the small contribution of boron to the cre-
ation of stable radiation defects.
High-purity n- and p-type silicon was investigated
under fast neutron irradiation. Behavior similar to high-
purity silicon under gamma irradiation was observed; n-Si
converted to p-Si (Figure 8.58, curves 1–4), with a flat-
tening-off of the hole concentration of the order of 10
12
cm
3
. In contrast to gamma irradiation, a strong correla-
tion between the initial resistivity of n-Si and the neutron
fluence required for conversion of n- to p- type has been
observed. The p-type high resistivity Si has similar fast
neutron fluence dependence to n-Si after conversion to
p-type (Figure 8.58, curve 5).
Bellem et al. [31] described the method used to cali-
brate a large-volume continuous-wave x-ray radiation test
chamber. Three detector types—x-ray vacuum diodes
(XRD), silicon PIN diodes, and PMOS FETs—were used
to measure spectral intensity and dose deposition in silicon
devices.
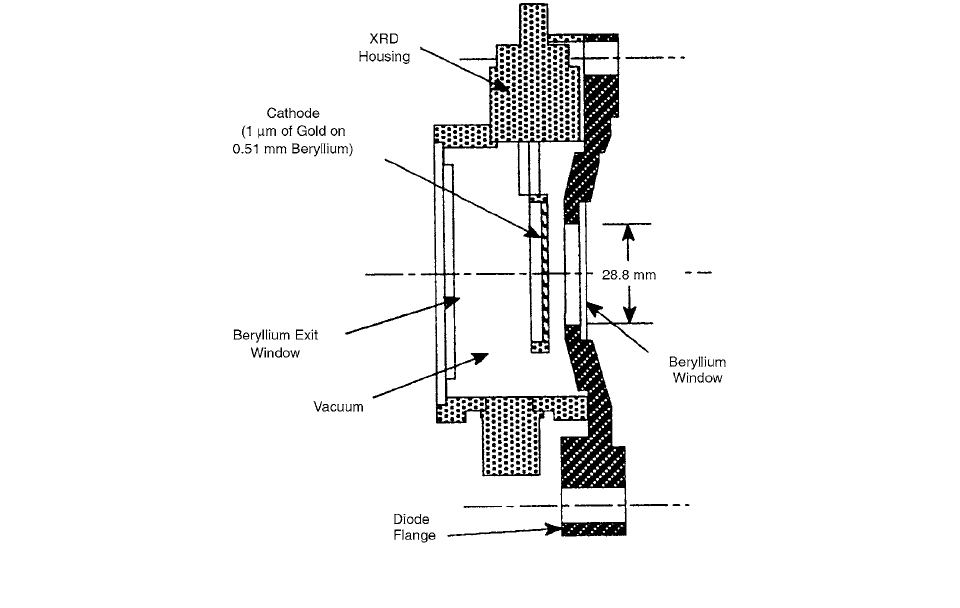
The x-ray vacuum diode, the Secondary Electrons Mixed
Radiation Dosimeter or SEMIRAD (referred to as the
XRD), is an evacuated chamber constructed to collect
secondary electron emissions from a gold film cathode
within the chamber. The XRD is ideally suited to measure
a constant high-intensity x-ray beam with radiation inten-
sities at energies up to 160. The XRD was used to quantify
the incident spectrum. A cross-sectioned illustration of the
XRD is shown in Figure 8.59.
The PIN diodes (Quantrand 010PIN025) have a nom-
inal area of 10 mm
2
and an effective collection depth of
about 25
m. The diodes provide a direct readout of the
ionization-induced current, which is proportional to the
dose rate, and can accurately measure dose rates up to 200
krad(Si)/min.
The PMOS FETs used were manufactured by the
AT&T Allentown Microelectronics Facility. The devices
were fabricated using polysilicon gate SiO
2
:Si structures
with a hardened gate oxide under 20 nm thick. A test strip
FIGURE 8.59 SEMIRAD x-ray diode illustration. (From Reference [31]. With permission.)
Ch-08.fm Page 395 Friday, November 10, 2000 12:03 PM
396 Radiation Dosimetry: Instrumentation and Methods
containing a variety of gate lengths and widths was avail-
able on-chip. Four transistors were selected with a gate
width of 30
m and gate lengths of 1.50, 1.75, 2.00, and
5.00
m.
The device response was then calculated by integrat-
ing a calculated or measured incident spectrum with the
experimentally measured detector sensitivity. A computer
program was written to integrate the product of these two
quantities; that is,
(8.20)
where
i
d
diode current (
A)
Espectral energy distribution end point energy
(keV)
A
a
aperture area (cm
2
)
S(E) diode sensitivity data
(E) incident spectral energy distribution
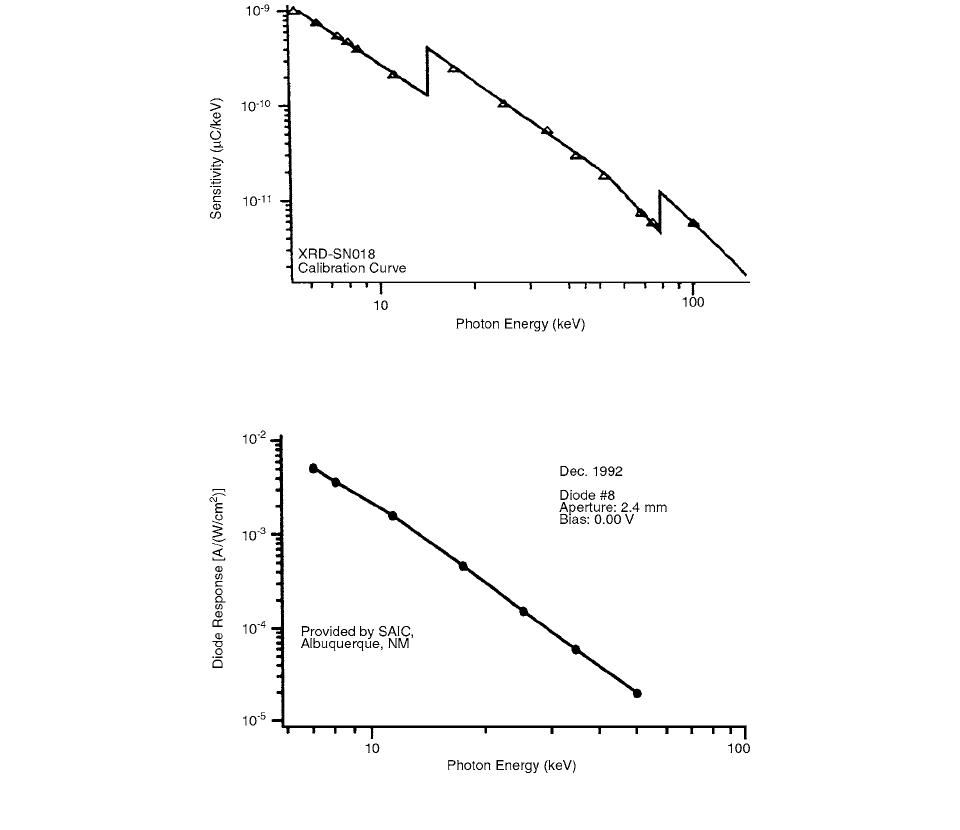
The XRD was calibrated from 5.41 keV (K-line for
Cr) up to 101 keV (K-line for V) by measuring the current
response. A plot of the sensitivity data obtained for the
XRD calibration is shown in Figure 8.60. The calibration
errors are estimated at less than 5% over the energy range
from 5 keV to 140 keV, with the errors increasing to about
10% as the energy approaches 160 keV. Below 5 keV,
errors are introduced in the sensitivity due to the M-lines
of Au; however, this energy will have no effect in our
calculations since the photons with energy below 5 keV
are absorbed by the intervening air.
The PIN diode was calibrated at the SAIC/DNA facilities
from 6.40 keV (the K-line for Fe) to 52 keV (the K-line
FIGURE 8.60 SEMIRAD x-ray diode (XRD-SN018) sensitivity vs. photon energy. (From Reference [31]. With permission.)
FIGURE 8.61 ARACOR PIN diode (CS 1003) sensitivity vs. Photon Energy. (From Reference [31]. With permission.)
i
d
A
a
E()SE() Ed
0
E
C
kev
---------
keV
keV cm
2
s
--------------------------------------
Ch-08.fm Page 396 Friday, November 10, 2000 12:03 PM
Solid-State Dosimeters 397
for Yb). The PIN diode response is shown in Figure 8.61.
This diode was found to be an accurate dosimeter for
measuring dose rate in silicon. Due to the potential for
PIN degradation due to oxide charge build-up from leak-
age by the collimator shield, the PIN is limited to spectral
energies less than 50 keV. In theory, however, the PIN
diode responds to all incident radiation. Therefore, to
determine dose rates for endpoint energies above 50 keV,
a method which combines measured and calculated results
was used.
The rate that energy is absorbed by a material (i.e.,
the dose rate) is given by: [31]
(8.21)
where
dose rate for a spectral energy distribution
with end-point energy E
K unit conversion factor
Eendpoint energy
(E) spectral energy distribution with endpoint
energy E.
a
(E) energy-dependent mass absorption coeffi-
cient.
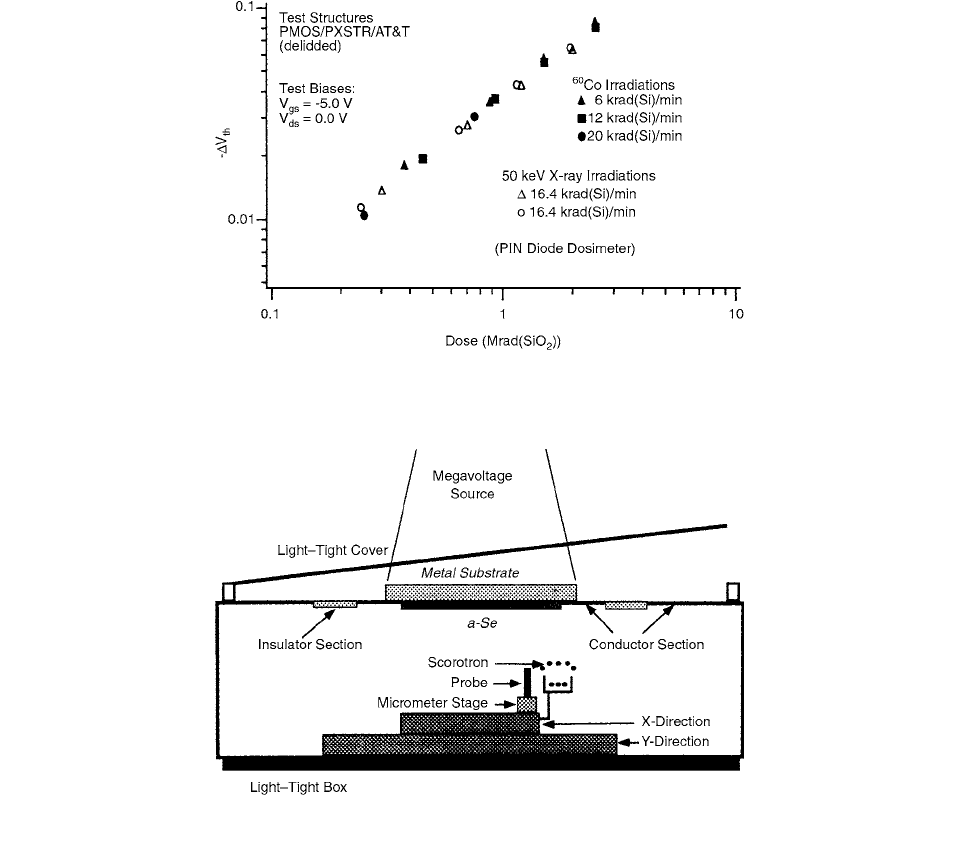
An overlay comparison of x-ray data is shown in
Figure 8.62. The maximum variation between data points
in Figure 8.62 is less than 10%. For example, the slope
of the 50-keV x-ray data is 31.5 mV/Mrad, while the slope
of the 6-krad/min
60
Co data is 32.2 mV/Mrad. This cor-
relation is excellent for these types of measurements over
the broad range of photon energies being considered. [31]
A feasibility study has been performed by Falco et al.
[32] on metal/amorphous selenium detectors for mega-
voltage portal imaging. The metal plates of the detectors
were positioned facing the incident 6-MV and
60
Co pho-
ton spectra. The detectors consisted of various thicknesses
˙
FIGURE 8.62 Threshold voltage shift of PMOS FETs with x-Ray and
60
Co data overlaid. (From Reference [31]. With permission.)
FIGURE 8.63 Schematics of the detector and read-out unit (From Reference [32]. With permission.)
D
˙
E
K
E
E()
a
E() Ed
0
E
D
˙
E
E
Ch-08.fm Page 397 Friday, November 10, 2000 12:03 PM

398 Radiation Dosimetry: Instrumentation and Methods
(0.15 mm, 0.30 mm, and 0.50 mm) of amorphous sele-
nium (a-Se) deposited on metal plates of varying thick-
nesses: aluminum (2.0 mm), copper (1.0 mm and 1.5 mm),
stainless steel (0.9 mm), or glass (1.1 mm). The detectors
were charged prior to irradiation by corona methods, and
the portal images were subsequently digitized after irradi-
ation with a noncontact electrostatic probe. The sensitivity
of the detectors to dose, electric field across the a-Se layer,
metal plate type, and a-Se thickness was studied. An
increase in electric field increases the sensitivity (gradient
of the a-Se surface voltage vs. dose curve) and dynamic
range of the resultant image. However, increase in a-Se
thickness, although also increasing the sensitivity, decreases
the dynamic range.
A layer of a-Se is deposited on a metal (conductor)
substrate or plate. The formation of a latent electrostatic
image on an a-Se photoconductor surface takes two steps:
(1) the
a-Se is charged (e.g., corona charging) in the dark
to achieve a uniform charge distribution on its surface;
and (2) a patient-modulated photon beam forms a latent
image by the local centralization of the uniform charge
distribution. The extent of this local neutralization is pro-
portional to the number of electron-hole pairs produced
by the irradiation per unit volume of the a-Se layer.
Therefore, the varying intensity across the radiation
beam exiting the patient will result in a corresponding
charge-distribution pattern on the a-Se surface. In com-
plete darkness, the a-Se layer is a charge capacitor, and a
uniform charge distribution
on the a-Se surface will
result in a potential difference V across the layer:
(8.22)
where
d is the thickness of the a-Se layer and
is the
permittivity of a-Se. X-ray irradiation on the detector will
create electron-hole pairs within the a-Se and these charges
will drift under the influence of the electric field (E V/d)
toward opposite surfaces to neutralize the initial charge
on the a-Se surfaces. The decrease of surface charge
is proportional to the radiation dose
D and inversely
proportional to the average energy W
required to generate
and collect one electron-hole pair in a-Se:
(8.23)
With some mathematical manipulation, the voltage differ-
ence between the a-Se layer and the metal substrate as a
function of radiation dose is: [32]
(8.24)
where
((Coulomb/cGy)(volt)
2/3
/(m)
4/3
) is a proportional
constant characterizing the photoconductor’s sensitivity to
megavoltage photons. It is defined as the sensitivity param-
eter. V
0
is the initial voltage potential difference on the metal
a-Se detector before irradiation and equals ( V
grid
|V
bias
|),
where V
grid
is the potential on the a-Se surface deposited
by corona charging and |V
bias
| is the absolute value of the
negative bias voltage applied to the metal plate. The volt-
age V(D) drops to V
bias
(i.e., total discharge) at dose
(8.25)
which thus defines the dynamic range. Substituting Equa-
tion (8.25) into Equation (8.24), we obtain
(8.26)
The sensitivity can be determined from the steepness of
the slope of the discharging curve:
(8.27)
which becomes less steep as the radiation dose increases.
The dynamic range and the sensitivity depend on
, d,
and V
o
, and are investigated by measuring the discharging
curve of the a-Se layer by megavoltage irradiation.
The detector and read-out unit shown in Figure 8.63
are a self-contained system within a light-tight box which
consists of the metal/a-Se detector and a 2D scanning
mechanism. The scanning mechanism has attached to
itself a scorotron and a noncontact electrostatic probe.
The 2D scanning mechanism allows 1D scanning of the
scorotron for corona charging of the a-Se surface prior
to irradiation and 2D scanning of the probe in a raster
fashion for read-out of the a-Se surface immediately after
irradiation. Two-dimensional scanning, precise to 2-
m
increments, is provided by a two-dimensional servomotor-
operated motion stage. The stage rests below the metal/a-Se
detector and faces the a-Se layer. A commercial package
on a 486 PC controls the motion of the 2D stage and the
acquisition of data from the probe. Communication of
control and data is provided through a GPIB line from the
PC located outside the room to the self-contained system
which always remains inside the room.
The detector composed of the glass substrate has one
side of the glass covered with a-Se and the other side cov-
ered with a 1-
m-thick layer of an indium-tin-oxide con-
ductor. The physical densities of glass, Al, Se, SS, and Cu
are 2.2 g/cm
3
, 2.7 g/cm
3
, 4.3 g/cm
3
, 7.5 g/cm
3
, and 8.9 g/cm
3
,
respectively. [32]
V
d
-------
D
W
--------
VD() V
0
1
d
13
V
o
13
-------------
D
3
V
bias
D
m
---
V
0
d
------
13
VD() V
0
1
D
D
m
-------
3
V
bias
Vd
Dd
-------
3
d
13
V
0
23
--------------------------
1
D
D
m
-------
2
Ch-08.fm Page 398 Friday, November 10, 2000 12:03 PM
Solid-State Dosimeters 399
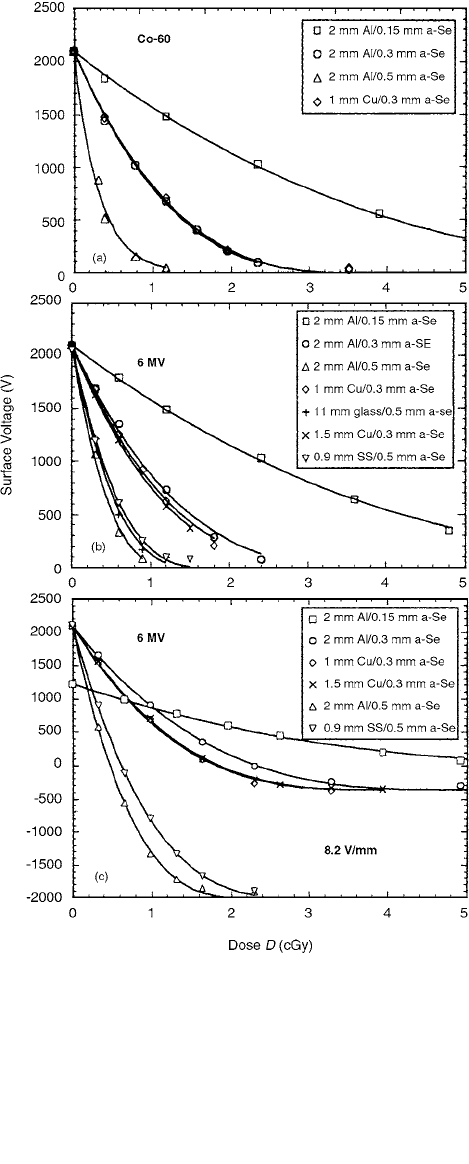
Figure 8.64a shows the sensitivity curves for four detec-
tors (0.5 mm, 0.3 mm, 0.15 mm a-Se on 2-mm Al, and
0.3 mm a-Se on 1-mm Cu) irradiated with the
60
Co spec-
trum. The uncertainties of all the values in Figure 8.64a are
less than 0.9%; thus, the error bars are too small to be
shown.
There is no significant difference between the sensi-
tivity curves of the detectors with Al (0.54 g/cm
2
) or Cu
(0.89 g/cm
2
) metal plates and which have the same a-Se
thicknesses. The relative
values were calculated by the
Monte Carlo method. The D
m
values produced the best fit
of Equation (8.26) to the data in Figure 8.64a. The corre-
sponding correlation coefficients R are at least 0.999 for
all fittings. Once D
m
is obtained, the parameter a is then
calculated from Equation (8.25).
Detector sensitivity was also measured for the 6-MV
spectrum. In Figure 8.64b, the discharge curves for seven
detector types are shown. The uncertainties of all the
values in the figure are less than 1.2%.
The sensitivity curve of the metal/a-Se detectors was
measured with constant electric field, and results are shown
in Figure 8.64c. The largest values for
V
grid
and |V
bias
| used
in our experiments were 2100 V and 2000 V, respectively.
Since the resultant electric field (E) across the largest a-Se
thickness (0.50 mm) was 8.2 V/
m, this constant value
of E was used for all studies. For the a-Se thicknesses less
than 0.50 mm, smaller values of V
grid
and V
bias
were
required to achieve the same E. Thus, potentials V
0
of 1230
V, 2460 V, and 4100V were placed on detectors with a-Se
layer thicknesses of 0.15 mm, 0.30 mm, and 0.50 mm,
respectively. [32]
REFERENCES
1. Vatnitsky, S. and Jarvinen, H., Phys. Med. Biol., 38,
173, 1993.
2.
Hoban, P. W. et al., Phys. Med. Biol., 39, 1219, 1994.
3.
Rikner, G., Acta Radiologica Oncol., 24, 71, 1985.
4.
Seuntjens, J. et al., in AAPM Proc. No. 11, Kilovolt
X-Ray Beam Dosimetry for Radiotherapy and Radiobiol-
ogy,
1997, 227.
5.
Heydarian, M. et al., Phys. Med. Biol., 38, 1035, 1993.
6.
PTW-Freiburg Ionization Chamber Catalog, 1999.
7.
Vatnitsky, S. et al., Med. Phys., 22, 469, 1995.
8.
Rustgi, S. N., Med. Phys., 22, 567, 1995.
9.
Laub, W. U. et al., Med. Phys., 24, 535, 1997.
10.
Rustgi, S. N., Phys. Med. Biol., 43, 2085, 1998.
11.
Mobit, P. N. and Sandison, G. A., Med. Phys., 26, 839,
1999.
12.
Gladstone, D. J. et al., Med. Phys., 21, 1721, 1994.
13.
Soubra, M. et al., Med. Phys., 21, 567, 1994.
14.
Butson, M. J. et al., Med. Phys., 23, 655, 1996.
15.
Rosenfeld, A. B. et al., IEEE Trans. Nucl. Sci., 42, 1870,
1995.
16.
Rosenfeld, A. B. et al., IEEE Trans. Nucl. Sci., 43, 2693,
1996.
17.
Korn, T. et al., Phys. Med. Biol., 43, 3235, 1998.
18.
Rosenfeld, A. B. et al., IEEE Trans. Nucl. Sci., 46, 1774,
1999.
FIGURE 8.64 Radiation discharge curves for different metal
plate/
a-Se detectors measured with the (a)
60
Co spectrum,
(b) 6-MV spectrum using
V
grid
2100 V and V
bias
0, and (c)
radiation discharge curves for detectors having the same electric
field
E 8.2 V/
m across the a-Se layer. The same E was
obtained by applying
V
0
1230 V, 2460V, and 4100V for the
detectors with
a-Se layer thicknesses of 0.15 mm, 0.30 mm, and
0.50 mm, respectively.(From Reference [32]. With permission.)
Ch-08.fm Page 399 Friday, November 10, 2000 12:03 PM