Shani G. Radiation Dosimetry: Instrumentation and Methods
Подождите немного. Документ загружается.

310
Radiation Dosimetry: Instrumentation and Methods
III. RADIOCHROMIC FILM DOSIMETRY
The introduction of radiochromic dye-cyanide films has
resolved some of the problems experienced with conven-
tional radiation dosimeters. The high spatial resolution
and low spectral sensitivity of radiochromic films make
the dosimeter ideal for the measurement of dose distri-
butions in regions of high dose gradient in radiation fields.
The three radiochromic films most commonly used in
medical applications have Been GafChromic MD-55
(Nuclear Associates Model No. 37-041), GafChromic
HD-810 (Nuclear Associates Model 37-040), and
GafChromic DM-1260. The MD-55 films are available
in clear sheets and are suitable for dose mea-
surements in the range of 10–100 Gy. Model HD-810
films were available until recently in sheets and
were used for measurements of absorbed dose in the
range of 50–2500 Gy. Model DM-1260 films were avail-
able in rolls and also were used for dose mapping
in the range of 50–2500 Gy.
Radiochromic film has significant advantages over
silver halide film: it has a relatively flat energy response;
it is self-developing so it eliminates variations introduced
by the processing step; it is insensitive to visible light,
allowing for ease of handling; and the film is fabricated
from low-atomic-number materials, so it does not perturb
the radiation beam to the same degree as silver halide film.
The response of the film has been shown to be independent
of dose rate. The uniformity of the film means that no
background measurements need to be taken prior to irra-
diation. The film is sensitive to ultraviolet light with
photon energies greater than 4 eV. [7]
Unexposed radiochromic film is transparent with a light
blue hue, while film which has been exposed to ionizing
radiation is dark blue. The blue coloration means that the
broadband light source of a conventional densitometer is
attenuated only in the red part of the spectrum. This leads
to an overall reduction in the light intensity which is quite
small and, thus, the resulting measurements have a low
signal-to-noise ratio. Densitometers employing a He-Ne
laser, which emits light at 633 nm, close to the peak of
about 660 nm in the absorption spectrum of the film, have
been used. This improved the sensitivity and the linearity
of the dose response. These densitometers can make mea-
surements with resolutions up to 0.3
m. [7]
The images produced by the scanner were loaded into
the software package MATLAB (The Mathworks, Inc.,
version 4.2c). This allowed for the representation of the
image as a matrix which may be manipulated for the
purposes of image enhancement, enlargement, and map-
ping of isodoses or depth doses.
A calibration to convert from raw scanner signal to
dose was achieved by placing 12-mm
30-mm pieces of
film on the surface of a 10-cm-thick Perspex phantom of
dimensions 20 cm x 20 cm and irradiating them to doses
in the range 0–95 Gy.
The net optical density,
OD
, of a point on the film is
given by the equation
(5.5)
where
S
0
is the “dark current,” i.e., the scanner signal for
an unexposed film, and
S
is the scanner signal for the film
at the point of interest. The optical density depends on the
dose
D
in the following way:
(5.6)
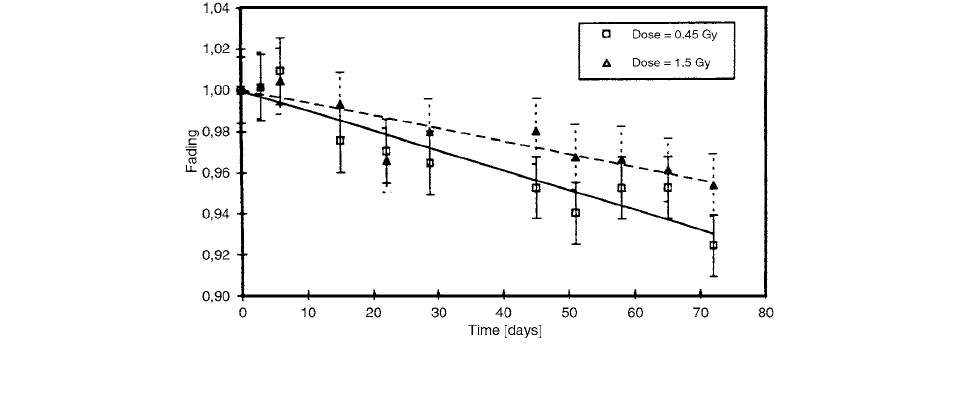
FIGURE 5.13
Decay with time of optical density (fading) of Kodak X-omat V films irradiated with 0.45 Gy or 1.5 Gy. The error
bars represent one standard deviation of total uncertainty. (From Reference [6]. With permission).
5 5
8 10
5 5
OD log
10
S
0
S
-----
log
10
S
0
S
-----
aD
Ch-05.fm Page 310 Friday, November 10, 2000 12:01 PM
Film Dosimetry
311
where
a
and
are constants. These constants are deter-
mined by taking the log of Equation (5.6), resulting in
(5.7)
A plot of ln against ln(
D
) produces a
straight line with slope
, intercept ln(
), and linear
regression coefficient
r
0.999. A least-squares linear fit
to the calibration data yields the constants
0.719 and
0.0180. Equation (5.6) is solved for dose and
becomes, after substitution of the constants,
(5.8)
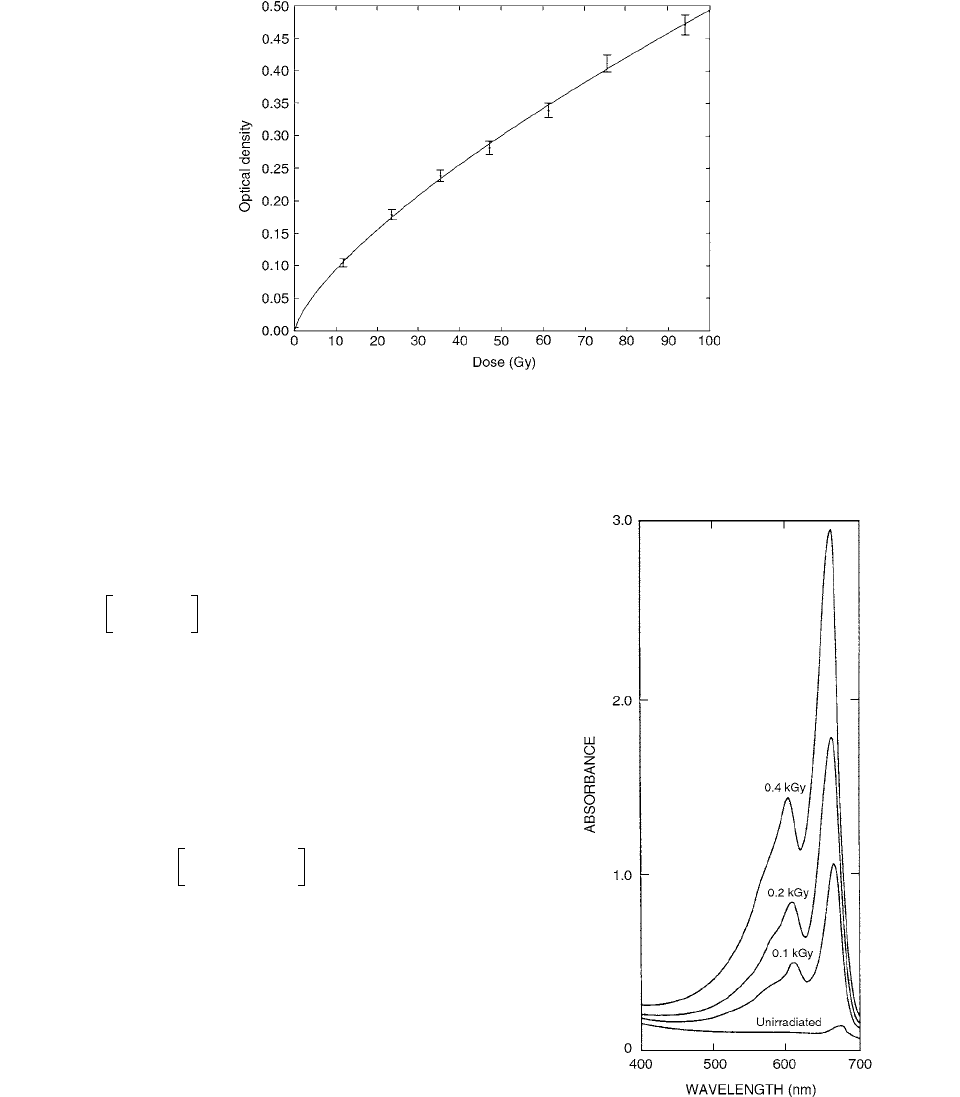
The dependence of optical density on dose is shown in
Figure 5.14, with Equation (5.6) represented by the solid
line. It was shown that the optical density can change by
16% in the 24 h immediately after irradiation, but in the
following 24 h the color change is less than 1%. [7]
GafChromic™ Dosimetry Media offers advances in
high-dose radiation dosimetry and high-resolution radio-
graphy for gamma radiation and electrons. [8] The film
consists of either small 1.2-cm
6-cm strips as individual
dosimeters or, for the purpose of large-scale imaging,
0.13-m
l5-m rolls of coated polyester film, or other
sizes up to a meter wide and 50 m long. “The sensitive
coating is a proprietary sensor layer thick, and
the base is a 100-
m-thick clear polyester film.” The film
is colorless and “grainless” in that its radiographic image
gives a spatial resolution of
1200 lines/mm. Typical radi-
ation-induced absorption spectra are shown in Figure 5.15.
Doses down to less than 1 Gy can readily be measured by
using a special form of the GafChromic™ Dosimetry
Media.
FIGURE 5.14
Curve showing the dependence of optical density on dose. The data points correspond to the optical density of films
uniformly irradiated to doses in the range 0–95 Gy, with 55-kV x-rays at the surface of a Perspex phantom. The error bars demonstrate
the level of uncertainty in the optical density, based on the uncertainty in measurements of scanner signal. The solid line shows how
the model represented by Equation (5.6) fits the experimental data. (From Reference [7]. With permission.)
ln log
10
S
0
S
-----
ln a() ln D()
[log
10
(
S
0
S
----
)]
D 5.56log
10
S
0
S
-----
1.39
6
m
FIGURE 5.15 Absorption spectra of GafChromic™ Dosimetry
Media, un-irradiated and irradiated to different doses. (From
Reference [8]. With permission.)
Ch-05.fm Page 311 Friday, November 10, 2000 12:01 PM
312 Radiation Dosimetry: Instrumentation and Methods
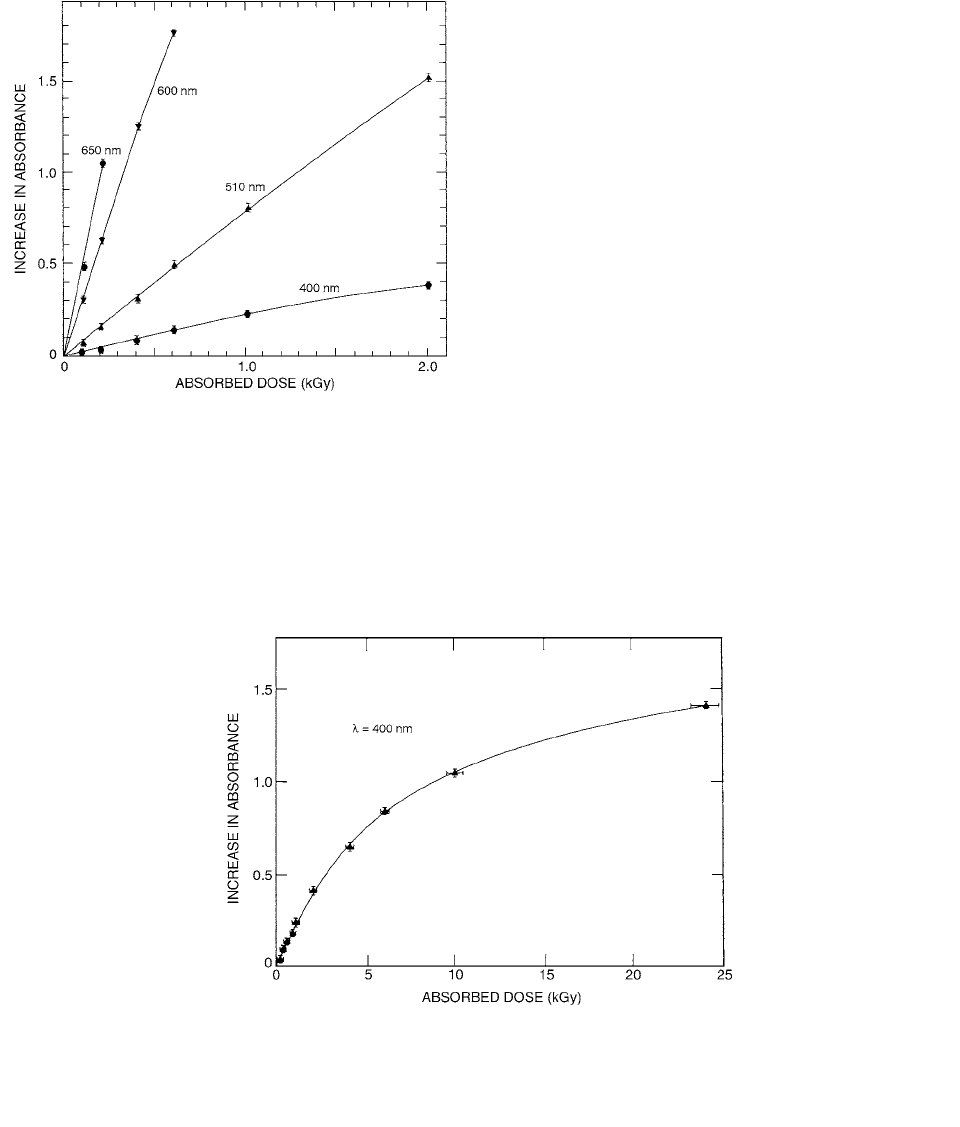
The increases in absorbance (A) at four wavelengths
are presented in Figure 5.16 as a function of the absorbed
dose in water. The four curves are approximately linear
functions within the dose range up to 0.5 kGy, but they
become nonlinear over the range from 0.5 to 25 kGy
(Figure 5.17; McLaughlin et al. [8]).
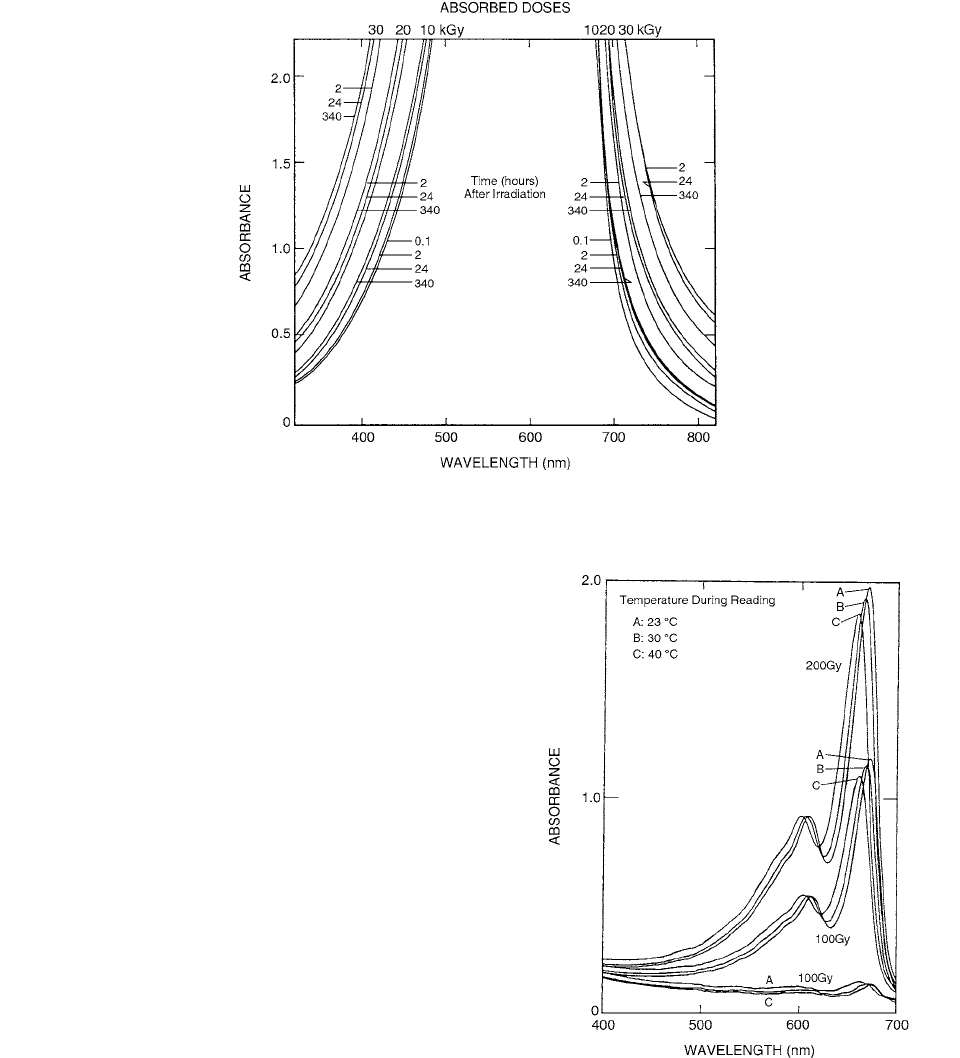
Figure 5.18 shows hypsochromic shift with storage time
for large doses, where measurements have to be made in the
near ultraviolet or near-infrared because of unmeasurably
high absorbance values in the visible spectrum. The readings
on the long wavelength side are more stable than those in
the blue and UV part of the spectrum. Long-term stability
of the readings of the films at all wavelengths after a one-
day initial storage period remains within 4%, when the stor-
age is under controlled laboratory conditions. This long-term
stability is observed at all doses from 10 to 1200 Gy.
Figure 5.19 reveals that there are slight shifts to shorter
wavelengths of the absorption band maxima as the
absorbed dose increases.
Vatnitsky et al. [9] have studied the feasibility of
radiochromic film for dosimetry verification of proton
Bragg peak stereotactic radiosurgery with multiple beams.
High-sensitivity MD-55 radiochromic film was calibrated
for proton beam irradiation, and the RIT 113 system was
employed for film evaluation.
In order to take into account geometry-related uncer-
tainties, the aperture of each proton beam should include
a margin around the target, and the bolus should be
“expanded” or “smeared.” The choice of margins and
bolus smear depends on the treatment technique and varies
from center to center.
High-sensitivity MD-55 film consists of a 30-
m
polymer sensor layer coated on a 100
m polyester base
and sandwiched between two plastic sheets. film
sheets were used and stored in black light-tight plastic
envelopes at controlled room temperature (22°C) and
humidity (50%). Unpacking, cutting the film to the desired
size, irradiation, and evaluation of the films were per-
formed under normal room light. Un-irradiated films were
FIGURE 5.16 Curves representing the response of GafChro-
mic™ Dosimetry Media to gamma radiation from a
60
Co
source, when the absorbance values are measured at the
indicated wavelengths with a spectrophotometer, as a func-
tion of the absorbed dose in water. The vertical bars on each
data point indicate the estimated limits of random uncertainty
at a 95% confidence level (2
). (From Reference [8]. with
permission.)
5 5
FIGURE 5.17 Response curve for gamma radiation doses up to 25 kGy, when measured with a spectrophotometer at 400-nm
wavelength. The vertical bars indicate the 2
(95% confidence level) uncertainty to the random values of net absorbance at each dose
(in water), and the horizontal bars give the corresponding 2
uncertainty limits of the absorbed dose readings. (From Reference [8].
With permision.)
Ch-05.fm Page 312 Friday, November 10, 2000 12:01 PM
Film Dosimetry 313
handled under the same conditions to control the back-
ground optical density. Evaluation of all films was per-
formed 24 h after irradiation.
Irradiated films were processed with the RIT 113 film
dosimetry system (RIT Inc., Denver, Colorado). The sys-
tem configuration includes a digitizer (Argus II) and soft-
ware for film analysis, which consists of an image-pro-
cessing platform and various application modules. The
Argus II digitizer uses a daylight fluorescent light lamp
and CCD (charge coupled device). The CCD’s linear sen-
sor has a maximum resolution of 600 horizontal 1200
vertical dpi (dots per inch). The RIT 113 system is typically
used in the following manner. First, calibration films exposed
to various doses are scanned in the film digitizer to convert
the film to a sequence of pixels whose values represent the
optical density at each point on the film. A calibration file is
generated to provide the system with the information nec-
essary to convert optical densities on the film to radiation
dose levels. Second, subsequent films are exposed to the
radiation beam, to qualify the radiation beam characteris-
tics. These films are then digitized and analyzed by the
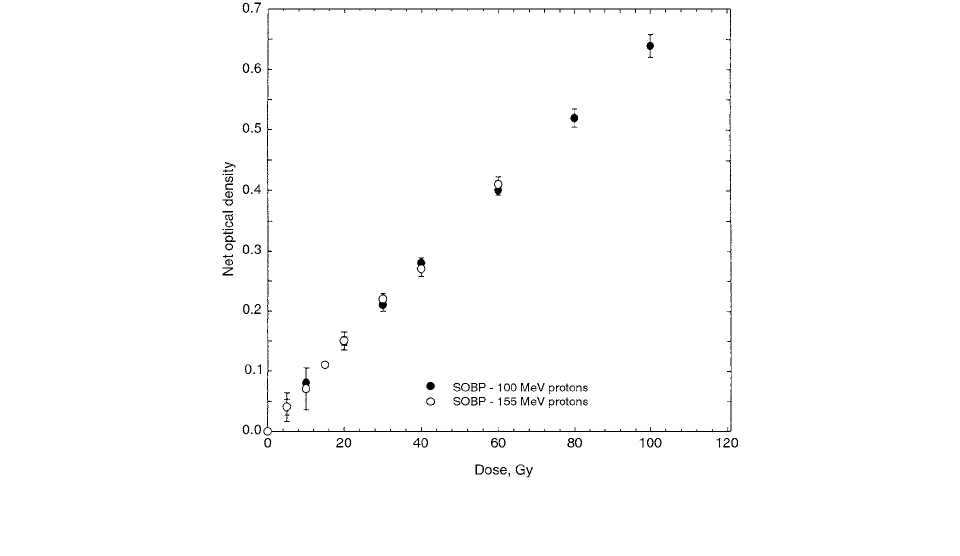
software. [9] Figure 5.20 shows the calibration dose
response of the MD-55 film to the irradiation at the center
of the spread-out Bragg peak (SOBP) for two beam ener-
gies as a function of the absorbed dose to water.
For the five-beam irradiation study, the detector block
with radiochromic films was installed in the water phan-
tom so that the intersections between the film planes and
CT planes were parallel to the vertical CT axis. Potential
errors associated with the angulation of the film were
minimized by cutting each film exactly to the shape of the
plastic spacer and aligning the detector block according
to labeled marks on the water phantom. The positioning
uncertainty of the isocenter projection on each film was
estimated to be less than 1 mm.
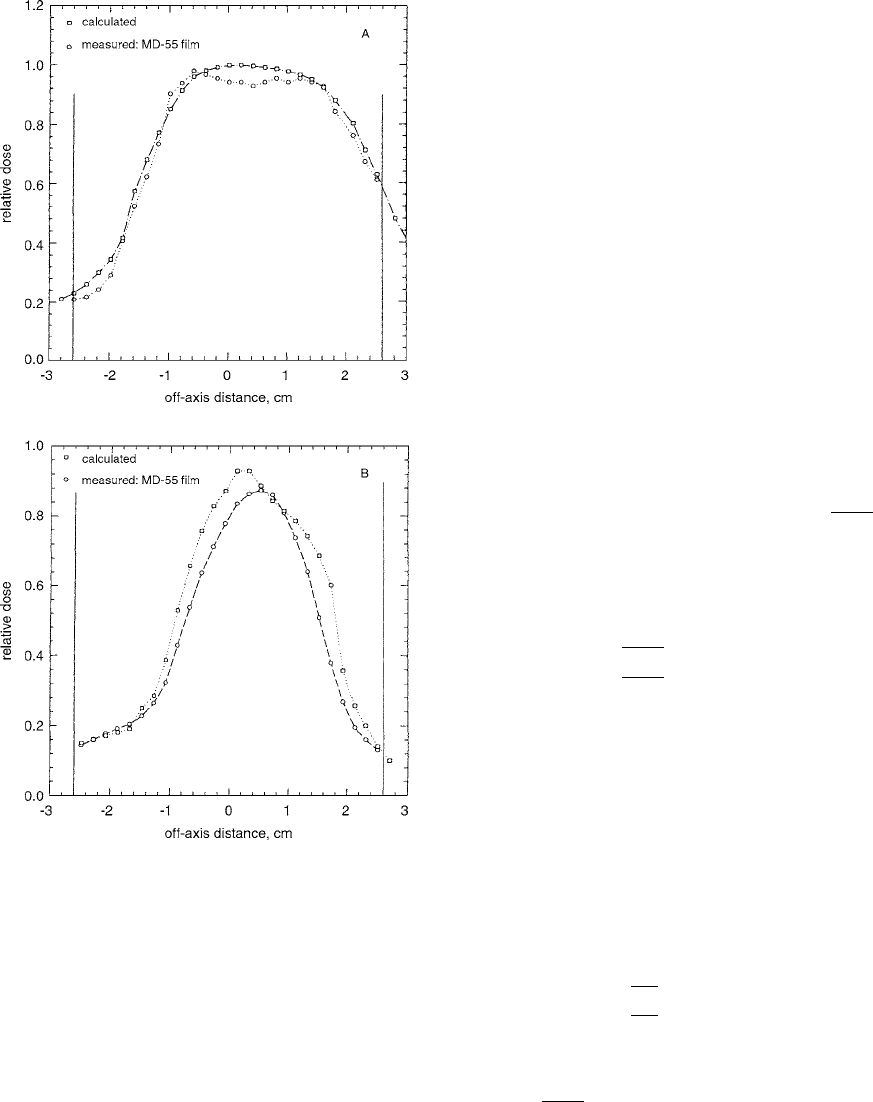
Figure 5.21 shows calculated and measured dose pro-
files for the five-beam composite plan in the isocenter
FIGURE 5.18 Changes in the absorption spectra of GafChromic
TM
Dosimetry Media exposed to high doses of gamma radiation 10,
20, and 30 kGy, and measured at different times after irradiation. (From Reference [8]. With permission.)
FIGURE 5.19 Absorption spectra of Gafchromic
TM
Dosimetry
Media, unirradiated and irradiated to the two indicated doses, at
indicated temperatures. (From Reference [8]. With permission.)
Ch-05.fm Page 313 Friday, November 10, 2000 12:01 PM
314 Radiation Dosimetry: Instrumentation and Methods
plane (A) and in the plane 3 cm superior to the isocenter
(B). The multiple-beam profiles were normalized to a dose
of 70 Gy. The comparison presented in Figure 5.21 dem-
onstrates that the treatment plan provided adequate target
coverage and that the dose delivered to the reference point
(center of the target at isocenter plane) was close to the
prescribed dose within accuracy of film dosimetry (
5%).
The absolute dose difference between calculated and mea-
sured dose values over the target irradiated with multiple
beams was also found to be within the uncertainty of the
radiochromic film dosimetry (5%, one standard devi-
ation) for the isocenter plane and off-center planes. The
observed difference between measured and calculated
profiles can be explained by the dependence of the radi-
ochromic film sensitivity at a very steep distal edge of
the Bragg peak.
Zhu et al. [10] have studied the uniformity, linearity,
and reproducibility of a commercially supplied radio-
chromic film (RCF) system (Model MD-55). Optical den-
sity (OD) distributions were measured by a helium-neon
scanning laser (633 nm) 2D densitometer and also with a
manual densitometer. All film strips showed 8–15% vari-
ations in OD values, independent of densitometry tech-
nique, which are evidently due to nonuniform dispersal of
the sensor medium. A double exposure technique was used
to solve this problem. The film is first exposed to a uniform
beam, which defines a pixel-by-pixel nonuniformity cor-
rection matrix. The film is then exposed to the unknown
dose distribution, rescanned, and the net OD at each pixel
corrected for nonuniformity. The double exposure tech-
nique reduces OD/unit dose variation to a 2–5% random
fluctuation. RCF response was found to deviate signifi-
cantly from linearity at low doses (40% change in net
OD/Gy from 1 to 30 Gy).
The film consisted of a thin, radiosensitive (7–23
m
thick) colorless leuco dye bonded to a 100-
m-thick
Mylar base. RCF films are colorless before irradiation and
turn a deep blue color upon irradiation without physical,
chemical, or thermal processing. RCF is approximately
tissue-equivalent, integrates simultaneously at all mea-
surement points, and has a high spatial resolution (
1200
lines/mm). It shows a stable, reproducible response if pro-
tected from UV light and unstable temperatures and
humidity. Since radiochromic dye is an aromatic hydro-
carbon, like plastic scintillator, its deviation from tissue-
equivalent energy response is much smaller compared to
silicon diode detectors and has the same magnitude (but
opposite direction) as that of TLD.
To suppress the effects of nonuniform RCF response,
a double-exposure densitometry technique was used.
Before use, each film was first given a uniform dose of
20 Gy or 40 Gy, and fiducial marks were placed on two
opposite corners of the film using a punch with a diameter
of 600
m. After a time interval ranging from 48 to 96 h
from irradiation, the film was then scanned and the result-
ant optical density distribution, OD
1
(i, j), was used to form
a pixel-by-pixel sensitivity correction matrix, f(i, j).
(5.9)
where
i, j are the X and Y position indices and
is the mean OD over the entire film. This pre-exposed film
FIGURE 5.20 Calibration response of MD-55 film to proton irradiation at the center of the SOBP. (From Reference [9]. With
permission.)
fij,()
OD
1
ij,()
OD
1
ij,()〈〉
----------------------------
OD
1
ij,()〈〉
Ch-05.fm Page 314 Friday, November 10, 2000 12:01 PM
Film Dosimetry 315
is then exposed to the unknown dose distribution, held for
an interval of 48–108 h, and scanned, yielding the cumu-
lative optical density distribution, OD
2
(i, j).The time inter-
val between the OD
1
scan and exposure to the unknown
radiation field was highly variable, ranging from a few
hours to several weeks. Both OD
1
and OD
2
images are then
transferred to the graphics workstation. There, a software
package displays the two images, allows corresponding
fiducial marks on the two films to be identified, correlates
the double- and single-exposed images pixel-by-pixel by
aligning the fiducial marks, and then calculates and dis-
plays the net optical density distribution, OD(i, j) cor-
rected for pixel-to-pixel sensitivity variations:
(5.10)
The corrected net optical density,
OD(i, j), is taken
to be the response of the detector to the unknown radiation
field. Pixel-by-pixel correction for nonuniformity of film
response was performed using the original OD matrix
consisting of 50-
m pixels. Films were always scanned
with the sensitive side of the RCF emulsion facing the
ceiling to prevent the two OD images from being
flipped.[10]
The response of RCF with respect to absorbed dose in
a 6-MV x-ray beam for both single- and double-exposure
techniques was studied by Zhu et al. using the same films
and OD distributions as were used for interfilm reproduc-
ibility analysis. For each of the dose groups, the mean of
the average optical
D density of each film was taken,
yielding the final mean optical density corre-
sponding to the net dose, D. The deviation of RCF
response from linearity was quantitated by means of a
relative linearity correction factor F
lin
, defined as
(5.11)
Zhu et al. chose the 30-Gy dose level for normalizing
F
lin
to unity because it represents the center of the dose
range typically used in their RCF dose measurements;
however, its choice is completely arbitrary and affects
neither the accuracy nor precision of subsequent dose
measurements. The linearity correction factor of RCF
response using the Macbeth manual densitometer was
defined as
(5.12)
where represents the single-exposure OD aver-
aged over manual readings measured over a 3 3-mm
grid from each film averaged over the four films in each
dose group with background density subtracted. For doses
over 20 Gy, the cumulative OD
2
densities were measured
and plotted as a function of D
2
.To measure the sensito-
metric curve at lower doses, a series of unexposed films
were irradiated to the desired doses and readout as
described above.
FIGURE 5.21 A comparison of measured and planned dose
profiles for five-beam irradiation. Vertical lines represent bound-
aries of a sliced polystyrene cylinder with films in the detector
block. (A), a comparison of measured and planned dose profiles
for five-beam irradiation, isocenter plane. (B), a comparison of
measured and planned dose profiles for five-beam irradiation,
CT plane, 3 cm superior to the isocenter. (From Reference [9].
With permission.)
OD i j,()
OD
2
ij,()OD
1
ij,()
fij,()
------------------------------------------------------
OD〈〉
F
tin
OD()
OD〈〉D[]
OD〈〉D[]
----------------------------------
At each dose level
At a reference of 30 Gy
F
lin
OD()
OD〈〉D[]
OD〈〉D[]
--------------------------
At each dose level
At a reference of 30 Gy
OD〈〉
Ch-05.fm Page 315 Friday, November 10, 2000 12:01 PM
316 Radiation Dosimetry: Instrumentation and Methods
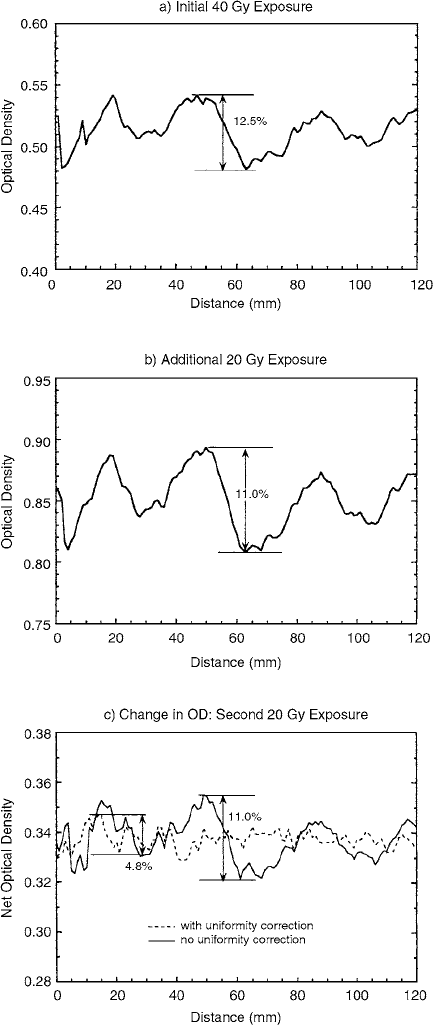
Figure 5.22 shows a typical OD profile through the
center of a 12-cm-long strip, illustrating the sinusoidal
behavior of its nonuniform response. The upper panel
shows the profile resulting from a uniform dose of 40 Gy,
while the center panel illustrates the effect of an additional
20-Gy exposure. This demonstrates that the nonuniformity
is a multiplicative phenomenon, independent of the dose
delivered. Finally, the lower panel of Figure 5.22 illus-
trates that nonuniform film response is dramatically
reduced by the double-exposure method. An 11% system-
atic variation of film response is reduced to a random OD
fluctuation, which is less than 5%.
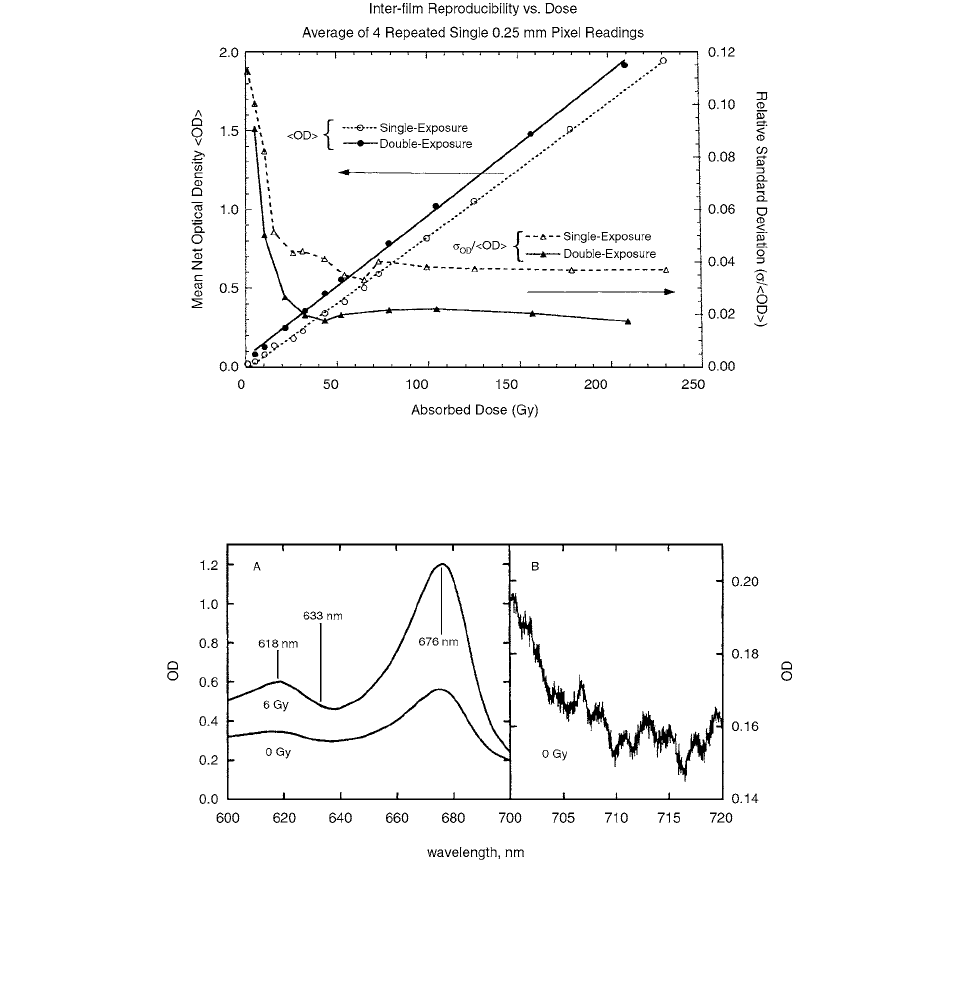
Figure 5.23 shows the results of interfilm reproduc-
ibility for both the single and double-exposure techniques.
For both techniques, the average OD in the central 5 5
block of 50-
m pixels was extracted from each film and
then averaged over the four films in each dose group for
doses ranging from 1 Gy 230 Gy. For the double-exposure
technique, an initial 20-Gy exposure was used to define
the relative pixel sensitivity correction. The graphs also
show film response as a function of absorbed dose. For
the single-exposure technique, the relative standard devi-
ation is as large as 11% at low doses and stabilizes at a value
of 4% for doses in excess of 30 Gy. For the double-exposure
technique, the relative standard deviation is as high as 9%
at low doses and rapidly falls to a plateau of 2% at 30 Gy.
This result indicates that for four repeated readings using
separately exposed films, the double-exposure technique
should be able to characterize radiation fields with an exper-
imental precision of
2% (95% confidence interval) when
exposed to doses of at least 20 Gy.
GafChromic MD-55 was irradiated with
60
Co
-rays by
Klassen et al. [11] A double irradiation method was used in
which a dosimeter is given an unknown dose followed by a
known, calibration dose. It was found that the measured
optical density of GafChromic MD-55, as currently fab-
ricated, is affected by the polarization of the analyzing
light, an important consideration when using GafChromic
MD-55 as a precision dosimeter.
The thin, radiosensitive layers in GafChromic MD-55
are made of a colorless gel containing polycrystalline
substituted–diacetylene monomer, which undergoes par-
tial polymerization when irradiated with ionizing radiation
such that the blue color of the polymer becomes progres-
sively darker as the dose increases. The OD
u
due to the
polymer increases roughly linearly with absorbed dose.
Figure 5.24a shows the optical absorption spectrum of
GafChromic MD-55 from 600 nm to 700 nm, before and
after a dose of 6 Gy. Figure 5.24b, with its expanded scale
of OD and wavelength, shows the spectrum of an un-
irradiated film from 700 nm to 720 nm taken with a band-
pass of 1.0 nm. The oscillations in the OD are interference
fringes which constitute a channel spectrum. [11]
Some of the apparent absorption is actually a loss of
light due to reflection, not absorption. Using the equation
for reflective losses,
(5.13)
FIGURE 5.22 Central line OD profiles from a single film.
Graph (a) shows the results of a single 40-Gy exposure. The
middle figure, graph (b), shows the profile resulting from an
additional dose of 20 Gy. The lower figure gives the net OD
profile [derived by pixel-by-pixel subtraction of graph (a) from
graph (b)], with (dashed line) and without (solid line) the pixel-
by-pixel uniformity correction derived from the initial 40-Gy
exposure. (From Reference [10]. With permission.)
R
medium
air
()
medium
air
()[]
2
Ch-05.fm Page 316 Friday, November 10, 2000 12:01 PM
Film Dosimetry 317
where R is the reflectivity, 100R is the percent reflection,
medium
is the refractive index of the medium (taken to be
1.5 for Mylar), and
air
is the refractive index of air (1.0).
Klassen et al. calculated that the reflection from each
Mylar/air surface leads to a 4.0% light loss, or 8.0% from
the two such surfaces, which corresponds to an OD of
0.036. There are seven layers in GafChromic MD-55,
meaning eight reflecting surfaces.
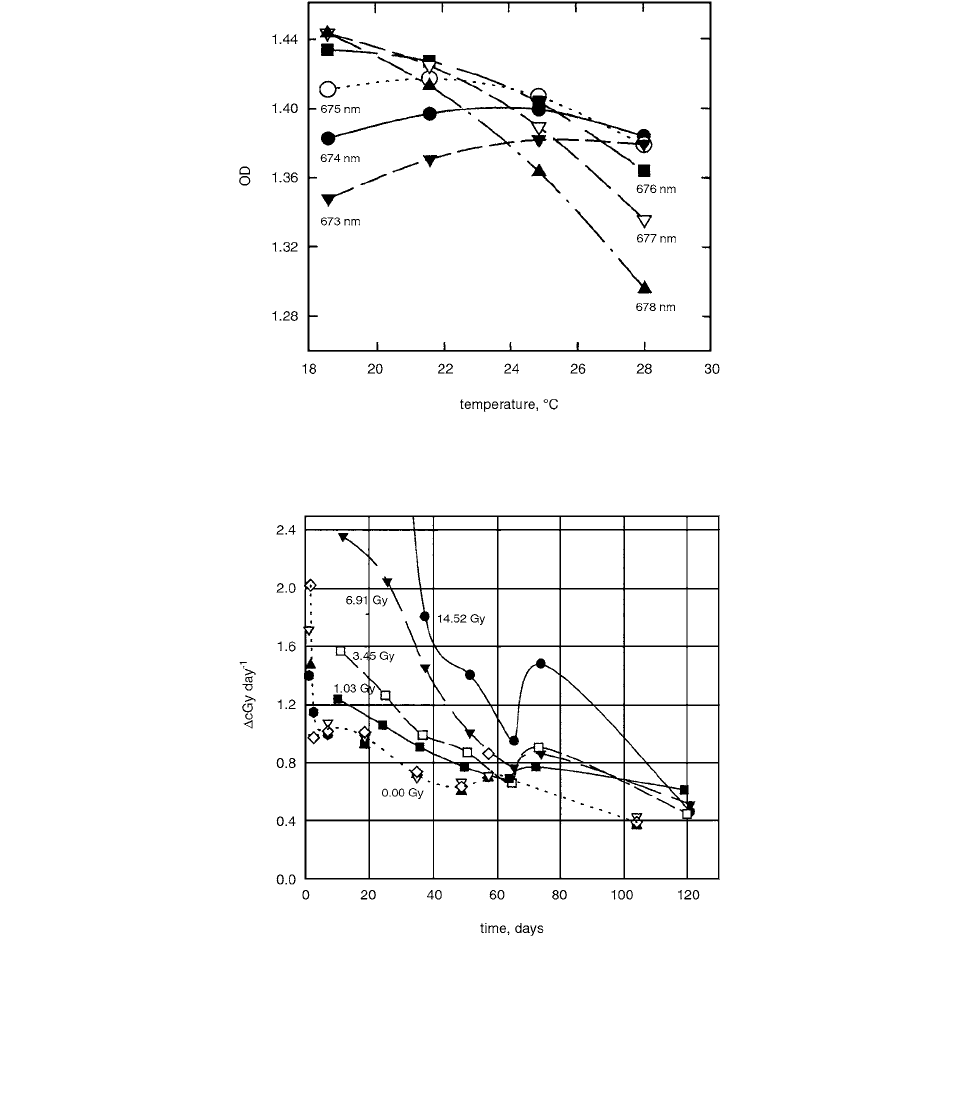
The temperature dependence of OD at 676 nm was
measured in two studies using six dosimeters that had
received 0, 1.0, 3.5, 6.9, and 14.5 Gy. Readings were
taken at seven temperatures between 18.8 and 28.1°C.
By returning to the initial temperature several hours later,
it was found that the OD did not change irreversibly
during the measurements. The results, displayed for 673,
674, 675, 676, 677, and 678 nm in Figure 5.25, show
that at 22°C the temperature dependence is smallest at
675 nm, only 0.0002 OD units for a 0.1 degree change
in temperature between 20°C and 24°C. At 24°C, a wave-
length of 674 nm has the smallest dependence of OD on
temperature. Figure 5.25 shows that poor control of the
spectrophotometer temperature can be countered by
selecting the wavelength with the smallest temperature
dependence.
FIGURE 5.23 Dose response curve of RCF to 6-MV x-rays at doses ranging from 1 Gy to 230 Gy for single- and double-exposure
techniques plotted on the left-hand scale. Interfilm reproducibility (relative standard deviation of the central effective pixel readings
from the four film pieces) is plotted on the right-hand axis of the graph. (From Reference [10]. With permission.)
FIGURE 5.24 (a) The optical absorption spectrum of un-irradiated GafChromic MD-55 (lower spectrum) and GafChromic MD-55
several weeks after a dose of about 6 Gy (upper spectrum). The bandpass used was 3.5 nm. Some useful wavelengths are indicated.
(b) The spectrum of un-irradiated GafChromic MD-55, taken using a bandpass of 1 nm and displayed at a higher sensitivity than in
(a) in order to demonstrate the periodic fluctuations due to interference fringes (channel spectrum). (From Reference [11]. With
permission.)
Ch-05.fm Page 317 Friday, November 10, 2000 12:01 PM
318 Radiation Dosimetry: Instrumentation and Methods
The change in OD was measured vs. time for a number
of dosimeters, some un-irradiated and others irradiated
to a variety of doses up to 14.52 Gy. Over this dose range,
1 Gy corresponds to about 0.11 OD units. Assuming 0.11
OD units equals 1Gy, the rate of change of OD is shown in
Figure 5.26 as the equivalent rate of change in cGy day
1
.
(OD
u
is the change in absorbance due to polymer
formation.)
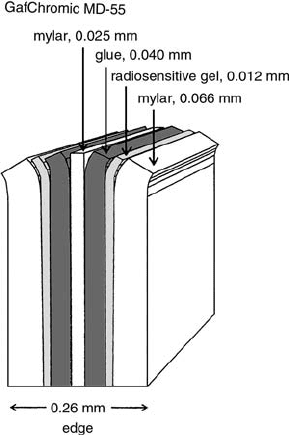
GafChromic MD-55 is composed of seven layers as
illustrated in Figure 5.27. Either outer Mylar layer could
be pulled off the gel by flexing the dosimeter under liquid
nitrogen and pulling the Mylar layer off or, alternatively,
by soaking the dosimeter in water overnight and pulling
it apart at the Mylar/gel interface.
In order to optimize the measurement sensitivity and
thus improve precision, Reinstein et al. [12] described a
FIGURE 5.25 A plot of the OD of a single dosimeter, which had received 6.9 Gy as read at a variety of temperatures and wavelengths.
The measurements were made several months after the irradiation. (From Reference [11]. With permission.)
FIGURE 5.26 The rate of change of optical density of un-irradiated and irradiated GafChromic MD-55 dosimeters where OD
u
is
expressed in terms of dose (assuming that 1 Gy
0.11 OD units). Time zero for the irradiated dosimeters was the end of the
irradiation. The dose to each dosimeter is displayed on the figure. A dotted line is given as a visual aid to the time dependence of
the four un-irradiated dosimeters for which time zero was the time they were cut from the sheet. A jump in the rate of change, most
easily seen at 65 days for the dosimeter that received 14.52 Gy, occurred over the same dates for all the dosimeters, time zero having
different dates for the different dosimeters. (From Reference [11]. With permission.)
Ch-05.fm Page 318 Friday, November 10, 2000 12:01 PM
Film Dosimetry 319
method to calculate the dose response curves (net optical
density at a given wavelength or spectrum vs. absorbed dose)
for different densitometer light sources using measured GC
film absorption spectra. Comparison with measurements on
the latest version of GC film (Model MD-55-2) using four
types of densitometers [He-Ne laser, broadband (white
light) densitometer, and two LED (red-light) filtered den-
sitometers] confirm the accuracy of this predictive model.
They found that an LED (red-light) source with a narrow
band-pass filter centered at 671 nm near the major absorp-
tion peak achieves nearly the maximum possible sensitiv-
ity (almost four times more sensitive than He-Ne laser,
632.8 nm) and may be suitable for in vivo dosimetry.
For LED light source coupled to a band-pass filter,
the resulting intensity as a function of wavelength after
having passed through the filter is
(5.14)
where I
0
(
) is the intensity of the light source (LED) at
wavelength
incident on the filter; I
1
(
) is the intensity
after having passed through the filter; and A
filter
(
) is the
absorbance of the filter at wavelength
. For the case of
the broadband (white light) light source, I
0
(
) was deter-
mined from the temperature of the tungsten filament, an
assumed blackbody radiation spectrum, and, for mathe-
matical convenience, A
filter
(
) 0 (no filter). By coupling
the light source
I
1
(
) with the absorption spectra of
GafChromic film, the intensity reaching the detector can
be written as
(5.15)
where
A
GAF
(
, D) is the absorbance of GafChromic film
at wavelength
, irradiated to a dose D. Optical density
as a function of dose [OD(D)] for GC film was calculated
by combining the equations above to yield
(5.16)
By subtracting the optical density of an un-irradiated
sample of GafChromic film, the net optical density (NOD)
as a function of dose was obtained (dose response curve)
for each densitometer light source. Note that the model
assumes a uniform response by the detector for the range
of wavelengths measured. The transmission spectra for
the two band-pass filters used in our measurements with
the filtered LED densitometers are shown in Figure 5.28.
Absorption spectra of GC film exposed to total doses 0,
10, 20, 30, 50, and 100 Gy and measured at 31.9 days
post-irradiation are shown in Figure 5.29. The minor and
major absorption peaks can clearly be seen. At 30 Gy
exposure, these peaks are centered at 614 nm and 674 nm,
respectively, with peaks shifting to lower wavelengths
with increasing dose.
Figure 5.30a plots the predicted dose response curves
at fixed wavelengths 400 nm, 510 nm, 632.8 nm, 650 nm,
and 671 nm as calculated from the measured absorption
spectra of GC film (MD-55-2). It is observed that the dose
response curve measured at 671 nm (near the major peak)
is the most sensitive with a DNODI 14 Gy. The least
sensitive dose response curve is at 400 nm (not near either
of the absorption peaks), where a net optical density of
1 is not achieved, even for a dose as high as 100 Gy. Of
the fixed wavelengths, the dose response curve at 650 nm
(on the left shoulder of the major peak) exhibits the great-
est linearity, with a DNODI 34 Gy. Also shown is the
dose response curve for a fixed wavelength of 632.8 nm,
which can be compared with the measured data from the
He-Ne laser densitometer. The predicted and measured
results show excellent agreement (DNODI 56 Gy for
both). [12]
The dose response of high-sensitivity GafChromic
film to photons from
125
I seeds for doses up to 200 Gy
FIGURE 5.27 A schematic view of the structure of GafChromic
MD-55, indicating the seven layers and their thicknesses. The
uncertainty in the measurement of the thicknesses was estimated
to be about
0.001 mm for the hard Mylar layers and 0.002
mm for the soft, gel, and glue layers. (From Reference [11]. With
permission.)
I
1
() I
0
()10
A
filter
()
I
2
, D()I
1
()10
A
GAF
,D()
OD D() log
I
0
()10
A
filter
()
10
A
GAF
,D()
0
dI
0
()10
A
filter
()
d
0
Ch-05.fm Page 319 Friday, November 10, 2000 12:01 PM