Seuront L. Fractals and Multifractals in Ecology and Aquatic Science
Подождите немного. Документ загружается.

144 Fractals and Multifractals in Ecology and Aquatic Science
where ΔQ(t) is the uctuations of a scalar signal at scale t and “
.
” means statistical average;
that is,
|()|∆Q
q
τ
is the statistical moments of the uctuations ΔQ(t) = Q(t + t) − Q( t ). Here,
instead of considering discrete statistical moments as the mean (q = 1) , v a r i a n ce (q = 2) , s k ew -
ness (q = 3), and kurtosis (q = 4), Equation (4.58) gives the scale-invariant structure functions’
exponent z(q), which continuously characterizes all the statistics of the signal. The rst moment
z(1) gives the “intermittent Hurst exponent” and denes the scaling of the average uctuation;
z(1) = 0 for scale-independent signals. The second moment is linked to the power spectrum expo-
nent b as b = 1 + z(2). For fractional Brownian motion signals, z(q) is linear (Figure 4.30). In
contrast, for intermittent signals, this function is nonlinear and convex (Figure 4.30). Further the-
oretical and practical developments of structure function can be found in Chapter 8. Specically,
Equations (4.13) and (4.14) would lead to a systematic underestimation of the Hurst exponent
H
fBm
for intermittent fractional Brownian motion (ifBm; b > 1) and a systematic overestimation
–5
–2
–2.0 –1.0 0.0
Log f
Log E ( f )
1.02.0
–3
–4
–6
–1
0
1
2
3
32.5
0 250 500
Time
β = 5/3 (r
2
= 0.98)
β = 5/3; (r
2
= 0.98)
Velocity (cm s
–1
)
750
A
B
1000
32.9
33.3
33.7
34.1
34.5
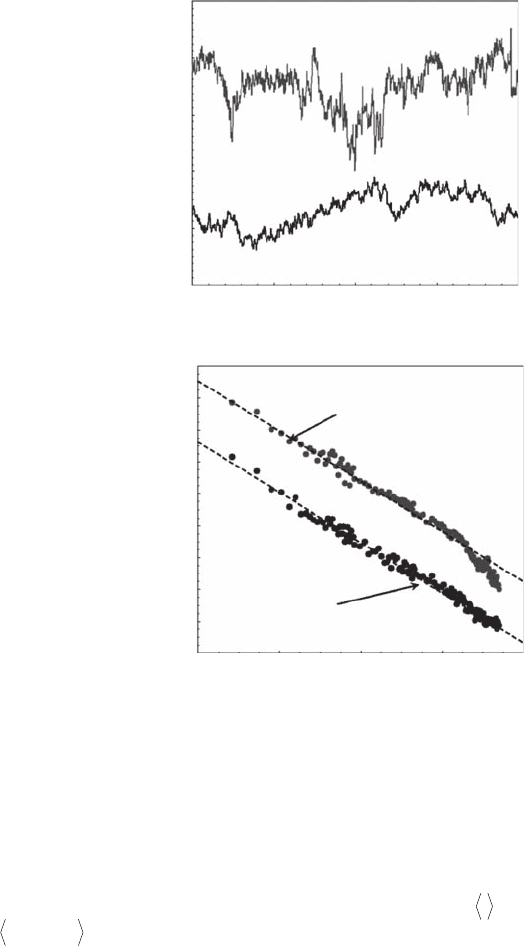
Figure 4.29 Time series of grid-generated turbulent velocity recorded by hot-wire velocimetry at 100 Hz
in a circular ume (Seuront et al. 2004) and a synthetic fractional Brownian motion time series with the same
spectral properties as the empirical one (A). Although the empirical time series is clearly more intermittent
than the synthetic one, their power spectra are very similar, showing a power-law behavior with b = 5/3 over
more than three decades (B). The roll-off observed for the empirical power spectrum at high frequencies is
related to the electronic limitations of the instrument.
2782.indb 144 9/11/09 12:10:19 PM
Self-Affine Fractals 145
of H
fGn
for intermittent fractional Gaussian noise (ifGn; b < 1) (see Figure 4.31). A meaning-
ful fractal analysis thus requires rst the dichotomy between intermittent and nonintermittent
signals. Nonintermittent signals can be analyzed following the step-by-step approach proposed
in Section 4.2.10.1. Intermittent signals have to be analyzed using appropriate techniques, as
described in detail in Chapter 8.
3.5
3.0
2.5
2.0
1.5
1.0
ζ (q)
0.5
0.0
0246
q
810
Figure 4.30 Structure function analysis of the empirical and simulated time series shown on Figure 4.29.
The exponent z (q) is nonlinear and convex for the empirical (intermittent) time series (gray dots), while z (q) is
linear for the simulated fractional Brownian motion (black dots) and ts the theoretical expectation z (q) = qH,
where H = z (1).
0.7
0.6
0.5
0.4
0.3
H
ζ(q)
0.2
0.1
0
0 0.1 0.2
H
fBm
/H
fGn
0.3 0.4 0.5 0.6 0.7
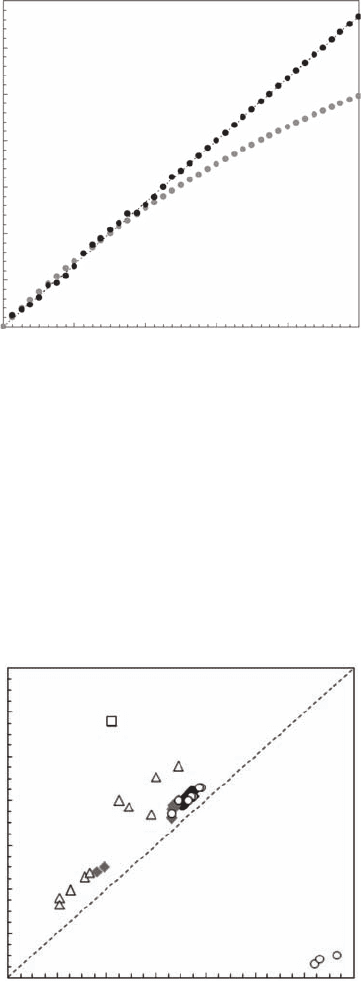
Figure 4.31 Comparison of the “Hurst” exponents H obtained for the time series of temperature (black
diamonds), salinity (gray diamonds), in vivo uorescence (open dots), dissolved inorganic nutrients (open
triangles), and zooplankton abundance (open square) using methods developed for the analysis of fBm and
fGn signals (H
fBm
/H
fGm
); and using structure function analysis, H
z(q)
. (Temperature, salinity, and uorescence
data are from Seuront et al., 1996a, 1999; Seuront, 1999, 2005b. The dissolved inorganic nutrient data are
from Seuront et al., 2002; zooplankton data are from Seuront and Lagadeuc, 2001.)
2782.indb 145 9/11/09 12:10:24 PM
2782.indb 146 9/11/09 12:10:24 PM

147
5
Frequency Distribution
Dimensions
A common procedure for looking at the level of organization of any data set is to study the prob-
ability density function (PDF) or the cumulative density function (CDF). In particular, cumulative
hypergeometric frequency distributions have been found in many areas of the natural sciences (see,
for example, Laherrere and Sornette 1998 for a review) and imply a wide range of values with many
small values and few large values. This chapter focuses on several aspects of the cumulative fre-
quency distribution of self-similar and self-afne patterns. This includes theoretical investigations
of the correspondence between cumulative distribution functions and probability density functions
(Section 5.1) and the descriptions of the frequency distributions of intensities, areas, and volumes
(Sections 5.2, 5.3, and 5.4). Special attention is nally given to rank-frequency distributions, from
their original development in linguistics and their link to information theory and entropy to their
effectiveness as a simple and direct diagnostic tool for ecologists to assess ecosystem complexity
and their applicability to the analysis of symbolic sequences (Section 5.5).
5.1 cumulatiVe distribution Functions
and Probability density Functions
5.1.1 T
h E o r y
The Pareto law was originally introduced in economics to describe the number of people whose per-
sonal incomes exceeded a given value (Pareto 1896). More generally, the Pareto law of any random
variable X is described in terms of the cumulative density function (CDF):
P[X ≥ x] ∝ x
−f
(5.1)
where x is a threshold value, and f is the slope of a log-log plot of P[X ≥ x] vs. x. Note that Equation (5.1)
can be equivalently rewritten in terms of the PDF as (Faloutsos et al. 1999):
P[X = x] ∝ x
−m
(5.2)
where m ( m = f + 1) is the slope of a log-log plot of P[X = x] vs. x. Note that Pareto’s law has also been
used to describe self-organized criticality (SOC) in a range of natural phenomena (see Section 6.3).
5.1.2 ca s E sT u d y : mo T i o n bE h a v i o r o F T h E in T E r T i d a l ga s T r o p o d Li t t o r i n a Li t t o r e a
5.1.2.1 the study organism
The common periwinkle, Littorina littorea (Linnaeus 1758), is among the most abundant herbivo-
rous gastropod molluscs of the Western and Northern European coasts. L. littorea is probably the
best known of its family, as it has been collected and eaten for centuries. L. littorea was introduced
to North America from Europe in the mid-1800s to Nova Scotia either through ballast waters or for
food (Bertness 1999). Since their arrival, they have managed to outcompete most local species to
become the dominant herbivore in the rocky intertidal zone from New England to Chesapeake Bay
2782.indb 147 9/11/09 12:10:25 PM
148 Fractals and Multifractals in Ecology and Aquatic Science
(Bertness 1999). Their spread was limited to most of the East Coast of North America, which is
compatible with the temperature ranges that exist in Europe (Levinton 2001).
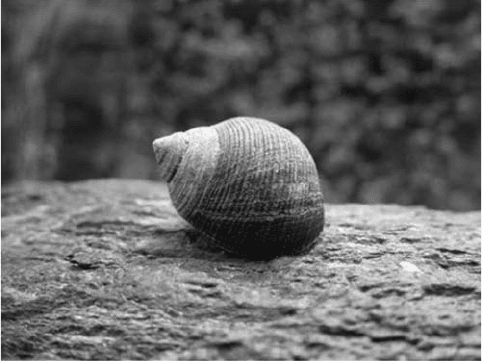
Littorina littorea normally grow to about 2 to 3 centimeters in length (Bertness 1999) and have
an average life span of 5 to 10 years (Buczaki 2002). The general morphology differs from region to
region, but they have a dark grey or black conical shell (Figure 5.1a) with spiral ridges that evolves
toward a smooth surface with age. L. littorea is widely distributed on most rocky shores from the
upper shore into the sublittoral, except in the most exposed areas. It can also be found in sandy and
muddy habitats such as estuaries and mud ats, and is fairly tolerant of brackish water.
Like its land relative, the snail, L. littorea move on a muscular, ciliated foot, secreting a lm of
slimy mucus on which they can slide and move (Brusca and Brusca 1990). They forage primarily
underwater or during cool, low tides, or when ocean spray moistens the rocks (Figure 5.1b). The
pedal retractor muscle shortens and lengthens the foot so that the organism can have the option of
hiding in its shell for periods of time. When not walking or exposed to the sun for a long time, the L.
littorea often seeks shelter in a shaded crevice and seals the gap between its shell and the rock with
mucus to avoid desiccation or being swept away by currents and breaking waves (Lerman 1986).
Periwinkles graze on a wide range of food items from nonsiliceous microalgae over diatoms
to leathery and coralline algae (Steneck and Watling 1982). L. littorea, however, graze preferen-
tially on periphyton (that is, a complex matrix of microalgae, cyanobacteria, heterotrophic bac-
teria, and detritus attached to submerged surfaces such as rocks) and ephemeral macroalgae such
as Enteromorpha sp. (Figure 5.1c). This species is so voracious that at high densities (up to 600 to
1000 per square meter; Bertness 1999), it will consume all ephemeral algae, similar to the destruc-
tive feeding patterns of sea urchins (Bertness 1999). L. littorea are important grazers in intertidal
ecosystems and often control the dominant algae (Lubchenco 1983).
5.1.2.2 experimental Procedures and data analysis
The motion behavior of L. littorea was investigated on a rocky platform typical of the rocky habitats
found along the French coast of the eastern English Channel. This platform ranges over the whole
intertidal zone, bounded between the upper and lower limits reached by the tidal ow at high and
low tide, respectively. The platform was topographically homogeneous, dominated by bare rocks
partially covered by the common barnacle Balanus balanoides and with a few cracks and crevices
occupied by the blue mussel Mytilus edulis. Three sites were chosen for their decreasing immersion
Figure 5.1 The intertidal gastropod Littorina littorea in its typical rocky environment while sealed to a dry
rock. (Modied from Seuront et al., 2007.)
2782.indb 148 9/11/09 12:10:26 PM
Frequency Distribution Dimensions 149
time during high tide at 50 m (site A), 70 m (site B), and 130 m (site C) from the lower limit of
the low tide and were all submersed at high tide. At each of the three locations, 30 specimens of
L. littorea were captured, individually measured, and marked with numbered plastic tags (2 mm ×
3 mm) xed to the dorsal part of the shell with inert glue and released from a single point. The shell
sizes of the three groups of individuals were signicantly different (Kruskal-Wallis H-test, p < 0.01)
with 15.27 ± 0.15 mm at site A, 14.68 ± 0.17 mm at site B, and 13.69 ± 0.18 mm at site C. After the
release of individuals on 20 March 2006, the three release areas were searched on 14 successive
daylight low tides. The direction of a sighted L. littorea from the release stake was measured with a
compass and distance (nearest centimeter) with a tape, and the apparent distances traveled from one
low tide to the next were estimated. Each site thus provided 420 measurements of distance traveled.
No movements were observed at low tide during the distance measurements.
5.1.2.3 results
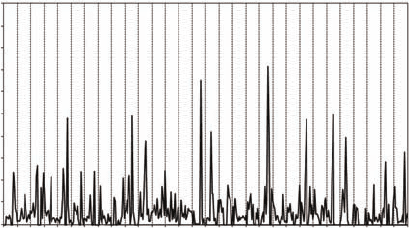
The successive displacements of L. littorea are consistently characterized by a very intermit-
tent behavior, with a few localized large displacements over a wide range of small displacements
(Figure 5.2). The corresponding displacements ranged from 1 to 1558 cm in site A, 1 to 715 cm in
site B, and 1 and 1084 cm in site C. These intermittent distributions result in a signicantly non-
normal distribution (p < 0.01) with elevated positive skewness g
1
, g
1
= 6.1, 3.4, and 5.1 in sites A, B,
and C, respectively. None of the distributions were statistically different from the others (Kruskal-
Wallis H-test, p > 0.05).
To further quantify the property of the extreme displacements leading to the observed positively
skewed distributions, Equation (5.1) has been rewritten as:
P[l
d
= l] ∝ l
−m
(5.3)
where l
d
is the displacement length, l a threshold value, and m (1 < m ≤ 3) characterizes the power-
law behavior of the tail of the distribution. Equation (5.3) corresponds to a family of distributions
dened according to the values of m. These distributions mean that extremely long movements
occurred more often than would be expected if the forager exhibited movement lengths with a
normal distribution. For m ≥ 3, the distribution is Gaussian (which according to the central-limit theo-
rem has a nite variance) and the motion is equivalent to Brownian motion walks. For 2 ≤ m < 3, the
scaling is superdiffusive (Shlesinger et al. 1996), while the value m = 2 indicates that the scaling
becomes quadratic in time and corresponds to the lower extreme of superdiffusive processes,
that is, Lévy ight (Shlesinger et al. 1996). In contrast, values m ≤ 2 do not correspond to prob-
ability distribution that can be normalized (Shlesinger et al. 1996). The smaller m is, the more
900
1000
700
600
500
400
200
300
100
0
Littorina littorea Individuals
Distance Traveled (cm)
800
Figure 5.2 Intermittent in the successive displacements in Littorina littorea motion behavior observed at
site A, located 50 m away from the lower limit of low tide. Each dotted line separates the 14 successive records
of each of the 30 tracked individuals.
2782.indb 149 9/11/09 12:10:29 PM
150 Fractals and Multifractals in Ecology and Aquatic Science
intermittent the distribution is. When m ≤ 3, the variance of the process diverges, and when m ≤ 2
the mean is not dened. The parameters m were estimated for sites A, B, and C as the slope
of P(l
d
) vs. l
d
in log-log plots (Figure 5.3). The values of m estimated from L. littorea displace-
ments were all signicantly smaller than 2 (p < 0.01), and signicantly different from each other
(p < 0.01) with m = 2.22 ± 0.02 for site A, m = 2.43 ± 0.05 for site B, and m = 2.67 ± 0.04 for site C.
The scaling then falls into the category of superdiffusive processes, that is, 2 ≤ m.
5.1.2.4 ecological interpretation
The increase in the parameter m with increasing distances from the lower limit of the low tide sug-
gests that the intermittency of movement patterns increases with increasing immersion time. This
is consistent with reported increase in periwinkle foraging activity when underwater at high tide
(Lubchenco 1978). In addition, the maximum displacements observed here (1558, 858, and 1084 cm
for sites A, B, and C, respectively) are consistent with the movement speed found in the literature for
L. littorea, ranging from 3 to 5 cm mn
−1
(Erlandson and Kostylev 1995). Considering that between
two successive daylight low tides (ca. 24 hours), the three sites were submersed between 30% and
50% of the time (that is, 8 to 12 hours), the expected displacements ranged from 1440 to 3600 cm.
We also investigated the potential causal relationships between L. littorea successive displacements
and the main abiotic forcing factors characterizing the sampling sites. Immersion time, seawa-
ter temperature, and sea conditions are thus likely to impact L. littorea motion behavior as these
organisms increase their activity when underwater (Lubchenco 1978) or when the temperature is
rising (Lubchenco 1978), and increased hydrodynamic conditions such as tidal currents and break-
ing waves may dislodge them and advect them far away. However, no signicant correlations were
observed with immersion time, seawater temperature, or sea conditions (approximated by wind
speed, as winds are the main factor responsible for the formation of breaking waves in this area)
(Seuront et al. 2006). As L. littorea successive displacements exhibit heavy-tailed distributions, it is
hypothesized that similar driving processes, expectedly biotic, are driving the dynamics of distance
traveled by L. littorea.
By simulating a limiting generalized searcher-target model (for example, predator–prey, mat-
ing partner, pollinator-ower, parasite-host), recent theoretical results indicate that Lévy walks
Log P (l
d
)
1.50 1.70 1.90 2.10
Log l
d
2.30 2.50 2.70 2.90 3.10 3.30
3.5
3.0
2.5
2.0
1.5
1.0
0.5
0.0
–0.5
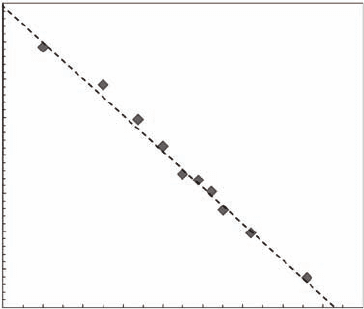
Figure 5.3 Log-log plot of the probability distribution function (PDF) of Littorina littorea successive dis-
placements investigated at site B located 70 m away from the lower limit of low tide. The dotted lines cor-
respond to the best linear t of P(l
d
) vs. l
d
, leading to estimate the exponent m as m = 2.43 ± 0.05. (Modied
from Seuront et al., 2007.)
2782.indb 150 9/11/09 12:10:34 PM
Frequency Distribution Dimensions 151
confer a signicant advantage over the usual Gaussian (that is, Brownian) motion for increasing
encounter rates when the searcher is larger or moves rapidly relative to the target, and when the
target density is low (Viswanathan et al. 2001, 2002; Bartumeus et al. 2003). The heavy-tailed
distributions observed here (with m = 2.22, 2.43 and 2.67) signicantly diverge from Lévy walks
where m = 2. According to optimal foraging theory (Stephens and Krebs 1986), evolution through
natural selection should favor exible behavior, leading to different optimum searching strategies
(that is, searching statistics) under different conditions. Our results then suggest that the biotic
conditions encountered at each of our three sites might have been different, leading to different
(heavy-tailed) distributions for the most extreme displacements. Note that power-law behaviors
have also been widely described from pause or ight duration in ies (Cole 1995), albatrosses
(Viswanathan et al. 1999), rats (Kafetsopoulos et al. 1997), gilts (Harnos et al. 2000), and zoo-
plankton (Bartumeus et al. 2003), and subsequently interpreted as a Lévy ight signature. A Lévy
ight, however, is diagnosed by a power law in the probability density function (or cumulative
density function) of ight amplitudes (see, for example, Shlesinger et al. 1996). This is funda-
mentally different from a power law in the probability density function of pause duration and
ight duration. Specically, a power law in the probability density function of ight duration is
equivalent to a power law in the probability density function of ight length only if the consid-
ered organisms are moving at a constant velocity, which is very unlikely considering the intrin-
sic intermittent nature of animal locomotion (see, for example, Kramer and McLaughlin 2001;
Seuront et al. 2004c, 2004d, 2007); see also Figure 8.1B and Figure 8.2A,B.
Although an inverse square probability density distribution P(l
d
) ∝ l
−2
d
of step lengths l
d
leads
to an optimal random strategy for organisms searching for randomly located objects that can be
revisited any number of times (Viswanathan et al. 2001; Stephens and Krebs 1986), we are not
aware of any attempt to investigate this issue when prey items are heterogeneously distributed
as previously reported for the sampling site (Seuront and Spilmont 2002; Seuront and Leterme
2006). Although this is not an easy task, future work should concentrate on getting simultaneous
measurements of predator motion behavior and prey concentration and distribution. As the main
biotic factors driving organism motion behavior are the presence/absence, abundance, and distri-
bution of prey items, predators, and mates, further investigations on the interplay between motion
behavior statistics and the qualitative and quantitative nature of the biotic environments are essen-
tial to gain new insights into the origin of heavy-tailed distributions in biological systems.
5.2 the Patch-intensity dimension, D
pi
Equation (5.1) has also been independently used to describe the space-time dynamics of self-afne
processes (see Chapter 4) that build up stress and then release the stress in intermittent pulses, such
as earthquakes (Olami et al. 1992; Correig et al. 1997), landscape formation (Somfai et al. 1994a,
1994b), avalanches (Noever 1993), volcanic eruption (Diodati et al. 1991), and sediment deposition
in the ocean (Rothman et al. 1994); the Gutember-Richter law of geophysics states that the number
of earthquakes N with energy E greater that a given threshold E
0
scales with E
0
(Feder and Feder
1991). Equation (5.1) can then be rethought and adapted to a mosaic landscape/seascape composed
of patches of different intensities as:
N(C ≥ c) = kc
−D
c
(5.4)
where k is a constant, N is the number of patches of concentration C greater than c, and D
pi
is
the related fractal dimension (Figure 5.4). Equation (5.4) has recently been successfully used to
characterize the distribution of microscale microphytobenthos biomass distribution on an inter-
tidal sandy at, leading to a patch-intensity dimension D
pi
= 5.31 (Seuront and Spilmont 2002).
Evidence for such distributions in ecological sciences is still scarce but nevertheless includes a
2782.indb 151 9/11/09 12:10:35 PM
152 Fractals and Multifractals in Ecology and Aquatic Science
wide spectrum of ecological elds ranging from tree-fall gap formation in tropical rainforests
(Manrubia and Solé 1996) and bird population dynamics (Keitt and Marquet 1996) to models of
ecosystem (Bak et al. 1989) and evolution (Bak and Sneppen 1993; Paczuski et al. 1995). In par-
ticular, data sets related to the introduced Hawaiian avifauna support a scenario in which island
communities build up to a critical number of species, above which avalanches of extinction occur
(Keitt and Marquet 1996). The avalanches of extinction observed in the fossil record (Raup 1982)
may then be indicative of a self-organized critical state, as suggested from simple coevolutionary
models (Bak and Sneppen 1993; Kauffman and Johnsen 1991; Flyvbjerg et al. 1993). In the case of
coevolving species, one may note that exact analytical solutions have been given and demonstrate
that extinction cascades following the distributions given in Equation (5.4) can emerge spontane-
ously in simple models of coevolution (Flyvbjerg et al. 1993; de Boer et al. 1994). More gener-
ally, these results suggest that ecological communities are not characterized by a well-dened
equilibrium but rather by a detailed balance that is minimally stable to perturbations such that
the introduction of species can trigger extinction cascades. In particular, an interesting feature of
Equation (5.4) is its applicability to self-similar patterns and also to self-afne processes; its con-
nections with self-organized criticality and multifractals are respectively discussed in Section 6.3
and Chapter 8.
Equation (5.4) can be generalized to the analysis of surface structure previously described in
a self-similar fashion using the transect dimension described in Section 3.2.9.1. If one considers
the cumulative frequencies f
i
(x) and f
j
(x) of observing values of the descriptor X(i, j) greater than
a threshold value x, the patch-intensity dimensions of the ith and jth longitudinal and latitudinal
transects are given, following Equation (5.4), as:
N(C ≥ c
i
) = kc
−D
pi
i
N(C ≥ c
j
) = kc
−D
pi
j
(5.5)
where i = 1,…, n
i
, i = 1,…, n
j
, k is a constant, and D
pi
i
and D
pi
j
are the patch-intensity dimensions of
the ith and jth longitudinal and latitudinal transects, respectively.
2.5
2.0
1.5
1.0
0.5
0.0
–0.5
0 0.3 0.6 0.9 1.2 1.5
Log c
Log [Pr (C ≥ c)]
Pr (C ≥ c) = k.c
–5.31
r
2
= 0.99
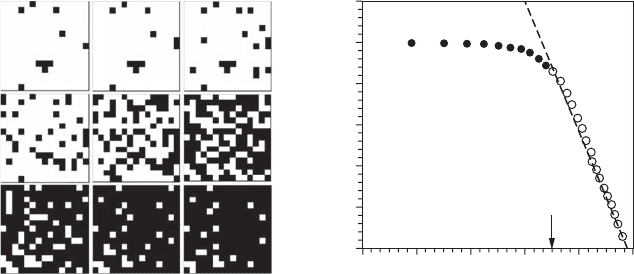
Figure 5.4 Patch-intensity dimension. From a two-dimensional pattern (here, microphytobenthos chloro-
phyll a concentration C; left panel), one can dene a series of increasing thresholds (in white, the areas where
the biomass exceeds a critical concentrations c such as C ≥ c with white areas indicating locations where C ≥ c).
The slope of the linear behavior of a log-log plot of the probability of exceeding a given threshold as a func-
tion of the threshold is an estimate of the patch-intensity dimension (right panel). (Adapted from Seuront and
Spilmont, 2002.) (See Section 3.2.4.2 for a description of the data and their analysis using the mass dimension
method, see Section 3.2.4.)
2782.indb 152 9/11/09 12:10:38 PM
Frequency Distribution Dimensions 153
The mean fractal dimensions of the latitudinal and longitudinal transects are subsequently given as:
D
n
D
D
n
D
pi
i
pi
i
n
pi
j
pi
j
n
ii
i
jj
j
=
=
=
=
∑
∑
1
1
1
1
(5.6)
The one-dimensional patch-intensity dimension
D
pi
ij,
is then dened as:
DDD
pi pi pi
ij ij
=+
1
2
()
(5.7)
and the two-dimensional patch-intensity dimension of the surface nally comes as:
DD
pi pi
ij ij
=+1
(5.8)
As stressed in Section 3.2.9, note that Equation (5.6) and consequently Equation (5.7) and Equation (5.8)
are relevant only when the isotropy condition is fully satised (see Section 7.2.2) and then requires
an appropriate statistical test of homogeneity between the n
i
and n
j
dimensions D
t
i
and D
t
j
. (see Zar
1996).
5.3 the KorcaK dimension, D
K
Looking for structure in the complex distribution of areas of islands in the Aegean Sea, Korcak
(1938) used the conventional cumulative frequency distribution and empirically found a rela-
tionship between the number of islands of area greater than the threshold area a:
N(A ≥ a) = ka
−K
(5.9)
where K is referred to as the Korcak exponent of patchiness (0 ≤ B ≤ 1) and k is a constant. It was
later demonstrated (after Mandelbrot’s discovery of fractal geometry) that the Korcak exponent of
patchiness K and the fractal dimension D
K
were related as:
K
D
D
E
K
=
1
(5.10)
where D
E
is the dimension of the embedding Euclidean space; see Mandelbrot (1977, 1983), and
Hastings and Sugihara (1993) for mathematical proof. An examination of the data of the whole
world yields K = 0.65, thus D
K
= 1.30; see Equation (5.10). More local estimates using restricted
regions range from K = 0.50 (that is, D
K
= 1.00) for Africa (typically an enormous island with
smaller islands whose sizes decrease rapidly) up to K = 0.75 (that is, D
K
= 1.50) for Indonesia and
North America (where the predominance of the largest islands is less overwhelming; Mandelbrot
1975). The Korcak exponent K measures the number of small patches relative to the number of
larger patches, with smaller values of K corresponding to fewer small patches. Distributions with
high Korcak exponents of patchiness (that is, low Korcak dimension D
K
) are thus patchier (more
small patches) than distributions characterized by smaller values of K (that is, larger values of D
K
).
Hastings et al. (1982) used this method to measure patchiness in vegetative ecosystems, while
2782.indb 153 9/11/09 12:10:42 PM