Seuront L. Fractals and Multifractals in Ecology and Aquatic Science
Подождите немного. Документ загружается.

124 Fractals and Multifractals in Ecology and Aquatic Science
4.2.3 sc a l E d wi n d o w E d va r i a n c E an a l y s i s
4.2.3.1 theory
Scaled windowed variance (SWV) analyses, also referred to as roughness-length analyses, are
applicable only to fBm signals. Those methods are based on dividing a temporal signal x( t ) into
nonoverlapping windows of size t and computing the standard deviation, SD(i), in each of these
windows as:
SD ixtx
i
t
() [()]
/
=
−
−
=
∑
1
1
2
1
12
τ
τ
(4.36)
w
i
(t)w
i
(t)w
i
(t)
0 400 800 1200
1600 2000
40
A
B
C
30
20
10
0
–10
–20
0 400 800 1200
1600 2000
40
30
20
10
0
–10
–30
–20
0 400 800
Time
1200
1600 2000
40
30
20
10
0
–10
–30
–20
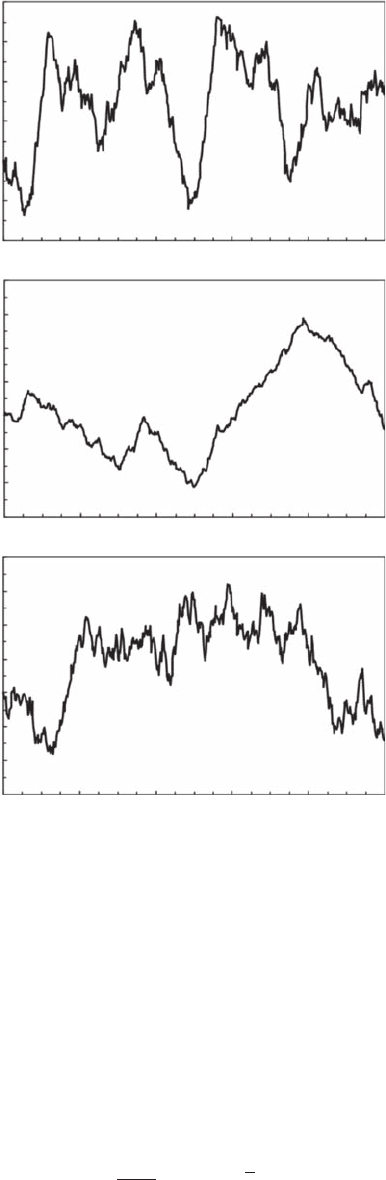
Figure 4.17 Behavior sequence random walks w
i
( t ) obtained for (A) the New Holland honeyeater and (B)
the red wattlebird, and (C) for the New Holland honeyeater in the presence of red wattlebird.
2782.indb 124 9/11/09 12:09:12 PM

Self-Affine Fractals 125
where
x
i
is the average within each interval. The average standard deviation, SD(t), for each win-
dow size t is further expressed as:
SD
n
SD i
i
n
() ()
τ
=
=
∑
1
1
(4.37)
where n is the number of nonoverlapping windows of size t. This procedure is iterated for all pos-
sible window sizes. For a fractal signal x( t ), SD(t) scale with t as:
SD(t) ∝ t
H
(4.38)
where H is the Hurst exponent described above. The subsequent fractal dimension D
SWV
is derived
from Equation (4.9) as:
D
SWV
= 2 − H (4.39)
Initially introduced by Mandelbrot (1985), this method applies no correction to the trends present
within a given window and potentially leads to bias in H estimates (Schmittbuhl et al. 1995; Turcott
and Teich 1995). Trends in the signal seen within a given window can, however, be corrected either
by subtracting a linearly estimated trend (that is, line-detrended scaled windowed variance analy-
sis, ldSWV) or the values of a line bridging the rst and last values of the signal (bridge-detrended
scaled windowed variance analysis [bdSWV]) (Cannon et al. 1997). Note that line detrending and
bridge detrending are conceptually similar to the detrending procedure used in detrended uctua-
tion analysis (Section 4.2.2) and illustrated in Figure 4.12.
4.2.3.2 case study: temporal distribution of the calanoid copepod Temora Longicornis
4.2.3.2.1 The Study Organism
Copepods are the largest and most diversied group of crustaceans, they are the most numerous
metazoans (that is, multicelled organisms) in the aquatic communities, and they are considered
the most plentiful group on Earth, outnumbering even the insects, which include more species but
fewer individuals. As an example, considering a mean density of just one copepod per liter of the
overall volume of the open ocean (that is, 1347 × 10
6
km
3
) would suggest a total world population
in the order of 1.35 × 10
21
(Boxshall 1998). They include over 14,000 species, 2,300 genera, and 210
families, a surely underestimated number. Their habitat ranges from freshwater to hypersaline con-
ditions, from subterranean caves to water collected in bromeliad leaves or leaf litter on the ground,
from streams, rivers, and lakes to the sediment layer in the open ocean, from the highest mountains
to the deepest ocean trenches, and from the cold polar ice–water interface to the hot active hydro-
thermal vents. Copepods may be free-living, symbiotic, internal, or external parasites on almost
every phylum of animals in water. The usual length of adults is 1 to 2 mm, but adults of some spe-
cies may be as small as 0.2 mm and others may be as large as 10 mm. Copepods are the dominant
forms of the marine plankton that constitute the secondary producers in the marine environments.
As such, they constitute a fundamental step in the oceanic food chain, linking microscopic algal
cells to juvenile shes and whales, and play a pivotal role in the functioning of marine systems and
biogeochemical cycles (Roemich and McGowan 1995).
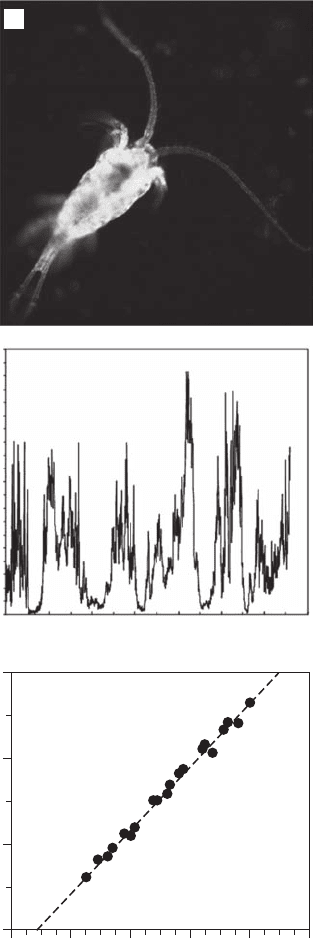
More specically, the calanoid copepod Temora longicornis (Figure 4.18A) is a very abundant
and nearly ubiquitous species in coastal waters. It is also of great ecological signicance in many
areas as it represents 35 to 70% of the total copepod population in the Southern Bight of the North
Sea (Daan 1989) and in the eastern English Channel (Seuront 2005c); in Long Island Sound (USA),
it is able to remove up to 49% of the daily primary production (Dam and Peterson 1993).
2782.indb 125 9/11/09 12:09:14 PM
126 Fractals and Multifractals in Ecology and Aquatic Science
4.2.3.2.2 Experimental Procedures and Data Analysis
Sampling was conducted in the coastal waters of the eastern English Channel (see Figure 4.8) for 66
hours. Water was continuously sampled from a depth of 10 m through a weighted seawater intake
and directly brought through a 200-mm mesh plankton net using a Flight pump with a 300 l-min
–1
2.4
Time (h)
2.2
2.0
1.8
0.90.5 1.3 1.7 2.1 2.5
10
2000
B
C
1500
1000
500
Abundance (ind m
–3
)
0
0 20 30 5040 7060
Log τ
Log s (τ)
A
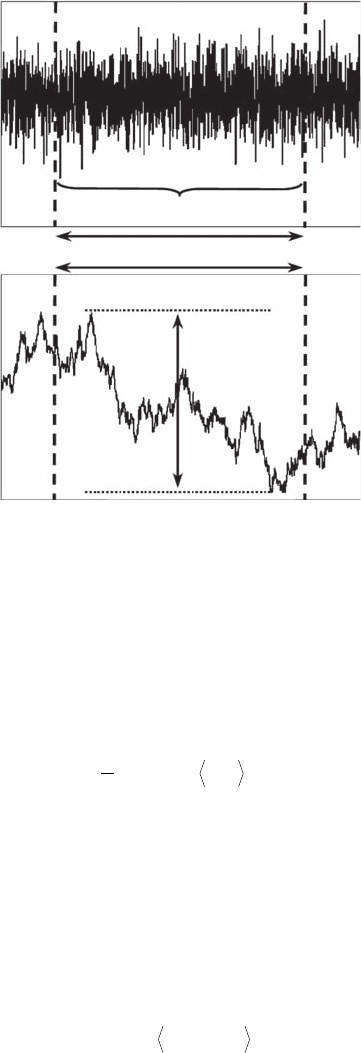
Figure 4.18 The calanoid copepod Temora longicornis (A), a high-frequency time series of the abundance
of adult male and female T. longicornis sampled in the inshore waters of the eastern English Channel (B), and
the related log-log plot of S(t) vs. t (Equation 4.38) resulting from the scaled windowed variance analysis.
2782.indb 126 9/11/09 12:09:17 PM
Self-Affine Fractals 127
output, connected to a 10-cm-diameter plastic tubing. Every 3 minutes, ltered organisms were
collected and immediately preserved in a 10% formaldehyde solution. This resulted in a total of
1321 samples. Adult males and females from each sample were subsequently enumerated under
a dissecting microscope. The resulting time series (Figure 4.18B) exhibits signicant semidiurnal
tidal cycle (that is, 12.5 hours) but was also characterized by very violent and erratic uctuations.
A previous power spectrum analysis showed a very strong scaling behavior over more than two
decades, with b = 1.42 (Seuront and Lagadeuc 2001), thus suggesting that the temporal distribution
of T. longicornis belongs to the family of fractional Brownian motions. After detrending, the scal-
ing properties of the time series shown in Figure 4.18B were investigated using Equation (4.38) and
the fractal dimension derived from Equation (4.39).
4.2.3.2.3 Results and Discussion
The log-log plot of s(t) versus t shows a unique scaling regime over the whole range of available
scales (Figure 4.18C), with H = 0.37, thus D
SWV
= 1.64. The presence of a unique scaling regime
suggests that the same process, or similar processes, is responsible for the scaling structure of the
abundance of T. longicornis for time scales ranging from 6 minutes to 66 hours. Using Taylor’s
hypothesis of frozen turbulence, the related spatial scales range between 92 m and 120 km. Note
that applying rescaled range (R/S) analysis (see Section 4.2.6) to the same data set returned a very
similar value for the Hurst exponent; that is, H = 0.34, thus D
H
= 1.66. In contrast, the Hurst expo-
nent derived from power spectrum analysis led to a signicantly lower value for H, H = 0.21 (that
is, D
FFT
= 1.79). This is in agreement with previous studies that showed the potential differences
in the H values returned by R/S analysis (Section 4.2.6), power spectrum analysis (Section 4.2.1),
roughness-length analysis (Section 4.2.3), variogram analysis (Section 4.2.8), and wavelet analysis
(Section 4.2.8); see, for example, Mulligan (2004) for a review. This issue is addressed hereafter in
Section 4.2.10.
4.2.3.2.4 Ecological Interpretation
The fractal dimensions obtained for the temporal distribution of Temora longicornis, bounded
between 1.76 and 1.79, are higher than those expected for passive scalar advected by three-dimen-
sional turbulence (see Section 4.2.1). Those fractal dimensions are also lower than those found
for phytoplankton distribution from in situ time series of in vivo uorescence
([..];D ∈−161167
Seuront et al. 1996a, 1996b, 1999) and from satellite images of sea-surface chlorophyll patterns
([..];D ∈−098169
Denman and Abbott 1988, 1994; Smith et al. 1988). This can be related to the
differences existing between phytoplankton and zooplankton in terms of size and motility, suggest-
ing that copepod behaviors such as diel migration, phototaxis, rheotaxis, social behaviors, and pre-
dation pressure—behaviors relevant at the space and time scales of the present study—induce larger
fractal dimensions (that is, a atter power spectrum and weaker scale dependence) in comparison
with phytoplankton. This is consistent with numerical experiments based on simple predator–prey
formulations considered in a turbulent frame that demonstrated that the interactions between diel
vertical migration and turbulent shear could lead to a atter zooplankton power spectrum (Steele
and Henderson 1992). Similar conclusions were reached by Powell and Okubo (1994) from their
study of interacting plankton populations in two-dimensional turbulence. In addition, the fractal
dimension estimated here from the distribution of T. longicornis is very similar to that estimated for
the oceanic copepod Neocalanus cristatus abundance transects from the subarctic Pacic,
D =180.
(Tsuda 1995), over a similar range of scales (that is, between tens of meters and over 100 kilome-
ters), suggesting that the distribution of zooplankton species could be very similar independent of
their surrounding environments. This is also consistent with the white spectra ( b = 0) found for
total zooplankton density in the St. Laurence estuary (Currie and Roff 2006), leading to fractal
dimension
D → 2.
2782.indb 127 9/11/09 12:09:20 PM
128 Fractals and Multifractals in Ecology and Aquatic Science
4.2.4 si g n a l su m m a T i o n co n v E r s i o n mE T h o d
The signal summation conversion (SSC) method is used to rene the analysis of signals for which
b (power spectrum analysis; see Section 4.2.1 and Figure 4.5) or a (detrended uctuation analysis;
see Section 4.2.2 and Figure 4.13) are near 1. This method is then used to rene fractal analysis
near the fGn/fBm boundary. Taking the cumulative sum of a signal x( t ) converts an fGn to an fBm
signal or an fBm to a summed fBm signal. Corrected scaled windowed variance analyses—that is,
line-detrended scaled windowed variance analysis (ldSWV) or bridge-detrended scaled windowed
variance analysis (bdSWV)—are then applied to the cumulate series to estimate the Hurst exponent
′
H .
When
01<
′
≤H
the signal is an fGn with
HH=
′
.
In contrast, when
1<
′
H ,
the signal is a frac-
tional Brownian motion with
HH=
′
−1.
4.2.5 di s p E r s i o n an a l y s i s
The dispersion analysis, originally introduced using relative dispersion of spatial data
(Bassingthwaighte 1988), was later extended to the temporal domain (Bassingthwaighte and
Raymond 1995). It is very similar to the original scaled windowed variance method but uses the
standard deviation of the windows means (Figure 4.19). Specically, a temporal signal x( t ) is divided
into nonoverlapping windows of size t. The mean
x
i
of each window is computed as:
xxt
i
t
=
=
∑
1
1
τ
τ
()
(4.40)
The standard deviation of the local means is subsequently estimated as:
SD
n
xx
xi
i
n
i
() []
τ
τ
=
−
−
=
∑
1
1
2
1
(4.41)
where n is the number of nonoverlapping windows of size t and
x
τ
the average of the n
x
i
values.
This procedure is iterated for all possible window sizes, and for a fractal signal,
SD
x
i
()
τ
is related
to t following the power-law form:
SD
x
H
i
()
ττ
−1
(4.42)
where H is the Hurst exponent. The dispersion analysis is applicable to fGn signals or to differenti-
ated fBm signals.
4.2.6 rE s c a l E d ra n g E an a l y s i s a n d T h E hu r s T di m E n s i o n , D
H
4.2.6.1 theory
Historically, the rescaled range (R/S) analysis is the rst method developed for assessing H. R/S
analysis was initiated by Hurst (1951) and Hurst et al. (1965) to describe the long-term depen-
dence of water levels in river and reservoirs. Specically, R/S analysis was developed to con-
front the question of how high the Aswan Dam had to be built so that it would contain the
greatly varying levels of the Nile within a given temporal window of size t (Figure 4.20). The
rationale used to develop this method lies behind the three criteria of an ideal reservoir: (1) the
outow is uniform, (2) the water level is the same at the beginning and at the end of the obser-
vation window, and (3) the reservoir never overows. Looking at retrospective records of water
levels, x( t ), Hurst (1951) estimated the time series of the increase in water volume in the dam
as the summed difference of inow and outow, y( t ). The range R of y( t ), R = y
max
( t ) − y
min
( t ),
then denes how high the dam should be built. Finally, dividing the range by the standard devia-
tion of outow uctuations, S(t), Hurst (1951) found that the ratio R/S(t) showed a power-law
2782.indb 128 9/11/09 12:09:27 PM
Self-Affine Fractals 129
relationship with the size of the observation window t as
RS
H
/(),
ττ
where H is the so-called
Hurst exponent. This relation provides a sensitive method for revealing long-run correlations in
random processes. It comes directly from the above and Figure 4.20 that R/S analysis was theo-
retically developed to work on fGn signals (or differentiated fBm signals) but provides irrelevant
results for fBm signals.
R/S analysis can, however, more generally be applied to any regularly sampled temporal signal.
Consider a discrete time series x( t ) and the interval, or window, of length t. Within this window,
one can dene two quantities: R(t), the range taken by the values of x( t ) in the interval t, and S(t),
the standard deviation of the values of x( t ) within the window. R(t) is measured with respect to a
trend in the window, where the trend is estimated as the line connecting the rst and the last points
within the window. R(t) is thus expressed by the following:
RXtXt
t
t
() max(,)min(,)
τττ
τ
τ
=−
≤≤
≤≤
1
1
(4.43)
where X(t, t) is the variable dened as
Xt xt xt
t
(, )(() () )
τ
τ
τ
=−
=
Σ
1
. The mean over the time lag t is
substracted to remove a trend in the window when the expectation of x( t ) is not zero. R(t) is then the
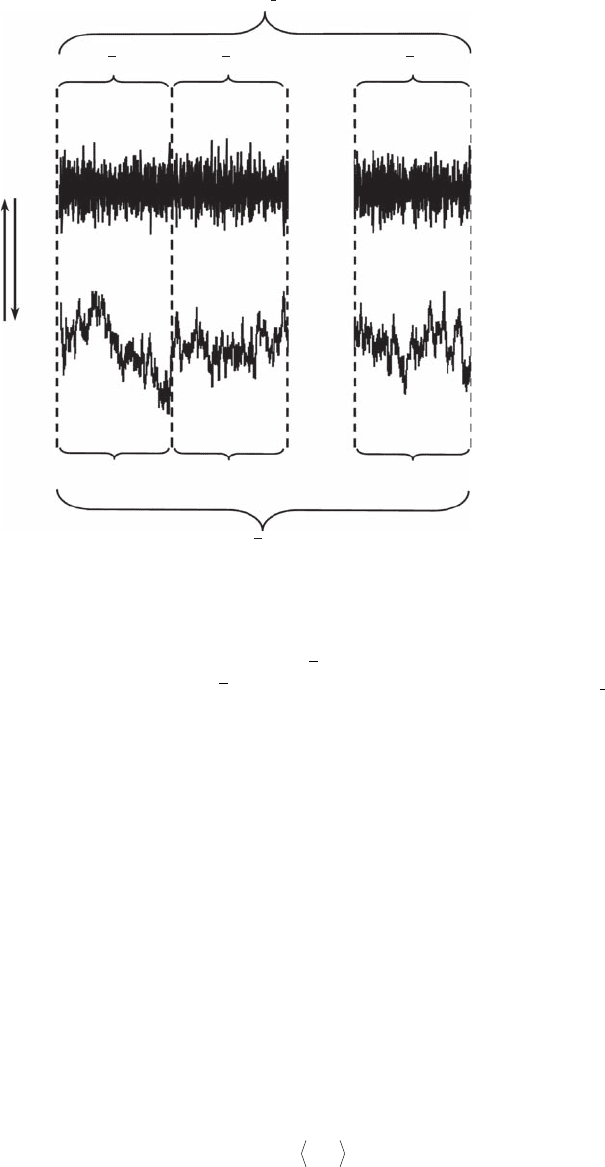
Differenciation
Dispersion Analysis (Disp)
Scaled Windowed Variance Analysis (SWV)
Integration
fBm
fGn
SD
x
i
SD
1
SD
2
SD
n
x
1
x
2
x
n
x
SD
i
Figure 4.19 Principles of the scaled windowed variance (SWV) and dispersional (Disp) methods. SWV
and Disp both use local statistical measures to derive the Hurst exponent H from fractional Brownian motion
(fBm) and fractional Gaussian noise (fGn) signals, respectively. For a given interval size, these local statistical
measures are the standard deviation SD
i
for SWV and the mean
x
i
for Disp, and the related scale-dependent
measures are the mean of local standard deviation
()x
SD
i
and the standard deviation of local means
().SD
x
i
(See Equations 4.37, 4.38, 4.41, and 4.42.)
2782.indb 129 9/11/09 12:09:34 PM
130 Fractals and Multifractals in Ecology and Aquatic Science
self-adjusted range. S(t) is dened as:
Sxtxt
t
() () ()
/
τ
τ
τ
τ
=−
(
)
=
∑
1
2
1
12
(4.44)
A reliable measurement of S(t) requires data with a constant sampling interval, because the expected
difference between successive values of x( t ) is a function of the distance separating them. Here, S(t)
is used to standardize the range R(t) to allow comparisons of different data sets; if S(t) is not used,
the range R(t) can be calculated on data sets that have a nonconstant sampling interval. A discus-
sion of the importance of the division by the standard deviation S(t) to obtain a statistical quantity
of extreme robustness can be found in Mandelbrot and Wallis (1969).
The R/S statistics is subsequently dened as follows:
RS RS/()()/ ()
τττ
=
(4.45)
where R/S(t) is the self-rescaled self-adjusted range. The basis of the method is that, because of self-
afnity, one expects the range taken by the values of x( t ) in a window of length t to be proportional
to the window length to a power equal to the so-called Hurst exponent H following:
R/S(t) = kt
H
(4.46)
Water Level
fGnfBm
SD
Cumulative Difference of Inflow
and Outflow
R
τ
Figure 4.20 Principle of the rescaled range method. The standard deviation (SD) of a fractional Gaussian
noise (fGn) and the range R of the corresponding fractional Brownian motion (fBm) are estimated over a
window of size t. The Hurst exponent H is subsequently estimated as the slope of the power-law relationship
between the ratio between R and SD and the scale of observation t; see Equation (4.46).
2782.indb 130 9/11/09 12:09:38 PM

Self-Affine Fractals 131
where k is a constant. In particular, Feller (1971) proved that the asymptotic behavior for any inde-
pendent random process with nite variance is given by:
R/S(t) = kt
1/2
(4.47)
and are most of the time referred to as “Brownian” processes.
However, many (if not most) processes in nature are not independent random processes but show
signicant long-term correlations. In this case, the asymptotic scaling law is modied and R/S(t) is
asymptotically given by a power law, t
H
. The corresponding exponent H is referred to as the Hurst
exponent, and can be conveniently used to characterize the long-range dependence of a random
variable. A persistent behavior (that is, an increase in the value of the random variable is expected
to be followed by another increase) is characterized by 0.5 < H < 1. An antipersistent behavior (that
is, an increase in the value of the random variable is expected to be followed by a decrease) is char-
acterized by 0 < H < 0.5. Many data on natural phenomena that show persistent behavior can be
found in the literature, including uctuations of argon concentration (Bejar et al. 1995), Rhine and
Nile ush (Mandelbrot and Wallis 1969), and genome organization (Almirantis and Provata 1999).
To contrast with the aforementioned Brownian processes, Mandelbrot (1983) introduced the concept
of “fractional Brownian motion” to describe random processes characterized by Hurst exponents
H such as H ≠ 0.5.
In practice, for a given window length t, one subdivides the input series in a number of inter-
vals of length t, measures R(t) and S(t) in each interval, and calculates R/S(t) as the average ratio
RS()/(),
ττ
as in Equation (4.45). This process is iterated for a number of window lengths, and the
logarithms of R/S(t) are plotted vs. the logarithm of t. If the trace is self-afne, this plot follows a
straight line whose slope equals the Hurst exponent H. The fractal dimension of the trace can then
be calculated following:
D
H
= 2 − H (4.48)
where H is the Hurst exponent and D
H
the Hurst fractal dimension.
Finally, although the R/S analysis described above has been illustrated in the framework of a
temporal random process x( t ), one must note that it can be equivalently applied to any random pro-
cess, recorded in time or in space.
4.2.6.2 example: r/s analysis and river Flushing rates
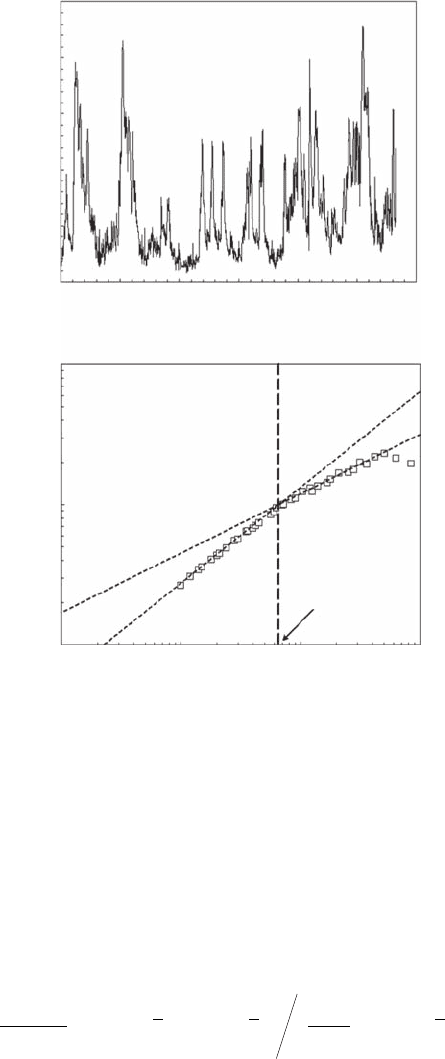
R/S analysis was illustrated using the daily ushing rate of the Seine River (France) from 1993 to
2001 (Figure 4.21A). The resulting log-log plot of R/S(t) vs. t does not follow a straight line over
the whole range of available t, but instead two scaling regions are separated by a clear break for
t = 63 days (Figure 4.21B). The related Hurst exponents are H = 0.67 and H = 0.43 for t < 63 and
t > 63 days, respectively. These exponents reect the presence of both persistence and antipersis-
tence in the Seine water-ow statistics. The corresponding Hurst fractal dimensions are D
H
= 1.33
and D
H
= 1.57. This observation clearly diverges from the water-ow statistics of the Rhine (1808–
1966), which is characterized by its Brownian properties (H ≈ 0.55 and D
H
= 1.45), and also from
the water-level statistics of the Nile (622 to 1469), which show a high degree of persistence, and
H ≈ 0.51 (D
H
= 1.09) (Mandelbrot and Wallis 1969).
4.2.7 au T o c o r r E l a T i o n an a l y s i s
Autocorrelation (AC) functions are widely used in time-series analysis to describe to what extent the
value of a given event, x( t ), of a time series depends on its past values h lag apart, that is, x(t − h); see,
for example, Legendre and Legendre (2003). Autocorrelation functions have, however, rarely been
directly used to estimate the Hurst exponent H and the related fractal dimension.
2782.indb 131 9/11/09 12:09:40 PM
132 Fractals and Multifractals in Ecology and Aquatic Science
The h-lagged autocorrelation coefcient, r(h), denes how strongly the local value of the signal
x( t ) depends on the one h lag before, that is, x(t − h). The h-lagged autocorrelation coefcient is
bounded between −1 and 1. Specically, a positive correlation indicates that the trends of deviation
of x( t ) and x(t − h) relative to the mean of the signal are in the same direction. In contrast, negative
values of r(h) reveal opposite trends of deviation of x( t ) and x(t − h) relative to the mean of the signal,
that is, anticorrelation. The autocorrelation coefcient, r(h), for lags h (h = 0, 1, . . . , n) is dened as:
r
Nh
xt xxth x
N
h
ih
N
=
−−
−−−
−
=+
∑
1
1
1
1
1
(())(( )) (xxt x
t
N
() )−
=
∑
2
1
(4.49)
Using the classical denition of the correlation coefcient (see Feller 1968), van Beek et al. (1989)
derived that in the special case h = 1 the nearest-neighbor correlation between values of an fGn
signal was expressible directly by the correlation coefcient r:
r = 2
r
− 1 (4.50)
2500
A
B
2000
1500
1000
500
0
0 500
R/S (τ)
τ
Flushing Rate (m
3
)
100
10
1
110 100 1000
1000
Time (days)
H = 0.67, r
2
= 0.99
H = 0.43,
r
2
= 0.99
τ
c
= 63 days
1500 2000 2500 3000
Figure 4.21 The Hurst dimension, illustrated using a time series of daily ushing rate of the Seine River
(France) from 1993 to 2001 (A) that clearly show two scaling regimes (B), with D
H
= 1.33 and D
H
= 1.57 for
scales lower and higher than 63 days, respectively.
2782.indb 132 9/11/09 12:09:43 PM
Self-Affine Fractals 133
where the exponent r relates to the Hurst coefcient of the fBm signal whose increments yield
the fGn signal in question as r = 2 H
fGn
− 1. Equation (4.50) has further been extended to correla-
tion between nonadjacent neighbors through the autocorrelation function of an fGn signal with
0 ≤ H ≤ 1 (Bassingthwaighte and Beyer 1991) as:
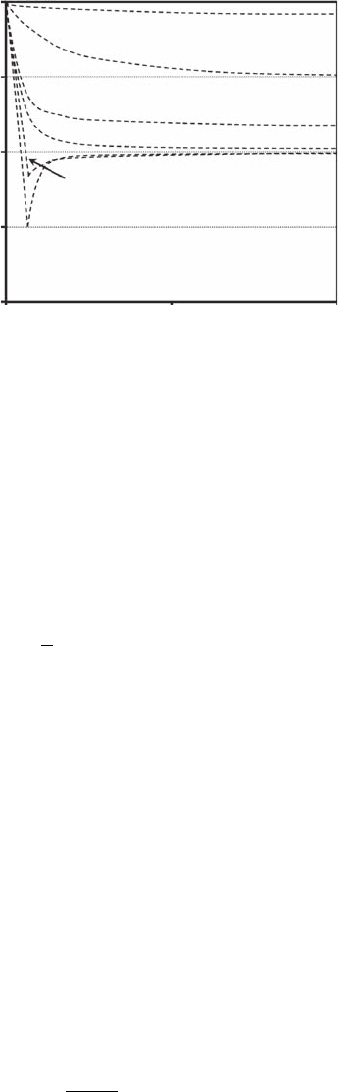
rh hh
h
HH H
=+−+−
1
2
12 1
22 2
(| |||||)
(4.51)
The closer H is to 1, the slower r(h) decays (Figure 4.22), that is, the longer the memory of the
process. More generally, long-memory correlation (or long-term dependence) is for 0.5 < H < 1,
H = 0.5 when there is no correlation in the fGn signal, and when H = 0.5 the fGn signal shows
anticorrelation. Note that Equation (4.51) is applicable to fGn or differenced fBm signals for both
discrete and continuous values of h (Bassingthwaighte and Beyer 1991).
4.2.8 sE m i v a r i o g r a m an a l y s i s
4.2.8.1 theory
Semivariogram (SV) analysis is based on geostatistics and regionalized variables (RV) theory
(Matheron 1971; Journel and Huijbregts 1978), and is applicable to stationary signals. RVs are con-
tinuous variables whose variations are too complex to be described by traditional mathematical
functions (Phillips 1985). Patterns of variation in RVs can then be expressed by their semivariance
g(h) dened as:
γ
()
()
[()( )]
()
h
Nh
xt xt h
t
Nh
=−+
=
∑
1
2
2
1
(4.52)
where x(t + h) is the value of the dependent variable x( t ) at a point separated from point t by distance,
or lag h, and N(h) is the number of pairs of data points separated by the lag h. The semivariogram is
the plot of g (h) as a function of h. The semivariance has, under certain conditions (see, for example,
1.0
0.5
0.0
–0.5
r (h)
–1.0
0
5
h
10
H = 0.60
H = 0.80
H = 0.90
H = 0.99
H = 0.40
H = 0.01
Figure 4.22 The autocorrelation function r(h) of simulated fractional Gaussian noise (fGn) signals with
different Hurst exponents H shown as a function of the lag, h. The correlation is trivially maximum at r( 0) = 1,
and the closer H is to 1, the slower n decays (that is, the longer the memory of the process). Long-term depen-
dence (or long-memory correlation) occurs for 0.5 < H < 1, H = 0.5 when there is no correlation, and when
H < 0.5 the fGn signal shows anticorrelation.
2782.indb 133 9/11/09 12:09:49 PM