Seuront L. Fractals and Multifractals in Ecology and Aquatic Science
Подождите немного. Документ загружается.


134 Fractals and Multifractals in Ecology and Aquatic Science
Berry and Lewis 1980 for further developments), the form of a fractal function that scales with h
4
−
2D
at the origin; the fractal dimension D
v
of the RV x( t ) can then be estimated from the slope m of a
log-log plot of the semivariogram of x( t ):
D
m
v
=
−()4
2
(4.53)
Because semivariogram estimates tend to deteriorate with increasing lag h for nite-length sample
series (that is, greater distances are more affected by low sample sizes and spurious properties of the
data) (Journel and Huijbregts 1978), it is recommend that consideration be given to h values greater
than N(h)/3 to N(h)/2.
4.2.8.2 case study: Vertical distribution of Phytoplankton
in tidally mixed coastal waters
4.2.8.2.1 Ecological Framework
As discussed in Section 4.2.1.3, marine systems exhibit intimate relationships between physical and
biological processes (Legendre and Demers 1984; Mackas et al. 1985), as shown by the coupling
between the distribution of phytoplankton populations and the structure of their physical environ-
ment over a wide range of spatial and temporal scales (Haury et al. 1978). Specically, in tidally
mixed coastal waters such as the eastern English Channel (Figure 4.8), the dissipation of tidal
energy is regarded as responsible for the vertical homogenization of the shallow (50 m maximum
depth) inshore and offshore water masses. However, recent investigations have shown that the
vertical distribution of phytoplankton biomass, regarded as vertically homogenized by vertical
mixing—and then characterized by a mean concentration and its associated variability (that is, the
variance S
2
)—should also be regarded as being vertically structured in terms of fractal dimension
(Seuront and Lagadeuc 1998). Moreover, this fractal structure appears to be both space and time
dependent, in relation respectively with the inshore–offshore hydrological gradient and the tidal
advective processes (Seuront and Lagadeuc 1998). However, these results, based on the analysis of
the data recorded along an inshore–offshore transect and characterized by an extreme intricacy of
space-time scales and processes and by severe limitations in terms of sampling temporal resolution,
led to a lack of generality concerning the processes responsible for the observed structure for both
inshore and offshore locations.
Herein, the goal of this section is to provide a precise quantication of the vertical structure of
phytoplankton distribution at the scale of the high-low tidal cycles and at the scale of neap-spring
tidal cycles for both inshore and offshore waters of the eastern English Channel in order to specify
and generalize preliminary results by Seuront and Lagadeuc (1998).
4.2.8.2.2 Experimental Procedures and Data Analysis
The data set studied in this paper consists of hourly measurements of physical parameters (tempera-
ture, salinity, and light transmission) and in vivo uorescence (an index of phytoplankton biomass)
taken from the surface to bottom with an SBE 25 Sealogger CTD and a Sea Tech uorometer dur-
ing seven sampling experiments (numbered from S1 to S7) conducted between 1993 and April 1997
in different tidal conditions both in offshore and inshore waters of the eastern English Channel
(Figure 4.8; Table 4.4). Current speed and direction were recorded with an Aanderaa current meter
every 5 minutes at different depths (Table 4.4). Water samples were collected from each sampled
depth at 2-hour intervals for data sets S1 to S4 and at 1-hour intervals for data sets S5 to S7, and
chlorophyll a concentrations (1-liter ltered frozen samples, extracted with 90% acetone, assayed
in a spectrophotometer and the chlorophyll a concentration calculated following Strickland and
Parson, 1972) were estimated for each sampled depth.
2782.indb 134 9/11/09 12:09:50 PM

Self-Affine Fractals 135
4.2.8.2.3 Results
Fractal dimensions D
v
were estimated for in vivo uorescence, temperature, and salinity, which exhib-
ited a scaling behavior over the whole range of studied scales, for the whole data set (Figure 4.23).
Their linearity over the whole range of spatial scales illustrates spatial dependence, suggesting that
the same process, or at least similar processes, can be regarded as the source of physical and biologi-
cal patterns, whatever the sampling locations or the hydrodynamical conditions. However, although
the mean fractal dimensions of temperature, salinity, and in vivo uorescence estimated for the whole
data set respectively as 1.52 ± 0.02 (
x ±SD
SD), 1.53 ± 0.02, and 1.63 ± 0.14 were signicantly differ-
ent (Kruskal-Wallis test, p < 0.05), the temperature and salinity fractal dimensions were not signi-
cantly different (Dunn test, p > 0.05; Siegel and Castellan 1988). At the scale of the whole sampling
experiment, the vertical distribution of phytoplankton cells then cannot be regarded as being wholly
driven by vertical mixing. Finally, as previously shown by Seuront and Lagadeuc (1998), it must be
added that light transmission did not exhibit even a partial scaling behavior (that is, its variability is
independent of scale), and therefore could not have been subjected to fractal analysis.
The mean empirical estimates of the fractal dimensions D
v
of temperature, salinity, and in vivo
uorescence estimated for each sampling experiment led to further results (Table 4.5). There were
no signicant differences between salinity and temperature fractal dimensions between sampling
experiments (Kruskal-Wallis test, p > 0.05). On the contrary, in vivo uorescence fractal dimen-
sions were signicantly different (p < 0.05) and exhibited very specic behaviors. Fluorescence
fractal dimensions were consistently signicantly lower for inshore than for offshore locations
(Wilcoxon-Mann-Whitney U-test, p < 0.05), with values ranging from 1.54 ± 0.12 to 1.82 ± 0.07,
respectively. Moreover, correlation analysis demonstrated that uorescence fractal dimensions were
signicantly correlated (p < 0.05) with current direction for each sampling experiment for both
inshore and offshore waters (Table 4.6), except for sampling experiment S1 and S2, characterized
by their very low chlorophyll a concentrations (cf. Table 4.4). There were no signicant correlations
between uorescence fractal dimension and current speed, or between uorescence fractal dimen-
sion and phytoplankton biomass at the scale of the high-low tidal cycles. In contrast, at the scale of
the neap-spring tidal cycles, uorescence fractal dimension exhibited signicant (p < 0.05) positive
correlations with current speed for both inshore and offshore waters (Figure 4.24). In vivo uores-
cence fractal dimensions increased with hydrodynamical conditions. There was also a signicant
correlation (p < 0.05) between mean uorescence fractal dimensions and mean chlorophyll a con-
centrations (Figure 4.25), suggesting a density-dependent control of the vertical fractal structure of
phytoplankton biomass distribution.
table 4.4
characteristics of the seven sampling experiments considered in the Present study
sampling date tidal conditions sampling site
chl. a
( g.l )
1
µµ
−−
n
S1 04/29/93—05/01/93 NT OW 1.50 36
S2 03/20/94—03/21/94 NT IW 1.50 36
S3 09/07/94—09/08/94 ST IW 7.50 24
S4 02/04/96—04/04/96 ST IW 13.80 47
S5 04/6/1996 ST IW 15.00 15
S6 04/7/1996 ST OW 3.00 13
S7 06/21/1998 ST IW 8.40 24
Notes: NT: neap tide; ST: spring tide; OW: offshore waters; IW: inshore waters. Chl. a: chlorophyll a concentration;
N: number of vertical proles.
2782.indb 135 9/11/09 12:09:53 PM
136 Fractals and Multifractals in Ecology and Aquatic Science
–0.5 0.0 0.5
A
B
C
Log h
–5.0
–5.2
–5.4
–5.6
–5.8
–6.0
–6.2
–6.4
–6.6
Log γ (h)
–5.0
–5.2
–5.4
–5.6
–5.8
–6.0
–6.2
–6.4
–6.6
Log γ (h)
0.1
0.0
–0.1
–0.2
–0.3
–0.4
–0.5
Log γ (h)
1.0
–0.5 0.0 0.5
Log h
1.0
–0.5 0.0 0.5
Log h
1.0
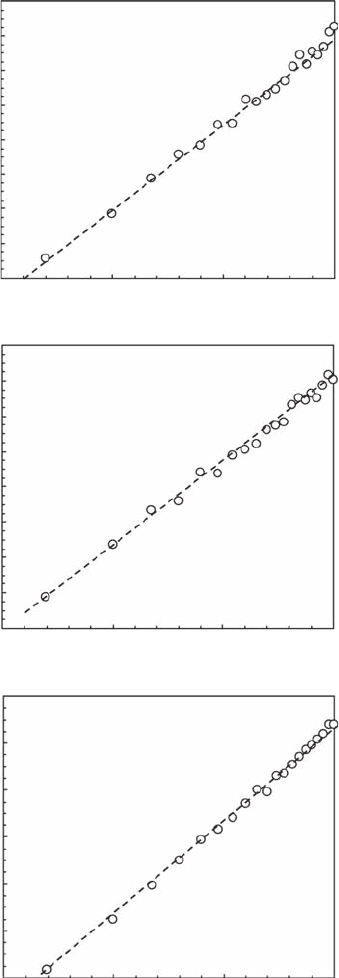
Figure 4.23 Double logarithmic semivariograms of temperature (A), salinity (B) and in vivo uorescence (C)
for sampling experiment S1, shown together with their best tting line. The fractal dimension D
v
is estimated
as D
v
= (4 − m)/2, where m is the slope of the log-log plot of the empirical semivariance g (h) vs. the lag h,
in a log-log plot. Here, m = 1.01 (r
2
= 0.99), 0.99 (r
2
= 0.97), and 0.4 (r
2
= 0.99) for temperature, salinity, and
uorescence, respectively.
2782.indb 136 9/11/09 12:09:57 PM

Self-Affine Fractals 137
4.2.8.2.4 Ecological Interpretation
The fractal dimensions D
v
estimated over the whole range of available spatial scales suggest that
the scales of spatial dependence are very similar for in vivo uorescence, salinity, and tempera-
ture, indicating similar sources of physical and biological patterns. However, the differences shown
between fractal dimensions of temperature, salinity, and uorescence fractal dimensions suggest
that the vertical distribution of phytoplankton cells is very specic and cannot be regarded as being
passively advected by mixing processes, even when chlorophyll a concentrations are very low, as
it is the case for sampling experiments S1 and S2 (cf. Table 4.5). Thus, as shown by the correlation
analysis, fractal dimensions of temperature and salinity are tidally and geographically independent,
as opposed to uorescence fractal dimensions, which are (1) signicantly higher in offshore loca-
tions, (2) dependent on the current direction at the scale of the high-low tidal cycle, (3) dependent
on the current speed at the scale of the neap-spring tidal cycles, and (4) dependent on phytoplankton
concentration at the biological annual cycle. The vertical structure of the phytoplankton biomass
is then more homogeneous, or less structured, in offshore locations and during ood tide, but also
when hydrodynamical conditions are high and phytoplankton concentrations are low, showing that
the structure of the vertical distribution of phytoplankton biomass is determined by different pro-
cesses following the implied temporal scales.
table 4.5
mean Fractal dimension of temperature, salinity, and In Vivo Fluorescence Vertical
Profiles for the seven sampling experiments
temperature salinity In Vivo Fluorescence
S1 1.50 (0.05) 1.52 (0.04) 1.82 (0.07)
S2 1.52 (0.06) 1.53 (0.05) 1.63 (0.09)
S3 1.54 (0.03) 1.50 (0.04) 1.57 (0.09)
S4 1.52 (0.04) 1.54 (0.06) 1.46 (0.12)
S5 1.53 (0.05) 1.53 (0.04) 1.54 (0.10)
S6 1.49 (0.03) 1.52 (0.05) 1.82 (0.06)
S7 1.53 (0.04) 1.55 (0.06) 1.56 (0.10)
Note: The numbers in parentheses are the standard deviations.
table 4.6
spearman’s rank correlation coefficients between in vivo Fluorescence Fractal
dimensions D and current direction (D/c
direction
), current speed (D/c
speed
),
and mean chlorophyll a concentration (D/chl. a)
d/c
direction
d/c
speed
d/chl. a
S1 0.22 0.22 0.10
S2 0.19 –0.10 0.20
S3 0.76 ** –0.33 0.01
S4 0.79 ** –0.14 –0.19
S5 0.95 ** –0.12 0.36
S6 0.80 **
-0.20 -0.37
S7 0.89 **
-0.13
0.28
** 1% Signicance level.
2782.indb 137 9/11/09 12:09:58 PM
138 Fractals and Multifractals in Ecology and Aquatic Science
These results conrm and generalize previous studies conducted in the same environment
(Seuront and Lagadeuc 1998). In particular, with uorescence fractal dimensions higher for offshore
than for inshore waters, these differences could be associated to a purely density-dependent effect
(Seuront and Lagadeuc 1998), to a qualitative effect relative to the specic composition of phyto-
plankton assemblages (Trufer et al. 1997; Peta et al. 1998), or to a combination of the two previous
hypothesized phenomenologies. Whatever that may be, an increase in uorescence fractal dimen-
sions should have been expected during ood tide because of the offshore water advection associated
with the semidiurnal M2 tidal component, instead of the signicant decrease generally observed.
At the scale of the high-low tidal cycles, it can then be suggested that the observed differential tidal
structure of phytoplankton distribution could be associated with the differential mixing occurring
during a tidal cycle between water masses qualitatively and quantitatively different in terms of
1.90
1.80
1.70
1.60
1.50
40 50 60
Current Speed
Fractal Dimension D
F
70 80 90
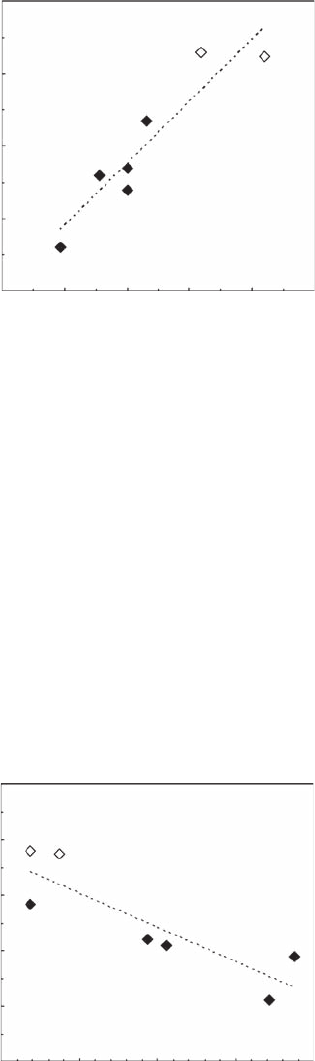
Figure 4.24 Relationship between the fractal dimensions D
v
estimated for in vivo uorescence vertical
proles and the speed of the tidal current (m s
–1
) for inshore (black dots) and offshore waters (open dots) of
the eastern English Channel. The best linear t between D
v
and current speed (dotted line) is signicant at the
5% condence level.
1.95
1.85
1.75
1.65
1.45
1.55
048
Chl. a (µg l
–1
)
Fractal Dimension D
F
12 16
Figure 4.25 Relationship between the fractal dimensions D
v
estimated for in vivo uorescence vertical
proles and chlorophyll a concentration for inshore (black dots) and offshore waters (open dots) of the eastern
English Channel. The best linear t between D
v
and chlorophyll a concentration (dotted line) is signicant at
the 5% condence level.
2782.indb 138 9/11/09 12:10:01 PM
Self-Affine Fractals 139
phytoplankton populations that could then be regarded as a secondary source of heterogeneity. On the
other hand, at the scale of the neap-spring tide cycles, phytoplankton distributions appear controlled
by hydrodynamical conditions; high hydrodynamical conditions lead to more homogeneous distribu-
tions characterized by high fractal dimensions. Finally, comparisons between mean fractal dimen-
sions of uorescence and mean chlorophyll a concentrations for each sampling experiment conrm
the density-dependent control of phytoplankton structure proposed by Seuront and Lagadeuc (1998)
as a potential explanation of the different fractal dimensions observed for the vertical distribution
of phytoplankton biomass between inshore and offshore waters. In particular, this means that the
heterogeneity of phytoplankton is all the more high as its density is high, and the observed density-
dependence could be a consequence of the aggregation processes of phytoplankton cells, mainly
driven by phytoplankton density and hydrodynamism (see, for example, Kiørboe 1997).
4.2.9 wa v E l E T an a l y s i s
This method is only briey described here, as the interested reader can refer to Dremin et al. (2004)
and Fisher et al. (2004) for an introduction on the subject, and to Arnéodo et al. (1995), Jones et al.
(1996), and Simonsen et al. (1998) for details on different wavelet methods to estimate the Hurst
exponent H. Briey put, a wavelet is a waveform of limited duration with an average value of zero.
Although Fourier analysis breaks up a signal into cosine wave components of various frequencies,
wavelet analysis decomposes a signal into shifted and stretched versions of the original wavelet.
Wavelets are then parametrized by a scale parameter (a > 0) and a translation parameter (−∞ < b < ∞)
that are incorporated into one single function y(x) as (for example, Simonsen et al. 1998):
ψψ
ab
x
xb
a
,
()=
−
(4.54)
The wavelet transform of a signal x( t ) is then dened as:
Wab
a
txtt
xab
(,)()()
,
*
=
−
∫
1
ψ
d
(4.55)
where y
*
a, b
( t ) is the complex conjugate of y
a, b
( t ). It comes from Equation (4.1) that any self-afne
signal x( t ) scales with the time scale t a s :
xt
H
()
τ
τ
(4.56)
Incorporating Equation (4.56) into Equation (4.55) leads to:
Wa a
x
w
()
(4.57)
where
wH=+
1
2
,
and
Wa Wab
xx
b
() (, )=
is the average of W
x
(a, b) over all location parameters b.
This method, referred to as the average wavelet component (AWC) (Simonsen et al. 1998) has been
proven to be very useful in time-series analysis (Simonsen 2003) and basically consists in nding
a representative wavelet amplitude for a given scale a. The exponent H is then estimated from the
slope of W
x
(a) versus a on a log-log scale. The exponent H obtained from the time series of the abun-
dance of the calanoid copepod Temora longicornis (Figure 4.18B) using power spectrum analysis
(Figure 4.26A) and the AWC method (Figure 4.26B) are statistically undistinguishable. Note that
this method can be applied to fBm signals or to cumulatively summed fGn signals.
2782.indb 139 9/11/09 12:10:05 PM
140 Fractals and Multifractals in Ecology and Aquatic Science
It is nally stressed that wavelet-based spectra might be a preferable approach because wavelets
are localized, in contrast to the innite sine waves used in Fourier analysis, and can thus be directly
applied to data that are anisotropic and nonstationary, resulting in one-dimensional series that have
both inherent directionality and trend (Malamud and Turcotte 1999).
4.2.10 as s E s s m E n T o F sE l F -aF F i n E mE T h o d s
4.2.10.1 comparing self-affine methods
Despite the dichotomy between fGn and fBm signals (see Section 4.1.5) and the related analysis
techniques to be chosen to estimate the Hurst exponent H (Figure 4.27 and Figure 4.28), the fractal
measures reported in this chapter relate to each other in a simple manner as shown in Table 4.7.
However, inconsistencies between fractal measures can be found in the literature. For instance, a
recent paper by Sims et al. (2008) that identied a consistent power law in the foraging behaviors
of a range of marine predators reported mean values of a = 1. 0 8 a nd b = 0.8 for the diving time
series of the ve species they considered. However, from Table 4.7, it readily comes that b = 2 a − 1,
which is not the case here. Similarly, for the same krill abundance time series, they contradic-
torily report a = 0.9 a n d b = 0.3. A successful and meaningful fractal analysis requires that
Log f (Hz)
2.5
A
B
1.5
° = 1.42 (r
2
= 0.89)
Slope = 0.72 (r
2
= 0.98)
0.5
–0.5
–1.5
–2.5
Log E ( f )
–1.5
–2.5
–3.5
–4.5
Log W
x
(a)
–5.5 –5 –4.5 –4 –3.5 –3 –2.5
Log a
–5.5 –5.0 –4.5 –4.0 –3.5 –3.0 –2.5
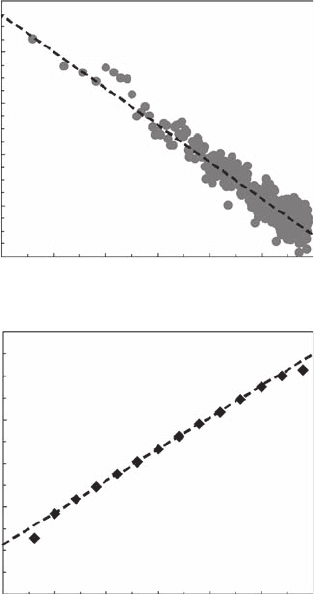
Figure 4.26 Hurst exponents estimated using power spectrum analysis (A) and the average wavelet com-
ponent (AWC) (B). The power spectrum Hurst exponent is estimated from Equation (4.13) as (b − 1)/2 = 0.21
(Section 4.2.1.1); and the wavelet Hurst exponent from Equation (4.57) as w − 1/2 = 0.22.
2782.indb 140 9/11/09 12:10:08 PM
Self-Affine Fractals 141
Signal, Q(t)
Descriptive Statistics
Fractal Analysis
PSA
Signal Class
Stationary
Q(t) is fGn
Nonstationary
Q(t) is fBm
β > 1
H > 1H < 1
β < 1
β = 1
β = 1
PSAPSA
AC
H
AC
H
R/S
H
Disp
H
SV
H
SWV
H
AW C
H =
H
fGn
= H
i
(β + 1)
2
R/S Disp SV
SWVAWC
Not
Fractal
Undefined
fGn or fBm
SSC
ldSWV
bdSWV
No Class
H =
(β – 1)
2
H
fBm
= H
i
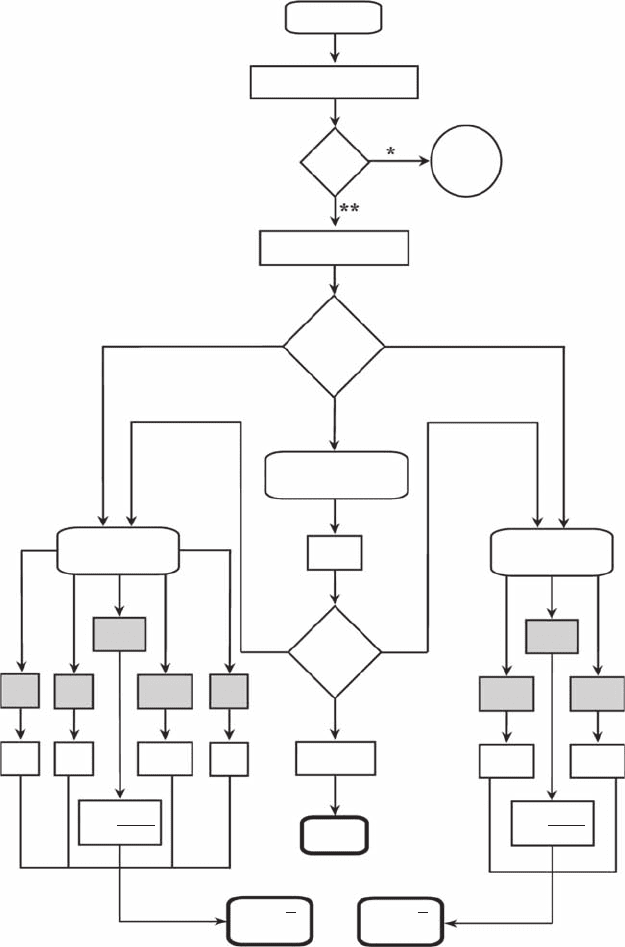
Figure 4.27 Flowchart for fractal analysis initiated through power spectrum analysis (PSA). First, power
spectrum analysis is used to assess the existence of a power-law behavior, in which case the class to which the
data set belongs (fGn or fBm) is identied using the value of the PSA exponent b. The signal is then analyzed
with methods appropriate for fGn or fBm, and the average of method-specic H values is considered as the
most reliable estimate of the Hurst exponent of the original signal. (*: a signal is considered as nonfractal in
the absence of power-law behavior and when the power-law behavior spans less than 1 decade; **: a signal is
considered as fractal in the presence of a power-law behavior spanning more than one decade, ideally more
than two decades; AC: autocorrelation analysis; R/S: rescaled range analysis; Disp: dispersional analysis; SV:
semivariogram analysis; SWV: scaled windowed variance analysis; AWC: average wavelet analysis; SSC: signal
summation conversion method; ldSWV: line-detrended scaled windowed analysis; bdSWV: bridge-detrended
scaled windowed analysis.)
2782.indb 141 9/11/09 12:10:11 PM
142 Fractals and Multifractals in Ecology and Aquatic Science
Signal, Q(t)
Descriptive Statistics
Fractal Analysis
DFA
Signal Class
Stationary
Q(t) is fGn
Nonstationary
Q(t) is fBm
α > 1
H > 1H < 1
α < 1
α = 1
α = 1
DFA
DFA
AC
H
AC
H
R/S
H
Disp
H
SV
H
SWV
H
AW C
H
fGn
= H
i
R/S
Disp
SV
SWVAWC
Not
Fractal
Undefined
fGn or fBm
SSC
ldSWV
bdSWV
No Class
H = α
DFA
– 1
H = α
DFA
H
fBm
= H
i
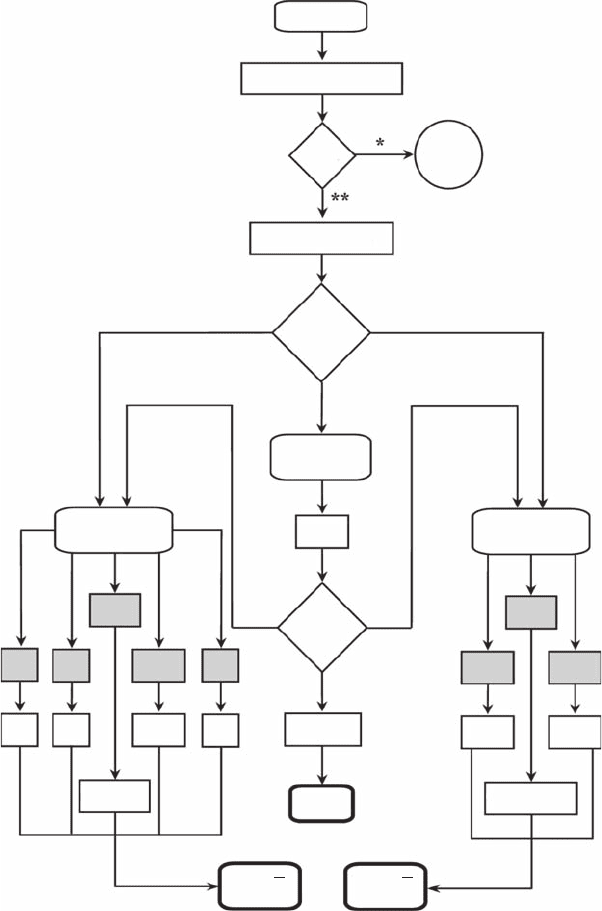
Figure 4.28 Flowchart for fractal analysis initiated through detrended uctuation analysis (DFA). First,
detrended uctuation analysis is used to assess the existence of a power-law behavior, in which case the class
to which the data set belongs (fGn or fBm) is identied using the value of the DFA exponent a. The signal is
then analyzed with methods appropriate for fGn or fBm, and the average of method-specic H values is con-
sidered as the most reliable estimate of the Hurst exponent of the original signal. (*: a signal is considered as
nonfractal in the absence of power-law behavior and when the power-law behaviour spans less than 1 decade;
**: a signal is considered as fractal in the presence of a power-law behavior spanning more than one decade,
ideally more than two decades; AC: autocorrelation analysis; R/S: rescaled range analysis; Disp: dispersional
analysis; SV: semivariogram analysis; SWV: scaled windowed variance analysis; AWC: average wavelet anal-
ysis; SSC: signal summation convertson method; ldSWV: line-detrended scaled windowed analysis; bdSWV:
bridge-detrended scaled windowed analysis.)
2782.indb 142 9/11/09 12:10:14 PM

Self-Affine Fractals 143
fractal measures returned by different methods be consistent with each other. In addition, due to
the dichotomy between fGn and fBm signals that underlie the choice of an appropriate analysis
(Figure 4.27 and Figure 4.28), a reliable and meaningful fractal analysis will be achieved through
the following steps:
1. Identify the class of the signal using either power spectrum analysis (Section 4.2.1,
Figure 4.5) or detrended uctuation analysis (Section 4.2.2, Figure 4.13).
2. Analyze the signal with different methods, and take the average of the resulting H values
as the most reliable estimate of the Hurst exponent (Figure 4.27 and Figure 4.28).
3. Systematically report estimates of the Hurst exponent H along with the following:
a. The class of the signal as H
fGn
and H
fBm
.
b. The numerical method used to estimate H
fGn
and H
fBm
.
4.2.10.2 From self-affinity to intermittent self-affinity
It is, however, implicit from the content in this chapter that all of the above methods return relevant
results if the signals to be analyzed belong to fGn or fBm signal class. Instead, many natural phe-
nomena are characterized by their deviation from “Gaussianity” and are characterized by local,
sharp uctuations over a wide range of low-density values (Figure 4.29A). In the context of those
intermittent signals, the linear relationship assumed between, for example, the spectral exponent
b and the Hurst exponent H—that is, H
fBm
= (b − 1)/ 2 (see Equation 4.13) and H
fGn
= (b + 1)/ 2
(see Equation 4.14)—does not hold anymore. Because the power spectrum signatures of a frac-
tional Brownian motion and intermittent fractional Brownian motion do not signicantly differ
(Figure 4.29B), the identication of the class to which a data set belongs requires the dichotomy
between fractional Brownian motion (fBm) and intermittent fractional Brownian motion (ifBm).
This can be achieved using the qth-order structure functions that are an empirical generalization
to high orders of moments in physical space of the power spectrum. The structure functions are
dened as
|()|
()
∆Q
qq
ττ
ς
(4.58)
table 4.7
correspondence between the characteristic exponents derived through methods for self-
affine Fractals and the hurst exponents of fbm, H
fBm
, fgn, and H
fGn
technique exponent hurst exponent
H
fBm
H
fGn
Power spectrum analysis
b
2H
fBm
+1 2H
fGn
−1
Detrended uctuation analysis
a
H
fBm
+1
H
fGn
Scaled windowed variance analysis H H
fBm
—
Dispersional analysis H — H
fGn
Rescaled range analysis H — H
fGn
Autocorrelation analysis
r
—
2 H
fGn
−1
Semivariogram analysis m — 2H
fGn
Average wavelet component analysis w 1/2 + H
fBm
—
2782.indb 143 9/11/09 12:10:16 PM