Saltzman B. (editor) Anomalous Atmospheric Flows and Blocking
Подождите немного. Документ загружается.

224
A.
SPERANZA
properties of multiple baroclinic equilibrium states obtained with a linear
resonance theory (as in Charney and Straus,
1980)
are not of the type re-
quired: the only state stable with respect to orographic baroclinic instability
is
the subresonant (“blocked”) state where the minimal dynamical is ulti-
mately bound
to
reside independently of the initial condition.
The same concepts (resonance folding due to wave self-interaction, etc.)
that appear of
key
importance in allowing the fitting ofthe observed statistics
in the barotropic
case
can
be
applied to baroclinic models by means of
straightforward, albeit somewhat lengthy, calculations. In such a model the
mountain forcing does not play a direct role but acts only as a symmetry-
breaking boundary modulation, catalyzing baroclinic conversion at ultra-
long wavelengths.
Introduction of wave nonlinearity in the minimal baroclinic system
allows not only production of multiple-equilibrium states (which, although
differing appreciably in wave amplitude, are confined within a limited range
of variation
of
mean momentum and baroclinicity), but also adjustment
of
(through resonance bending) the stability properties to the required charac-
teristics of stability: two stable extreme states and one intermediate, unstable
state with respect to orographic baroclinic instability.
Such considerations are not intended to signify that the type of minimal
systems just sketched can exhaust the problematics of low-frequency varia-
bility. Many more problems have to be faced, in particular those connected
with the interaction of ultralong waves with synoptic-scale disturbances.
However, we think we have enough evidence to conclude that the full
range of nonlinear effects has yet to
be
thoroughly analyzed and that these
effects should
be
further studied before they are used to draw final conclu-
sions about what goes under the name of “multiple-equilibria theory.”
REFERENCES
Benzi,
R.,
Hansen, A.
R.,
and Sutera,
A.
(1984a).
On
stochastic perturbation ofsimple blocking
models.
Q.
J.
R.
Meteorol.
Soc.
110,
393-409.
Benzi,R.,
MaIguzzi, P., Speranza,
A.,
and Sutera,
A.
(1
984b). On the theory ofstationary waves
and blocking.
Q.
J.
R.
Meteorol.
Soc.,
July.
Benzi.
R.,
Speranza,
A.,
and Sutera,
A.
(1985).
A
minimal baroclinic theory of low-frequency
variability
in
the Northern-Hemisphere.
J.
Almos.
Sci..
submitted.
Buzzi,
A,,
Speranza,
A..
and Trevisan,
A.
(1984). Instabilities of a baroclinic flow related
to
topographic forcing.
J.
Atmos.
Sci.
41,637-650.
Charney,
J.
G.,
and DeVore,
J.
G.
(1979). Multiple flow equilibria in the atmosphere and
blocking.
J.
Atmos.
Sci.
36,
1205-
12
16.
Charney.
J.
G.,
and Straus,
D.
M. (1980). Formdrag instability, multiple equilibria and propa-
gating planetary waves in baroclinic, orographically forced, planetary wave systems.
J.
Atmos.
Sci.
31,
1157-
1176.
PROPERTIES
OF
MIDDLE LATITUDE CIRCULATION
225
Charney,
J.
G.,
Shukla,
J.,
and Mo, K. C.
(1981).
Comparison ofa barotropic blocking theory
Chen,
T.
C.
(1982).
A
further study of spectral energetics in the winter atmosphere.
Mon.
Chen,
T.
C.,
and Marshall,
H.
G.
(
1984).
Time variation of atmospheric energetics in the FGGE
Egger,
J.
(1
98
1).
Stochastically driven large-scale circulation with multiple equilibria.
J.
Atmos.
Hart,
J.
E.
(1979).
Barotropic, quasi-geostrophic flow over anisotropic mountains.
J.
Atmos.
Holopainen, E.
0.
(1970).
An observational study of the energy balance of the stationary
disturbances in the atmosphere. Q.
J.
R. Meteorol.
Soc.
96,626 -644.
Legras, B., and Ghil, M.
(1983).
Blocking and variations in atmospheric predictability.
In
“Predictability of Fluid Motion”
(G.
Holloway and B.
J.
West, eds.). American Inst. of
Physics,
N.
106.
Malanotte Rizzoli, P., and Malguzzi, P.
(1984).
Nonlinear stationary Rossby waves over non-
uniform zonal winds and atmospheric blocking. Part
I:
The analytical theory.
J.
Atmos.
Sci.
41,2620-2628.
Malguzzi, P., and Speranza, A.
(1
98
1).
Local
multiple equilibria and regional atmospheric
blocking.
J.
Atmos.
Sci.
38,
1939- 1948.
Pedlosky,
J.
(1964).
The stability
of
currents in the atmosphere and the ocean. Part
I.
J.
Atmos.
Sci.
21, 201-219.
Pedlosky,
J.
(1981).
Resonant topographic waves in barotropic and baroclinic flows.
J.
Atmos.
Sci.
38,2626-2641.
Pierrehumbert, R.
T.,
and Malguzzi, P.
(1984).
Forced coherent structures and local multiple
equilibria in a barotropic atmosphere.
J.
Atmos.
Sci.
41,246-257.
Rambaldi,
S.,
and Mo, K. C.
(1
984).
Forced stationary solutions in a barotropic channel:
Multiple equilibria and theory of non-linear resonance.
J.
Atmos.
Sci.
41,3 135-3146.
Reinhold, B. B., and Pierrehumbert, R. T.
(1982).
Dynamics ofweather regimes: Quasi-station-
ary waves and blocking.
Mon. Weather Rev.
110,
1105-
1145.
Speranza, A.,
Buzzi,
A., Trevisan, A., and Malguzzi, P.
(1985).
A
theory ofdeep cyclogenesis in
the
lee
of the Alps: Modifications of baroclinic instability by
localized
topography.
J.
Amos.
Sci.
42, 1521
-
1535.
Tung,
K.
K.,
and Lindzen, R.
S.
(1979a).
A
theory of stationary long waves. Part I:
A
simple
theory
of blocking.
Mon. Weather Rev.
107,714-734.
Tung,
K.
K.,
and Lindzen, R.
S.
(1979b).
A theory of stationary long waves. Part 11: Resonant
Rossby waves in the presence of realistic vertical shears.
Mon. Weather Rev.
107,735
-
750.
Yoden,
S.
(
1983).
Nonlinear interactions in a two-layer, quasi-geostrophic, low-order model
with topography.
J.
Meteorol.
Soc.
Jpn.
61,
1
-
18.
Wiin-Nielsen, A.
(1979).
Steady states and stability properties of a
low
order barotropic system
with forcing and dissipation.
Tellus
31, 375-386.
with observation.
J.
Atmos.
Sci.
38,762-779.
Weather Rev.
110,947-961.
winter.
Tellus
36A,
25 1-268.
Sci.
38,2606 -26 18.
Sci.
36, 1736
-
1746.

This Page Intentionally Left Blank
PROBABILITY DENSITY DISTRIBUTION
OF
LARGE-SCALE ATMOSPHERIC FLOW
ALFONSO
SUTERA
The Center for Environment and
Man
Hartford, Connecticut
061
17,
and
Department
of
Geology and Geophysics
Yale University
New Haven, Connecticut
0651
1
1.
INTRODUCTION
Whether the large-scale atmospheric motion undergoes temporal varia-
tions about more than one dynamical regime is a question with both theoret-
ical and practical relevance. In fact, if we suppose that more than one regime
occurs, then the mean state of the atmosphere would not be adequately
represented by its long-term average, but rather by the set
of
average states
obtained by considering, separately, each individual regime. As another
consequence of this hypothesis, it is apparent that transition from one re-
gime to the others would be conditioned by the initial state,
so
that long-term
forecasts would be more strongly dependent on initial conditions than in the
case in which one single mode occurs (Moritz and Sutera, 1981; Leith,
1978). This question has received more renewed attention recently since
simple models (for instance Charney and DeVore, 1979)
of
atmospheric
motions have shown the possibility that more than one equilibrium regime is
consistent with the equations considered. Efforts to connect these theoretical
studies with observations have been described by a few authors (White,
1980; Hartman and Gahn, 1980; Charney
et
al.,
1981; Dole and Gordon,
1983). All of these agreed that the observational evidence supporting the
theoretical models in their essential prediction- i.e., the existence
of
multi-
ple regimes
-
was sparse. In this article, we address the same question. We
find, contrary to these recent studies, that in the context of the data as here
considered, there is evidence that the large-scale dynamics of the atmosphere
are consistent with the presence ofmore than one regime (in some sense that
will be explained later). In one regime the planetary-scale waves have large
amplitude; in another the same waves do not show appreciable amplitude.
A
posteriori,
we find that events falling into the first group can be associated
with what from a synoptic and subjective point of view would resemble
major blocking episodes. This result does not contradict, when examined in
227
Copynght
0
1986
by Academic
Press,
Inc.
AU
rights
of
reproduction
in
any
form
reserved.
ADVANCES
IN
GEOPHYSICS,
VOLUME
29
228
ALFONSO
SUTERA
detail, the previously mentioned studies. When we consider the specific state
variables of those studies, we confirm the results of their authors. Hence, the
different conclusions we have reached have their source in our having con-
sidered different variables. In Section
2,
we describe the process that has led
us to consider this particular set of variables rather than any other. The data
source and its processing are described in Section
3.
In Section
4,
we illustrate
the technique employed to calculate the probability density associated with
our random sample set. In Sections
5
through
8,
we present our principal
results. Conclusions and some speculations drawn from them are offered in
Section
9.
2.
THEORETICAL
BACKGROUND
To
illustrate the ideas which guided our observational study, it is worth-
while to recall
a
few basic concepts about the theory of orographically in-
duced stationary waves in the atmosphere, within the framework of a simple
model that we borrow from Benzi
et
al.
(1986)
(see
also
A.
Speranza, this
volume), and that we slightly modify for our present purposes. Let us con-
sider a barotropic atmosphere confined to a khannel and flowing over a
topography that will
be
here considered the only relevant inhomogeneity of
the earth's surface. The governing equation expresses the conservation of
potential vorticity. In this
case,
the potential vorticity,
q,
is defined as
4
=
AY
+
PY
+
(fo/H)h
(1)
where
y
is
the streamfunction, the latitudinal derivative of the Coriolis
force,
fo
the Coriolis parameter at
45"N
latitude,
H
the equivalent atmo-
spheric depth, and
h
the surface elevation. Hence the equation of motion is
(2)
If
we split the streamfunction into its zonal average
v/
and the departure
4,
we have
a,
q
+
J(
y,q)
=
dissipation
Y=W+4
(3)
Let us assume that
W
=
-Uy.
In this case the governing equation
is
+
Jtrb,
(foh/H)]
+
U(h/H)
d,h
=dissipation
(4)
VI
VII
If
we
neglect in
Eq.
(4)
all
but the linear terms
I,
111,
IV,
and
VII,
we get
a,A4
+
p
ax4
+
U
d-4
+
U
+
(US,/H)
a,h
=
dissipation
(5)
DENSITY DISTRIBUTION
OF
ATMOSPHERIC
FLOW
229
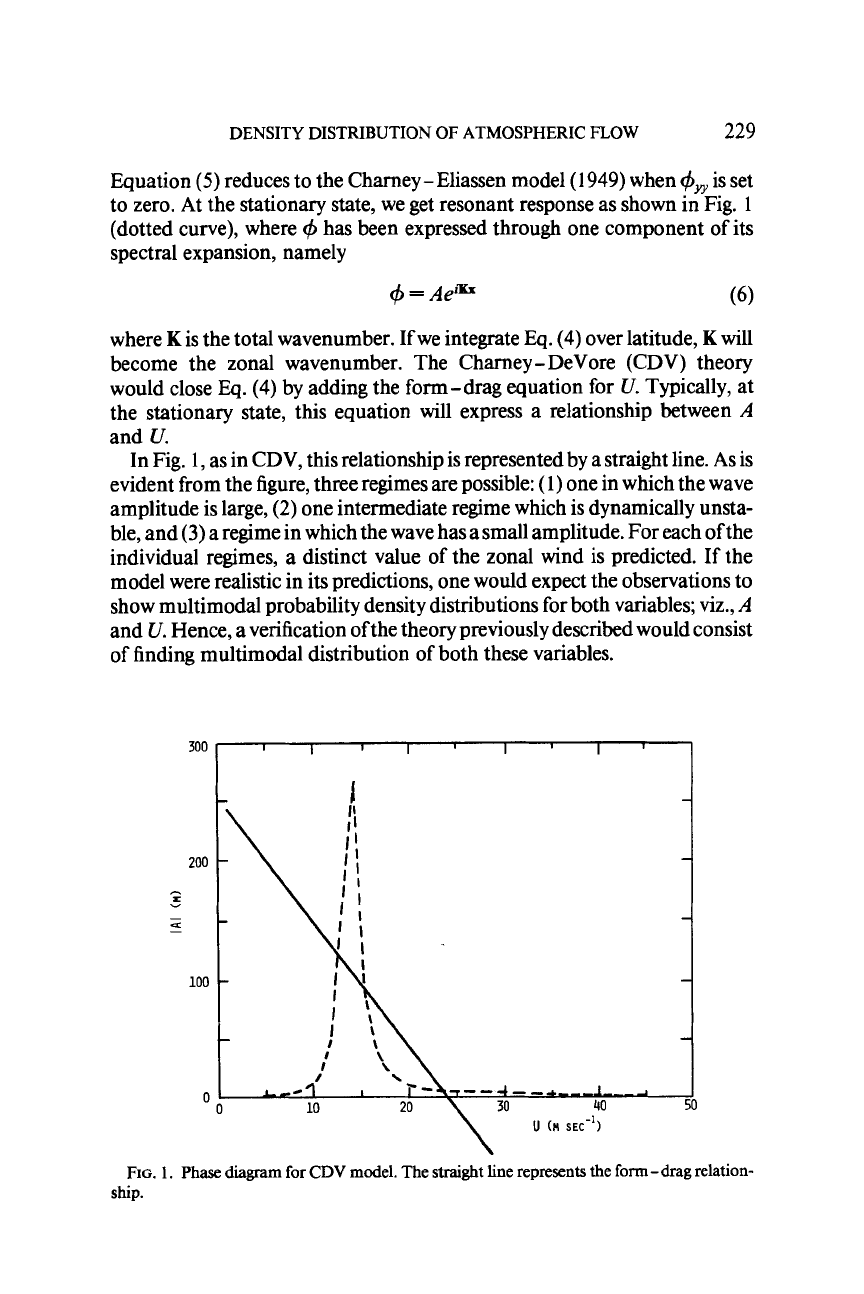
Equation
(5)
reduces
to
the Charney
-
Eliassen model
(1
949) when
&,,
is set
to zero. At the stationary state, we get resonant response as shown in Fig.
1
(dotted curve), where
4
has been expressed through one component
of
its
spectral expansion, namely
4
=
Ae*=
(6)
where
K
is the total wavenumber.
If
we integrate Eq.
(4)
over latitude,
K
will
become the zonal wavenumber. The Charney -DeVore (CDV) theory
would close
Eq.
(4)
by adding the form-drag equation for
U.
Typically, at
the stationary state, this equation will express a relationship between
A
and U.
In Fig.
1,
as in CDV, this relationship is represented by a straight line. As is
evident from the figure, three regimes are possible:
(1)
one in which the wave
amplitude is large, (2) one intermediate regime which is dynamically unsta-
ble, and
(3)
a
regime in which the wave has a small amplitude. For each
of
the
individual regimes, a distinct value
of
the zonal wind is predicted.
If
the
model were realistic in its predictions, one would expect the observations to
show multimodal probability density distributions for both variables;
viz.,
A
and
U.
Hence, a verification of the theory previously described would consist
of finding multimodal distribution of both these variables.
300
200
-
v
S
-
U
-
100
I
I
I
1
I
I
I
FIG.
1.
Phase diagram
for
CDV
model. The straight line represents the form-drag relation-
ship.
230
ALFONSO
SUTERA
3.
THEDATA
The Charney-Eliassen equation, Eq.
(4),
has long been thought to be a
good representation of the
gross
features of the Northern Hemisphere's
midlatitude winter circulation; hence, we considered data including four
winters where winter is artificially defined as the period extending from
1
December through
28
February. Equation
(4)
has been often applied to the
500-mbar surface (Charney and DeVore,
1979).
So
we consider data at the
500-mbar level. Finally, since
Eq.
(4)
assumes geostrophic motion, the
streamfunction is properly represented by the geopotential gZ, where
g
is
gravity. Consequently, our analyses will be concerned with samples deduced
from the 500-mbar geopotential height. The data, originally archived in the
form
of
spherical harmonic coefficients, were retrieved and then interpo-
lated onto a regularly spaced latitude-longitude grid with a
5.625'
resolu-
tion in each direction. After the data were
so
prepared, the following prepro-
cessing was performed:
1.
For each day an average over a latitude band (in our case a straight
algebraic mean) was calculated, obtaining a 64dimensional array. It was
then projected onto Fourier space by employing a standard fast Fourier
transform. Although the results described hereafter were deduced by latitude
averaging between
15
ON
and
75"N,
we studied the effects of the width of the
latitude band on our results by considering other (narrower) latitudinal
bands. Besides obvious effects on the total amplitude of the waves, no other
significant differences were noticed.
2.
For the same day, the mean zonal wind was evaluated geostrophically
from the geopotential height gradient in the latitudinal band considered
above. We noted that employing the classic Rossby (two-dimensional) for-
mula, the resonant stationary wavenumber oscillated between zonal wave-
numbers
2,3,
and
4,
so
we decided to consider the variance associated with
the combined amplitude of these three wavenumbers for each day:
A
=
(C,ICJ~)'/~,
c,
=
complex amplitude of wavenumber
i, i
=
2,
3,
or
4.
3.
At the completion ofthese operations, we were left with two samples of
size
N
=
1552:
the mean zonal wind
U,
and the variance
of
the combined
amplitudes of wavenumbers
2,
3,
and
4,
here designated
A,
(n=
1,
2,
.
.
.)
N).
For our purposes, we needed
to
further process the samples
so
that each
sample point could be considered to
be
statistically independent of all the
others. This is obviously not true for the
raw
dataset, since it is known that
atmospheric variables decorrelate over a finite time period.
In addition, our sample
sets
might contain other longer trends that could
not
be
directly connected with the natural variability of the system but owe
DENSITY DISTRIBUTION
OF
ATMOSPHERIC
FLOW
23
1
their behavior to variations of the external forcing itself. Such trends might
be easily isolated on the lower end of the frequency spectrum and they would
correspond to well-known frequencies such as the annual cycle and its sub-
harmonics. To remove these trends we proceeded as follows.
1.
For each variable set, we determined the autocorrelation function and
its Fourier transform.
2.
From the observed decay ofthe autocorrelation function, we estimated
the decorrelation time. This turned out to be about
5
days for both variables.
This is in agreement with previous analyses (see, for example, Leith, 1978).
3.
From the power spectrum, we noted a strong annual cycle and three
detectable subharmonics.
To eliminate the short-frequency variability, we designed a low-pass filter
with a cutoff frequency of
5
days. Then the data were resynthesized. To
eliminate the low-frequency variability, we detrended the data by using the
following method. For each day of the winter periods, we considered
1
+r
{.>;=A
2r+
1
-,
*
)i+j
(7)
where
r
=
45
(see Priestley, 1981). By employing this method we detrended
any variability longer than 90 days, and, hence, the year and its detectable
subharmonics.
So
done, we considered the five distinct datasets- the first
four, one for each
year,
contained
N
=
90 observations, while the last one
contained
N
=
360
observations, which were obtained by grouping together
the winters after the individual winter means were subtracted. The last step
was performed to avoid any residual long-term variability.
The two datasets
so
prepared allowed us to study
(1)
the probability den-
sity distribution induced by the data for each winter and
(2)
the probability
density distribution induced by all the data available.
4.
NONPARAMETRIC PROBABILITY DENSITY
ESTIMATION
Since the general form of the probability density for our sample is un-
known, we must use the nonparametric estimation theory. Among nonpara-
metric estimators of unknown probability density associated with a random
sample, the oldest and most frequently used is the histogram.
A
histogram is
a maximum likelihood (ML) estimator in the sense that it maximizes the
likelihood function with good consistency properties (see, for example, Scott
et
al.,
1977).
A
disadvantage of such an estimation is that it becomes very
noisy when the mesh size tends to zero (number of bins tends to infinity), and
moreover does not tend in this case to the Dirac-delta at the sample point.
232
ALFONSO
SUTERA
Since, once we have deduced our estimate of the density, we would like to
perform some statistical evaluations of “the goodness
of
the fit,” this unde-
sirable property of the histogram turns out to be
a
major handicap.
A
different approach to density estimation, that has the same advantages
as the histogram but avoids its shortcomings, is the method of maximum
penalized likelihood (MPL) (see Scott
et
al.,
1977). This technique allows
us
to
combine maximization of both the likelihood function and a penalizing
smoothness function by taking explicitly into account the smoothness of the
density through a free parameter that we shall call
a.
The MPL method consists in finding the maximum of the following score
functions:
with the constraint
Wdt
=
1
I
where
x,
are the observations and Wis any density. The discrete approxima-
tion to Eq.
(1)
can
be
solved by employing an algorithm implemented and
incorporated into the International Mathematical Statistical Library
(IMSL), and in this article we used their routine NDMPLE on our data.
The external parameters to be provided to the algorithm (besides the data)
are
(1)
the mesh points at which the density must be evaluated and
(2)
the
hyperparameter
a.
We decided to choose
4
1
mesh points when we evaluated
the density corresponding to the variable
A,
while 15 mesh points were
employed for the variable
U.
This choice was based by assuming an experi-
mental error in determining
A
and
U
of
1
m and
40
cm sec-’, respectively.
Once a probability density has been estimated,
as
already mentioned, it
will depend on the smoothness parameter
a.
The choice ofa is arbitrary, and
it
is
not
deduced from the data (in other words, it is specified
a
priori).
However, for any
a,
the corresponding theoretical probability density can
be
compared to the sample probability density through classical tests such as the
Kolmogorov
-
Smirnov
(K-
S)
test. For the sake of clarity, we recall that the
K-S
test consists
of
evaluating the quantity:
K
=
SUP[S(xj)
-
P(X~
a)]
X.
Sup
=
Supremum over all
xi
(9)
x,
where
S
and
p
are the sample probability density and the theoretical proba-
bility density, respectively, at the sample point
xi.
It is known that the
statistic
K
defined by Eq.
(9)
follows the
K-S
distribution and we can
DENSITY DISTRIBUTION
OF
ATMOSPHERIC
FLOW
233
evaluatep,, i.e., the probability of an occurrence ofKthat is less than that of
a random variable with that distribution. It follows by this definition that as
p(xi,
a)
takes on a greater resemblance to
S,
we would have better confidence
in
p.
Taken to the extreme, if
p(xi,
a)
were found by the combination of as
many Dirac-deltas as there were data points, the fit, as defined by examining
K,
would be perfect. Of course such a
p
would not be representative of the
true density because such a probability would predict that ifx, is an outcome,
then the next outcome will be
xi
with probability
1.
Now it is easy to show
that the
MPL
estimation tends to a Diracdelta at the sample points as
a
4
0
(the estimation optimizes the maximum likelihood), hence a
K-
S
test alone
would help to distinguish between an oversmooth
p
and one closer to the
data. But, on the contrary, the estimation would be insufficient to bound
from below the optimal
a.
For this reason, we decided to calculate different
densities by decreasing the value of the hyperparameter
a
up to the point on
which the confidence level given by the
K-
S
test would reach the value
of
95%.
5.
RESULTS
In this section we will show our main results on the nature of the density
distribution of the data described in Section
3.
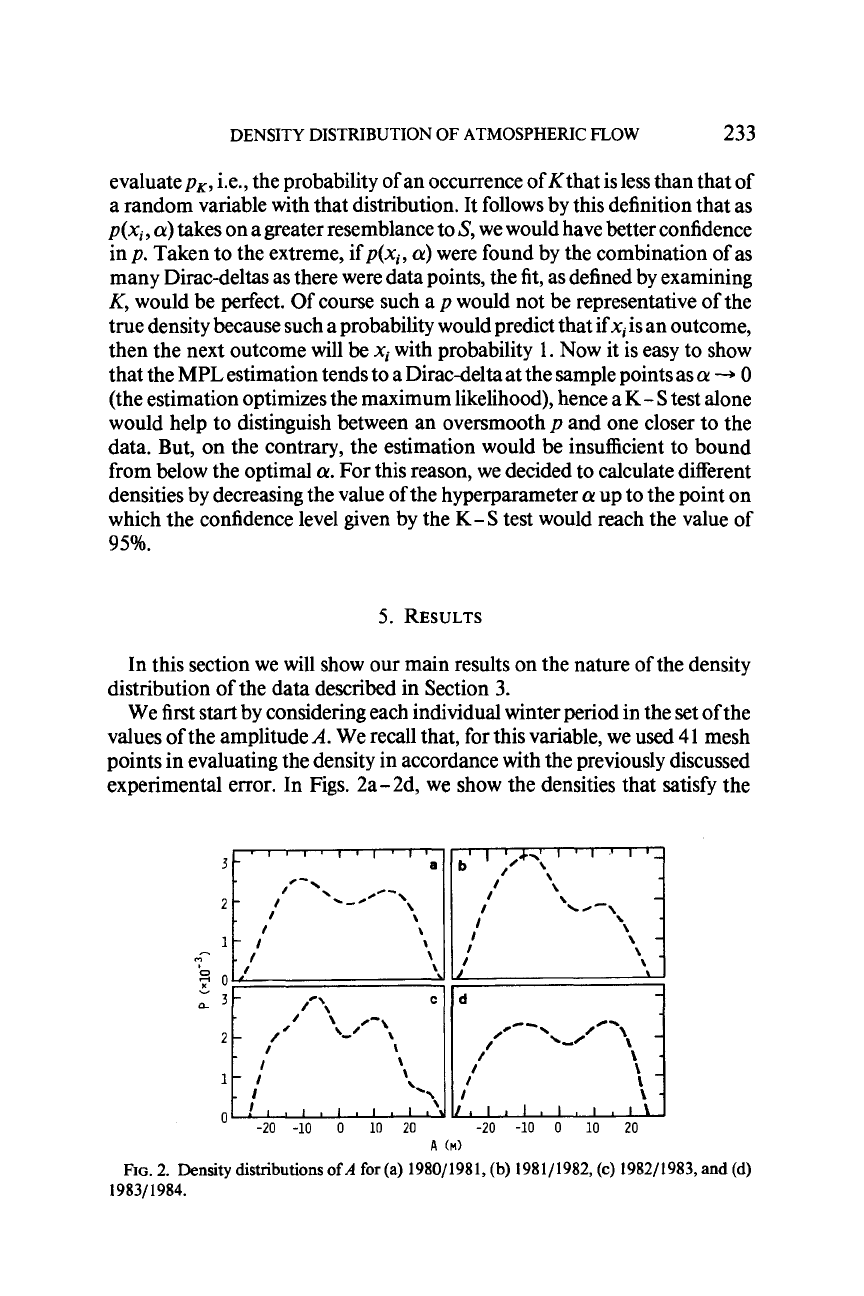
We first start by considering each individual winter period in the set
of
the
values of the amplitude
A.
We recall that, for this variable, we used
4
1
mesh
points in evaluating the density in accordance with the previously discussed
experimental error. In Figs. 2a-2d, we show the densities that satisfy the
1p;
,
,
,
,
,
,
,'\>
I
t
-20
-10
0
10
20
7
\
I
*\.-,
I
I
I
I
A
(MI
FIG.
2. Density distributions
ofA
for
(a)
1980/1981, (b) 1981/1982,
(c)
1982/1983,
and (d)
1983/1984.