Saltzman B. (editor) Anomalous Atmospheric Flows and Blocking
Подождите немного. Документ загружается.

2
34
ALFONSO
SUTERA
TABLE
I.
CONFIDENCE LEVELS
OF
THE
KOLMOGOROV-SMIRNOV TEST
(pK)
FOR
Aa
PK
ff
1981 1982 1983 1984
0.5
X
loi3
0.9 0.96
0.99
0.6
0.2
X
lo”
0.8
0.91 0.98
0.46
0.8
X
lo1*
OSb
0.76
0.97
0.13
0.3
X
lot2
0.2
0.39b 0.90
0.05
0.1
X
10l2
0.1
0.06
0.6b
0.005
0.5
X
10”
0.03
0.0055
0.5
0.0013
0.2
X
10”
0.01 0.0053
0.1
0.0012
The behavior of
pK
is a function of the hyper-
For
these
values
of
a,
or
lower,
the density
is
parameter
a!
for the variable
A.
always
bimodal.
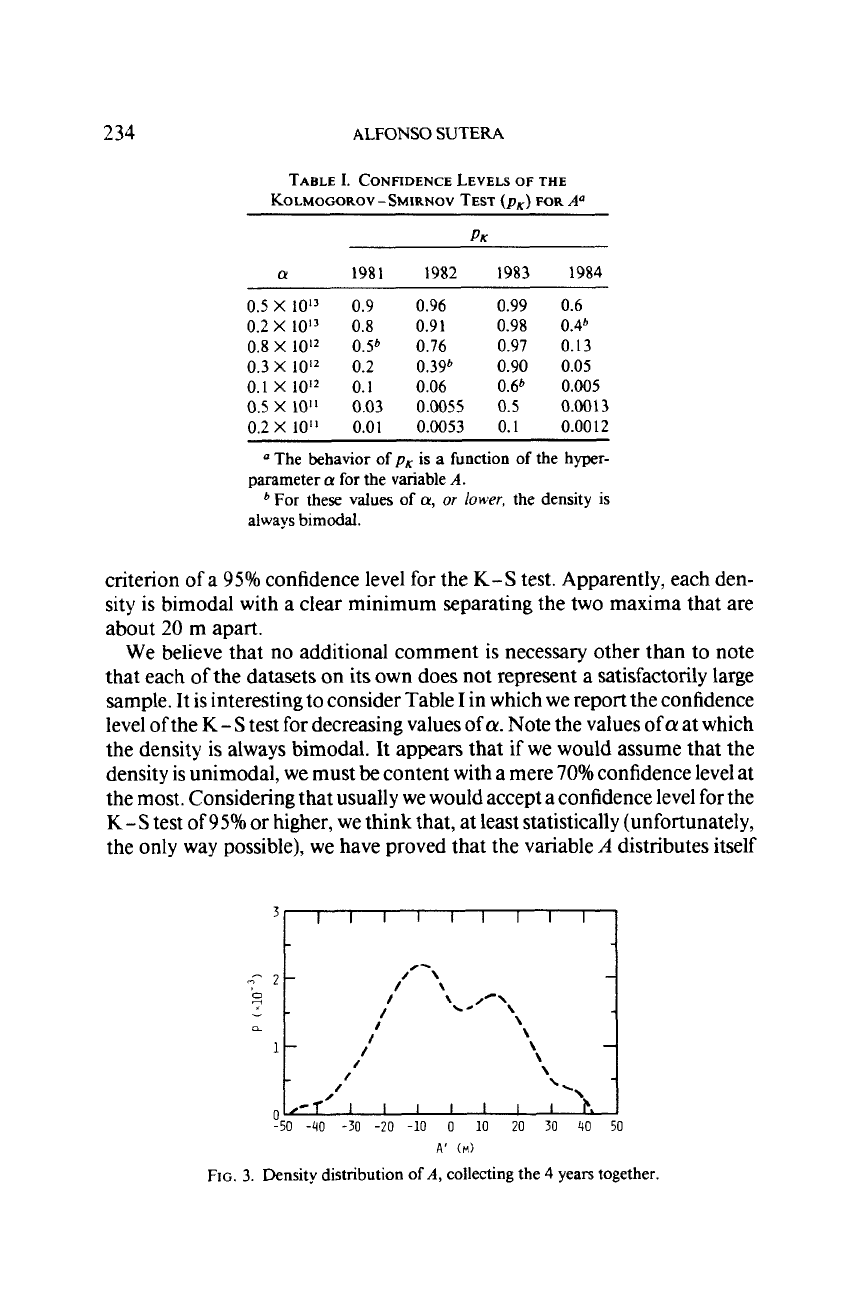
criterion of a
95%
confidence level for the
K-S
test. Apparently, each den-
sity is bimodal with a clear minimum separating the two maxima that are
about
20
m apart.
We believe that no additional comment is necessary other than to note
that each of the datasets on
its
own does not represent a satisfactorily large
sample. It is interesting to consider Table
I
in which we report the confidence
level of the
K
-
S
test for decreasing values of
a.
Note the values
of
a
at which
the density
is
always bimodal. It appears that if we would assume that the
density is unimodal, we must
be
content with a mere
70%
confidence level at
the most. Considering that usually we would accept a confidence level for the
K-S
test
of
95%
or higher, we think that, at least statistically (unfortunately,
the only way possible), we have proved that the variable
A
distributes itself
y50
-40
-30
-20
-10
0
10
20
30
40
50
A‘
(MI
FIG.
3.
Density distribution
of
A,
collecting the
4
years together.
DENSITY DISTRIBUTION
OF
ATMOSPHERIC
FLOW
235
TABLE
11.
CONFIDENCE
LEVELS
OF
THE
KOLMOGIROV-SMIRNOV TEST
(pK):
4-YR SUMMARYa
a!
PK
0.1
x
1014
0.5
x
1013
0.25
x
1013
0.12
x
1013
0.6
X
10l2
0.3
X
10l2
0.15
x
1012
0.7
X
10”
0.3
X
loL1
0.3*
0.22
0.19
0.15
0.11
0.08
0.06
0.05
0.04
a
The behavior of
pK
as
a
function
of
the hyper-
For
this
value
ofa,
or
lower,
the density is always
parameter
a
for the variable
A.
bimodal.
following a bimodal density. The same results are obtained when we con-
sider
A
as defined by dataset
(2).
For this case, since we have more observa-
tions, we have even removed the assumption that each individual sample
point be independent, and we have calculated the one-sided
K-S
test by
assuming we have only
72
independent observations, as a nonfiltered dataset
would suggest. The result is presented in Fig.
3,
and Table I1 contains the
behavior of the test for different values of the hyperparameter; as in Table I,
note the value
of
a
after which we have a bimodal density. In summary, it
appears that the measure of planetary-scale waves that we have studied show
a marked bimodality which is independent of the known externally forced
periodicities of the system.
6.
CONNECTION
WITH
PATTERNS
OF
THE
500-mbar
GEOPOTENTIAL HEIGHT
Up to now we have demonstrated that a global indicator (the latitudinally
averaged geopotential field has been Fourier decomposed) of large-scale
atmospheric behavior has a bimodal distribution. This result, while interest-
ing in itself, might be of marginal physical significance if we could not
connect each mode to anything peculiar in the character of the “weather”
map from which it has been deduced.
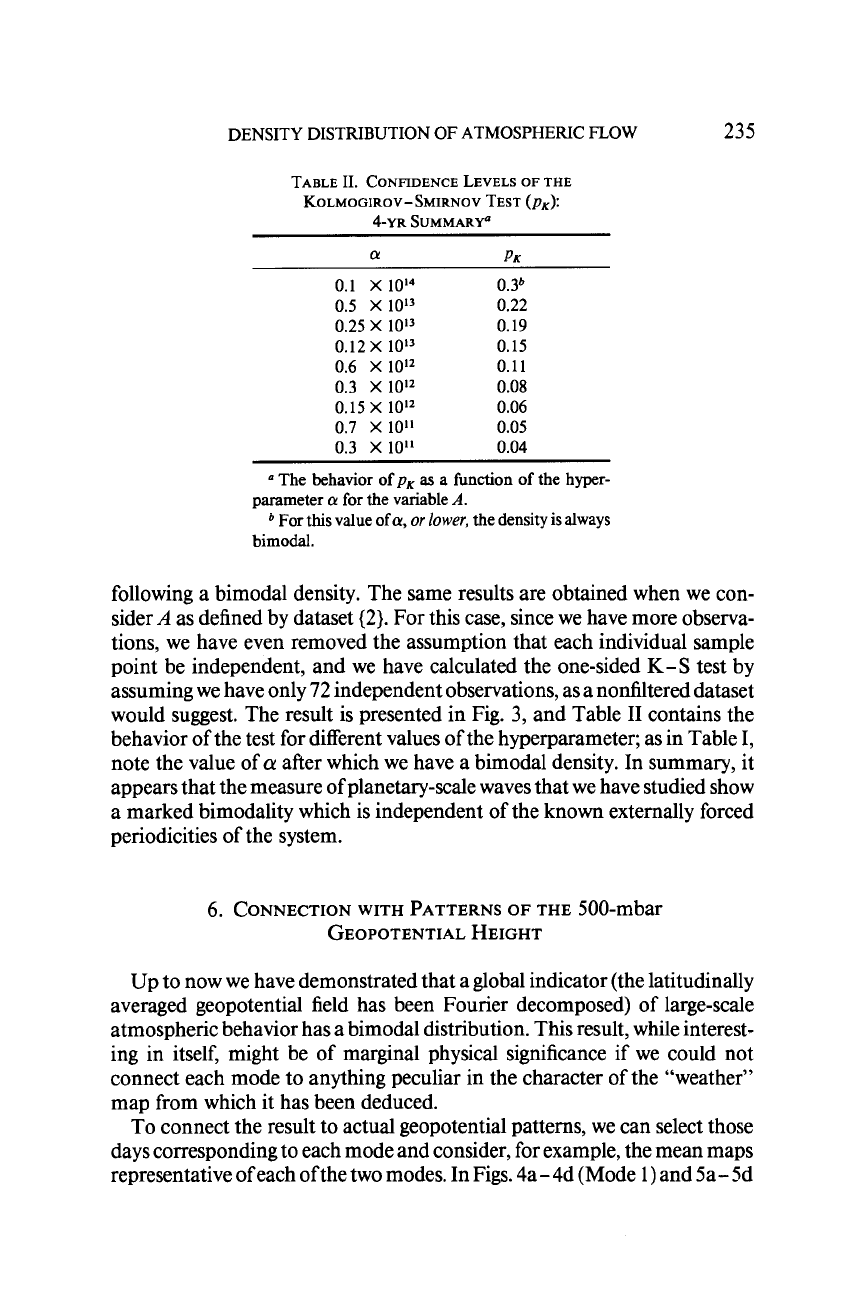
To connect the result to actual geopotential patterns, we can select those
days corresponding
to
each mode and consider, for example, the mean maps
representative of each ofthe two modes. In Figs. 4a- 4d (Mode
1)
and Sa- Sd
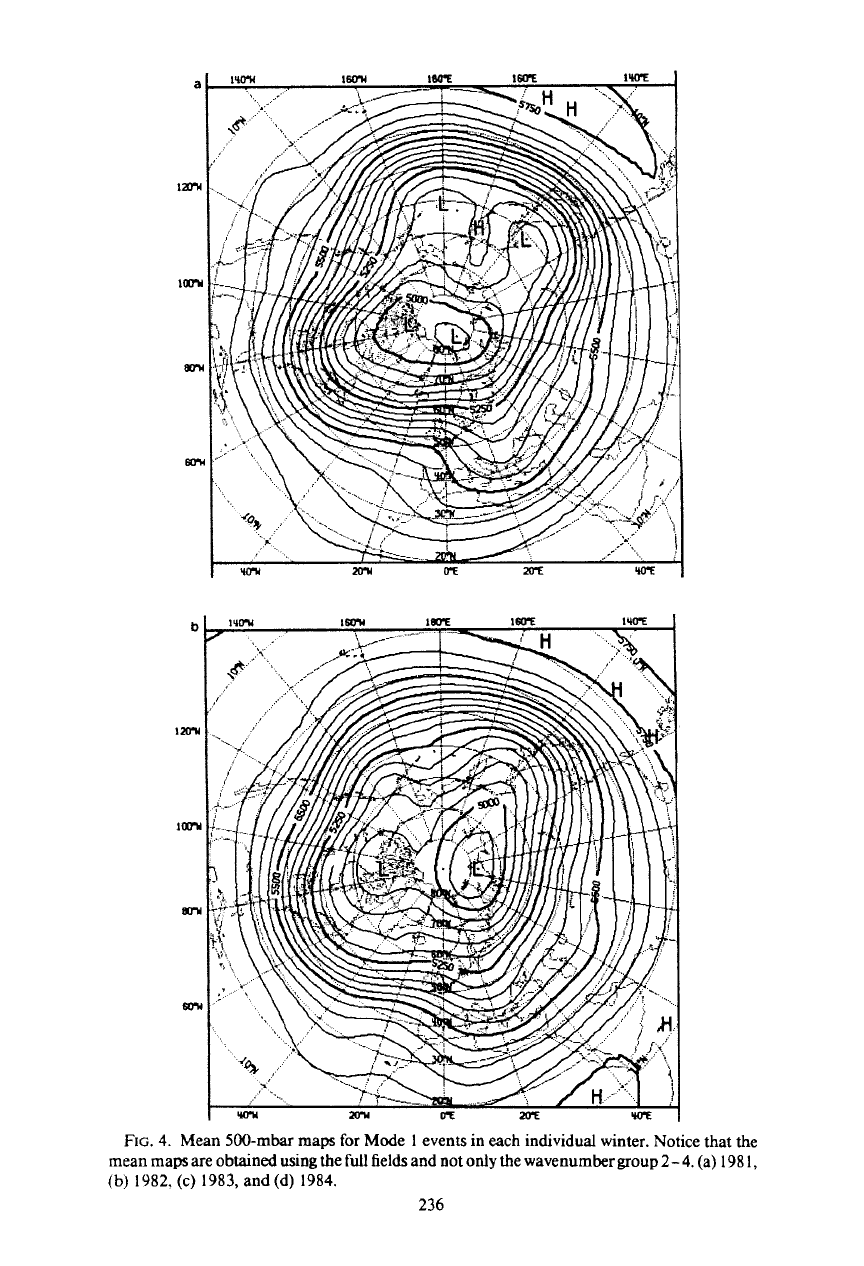
FIG.
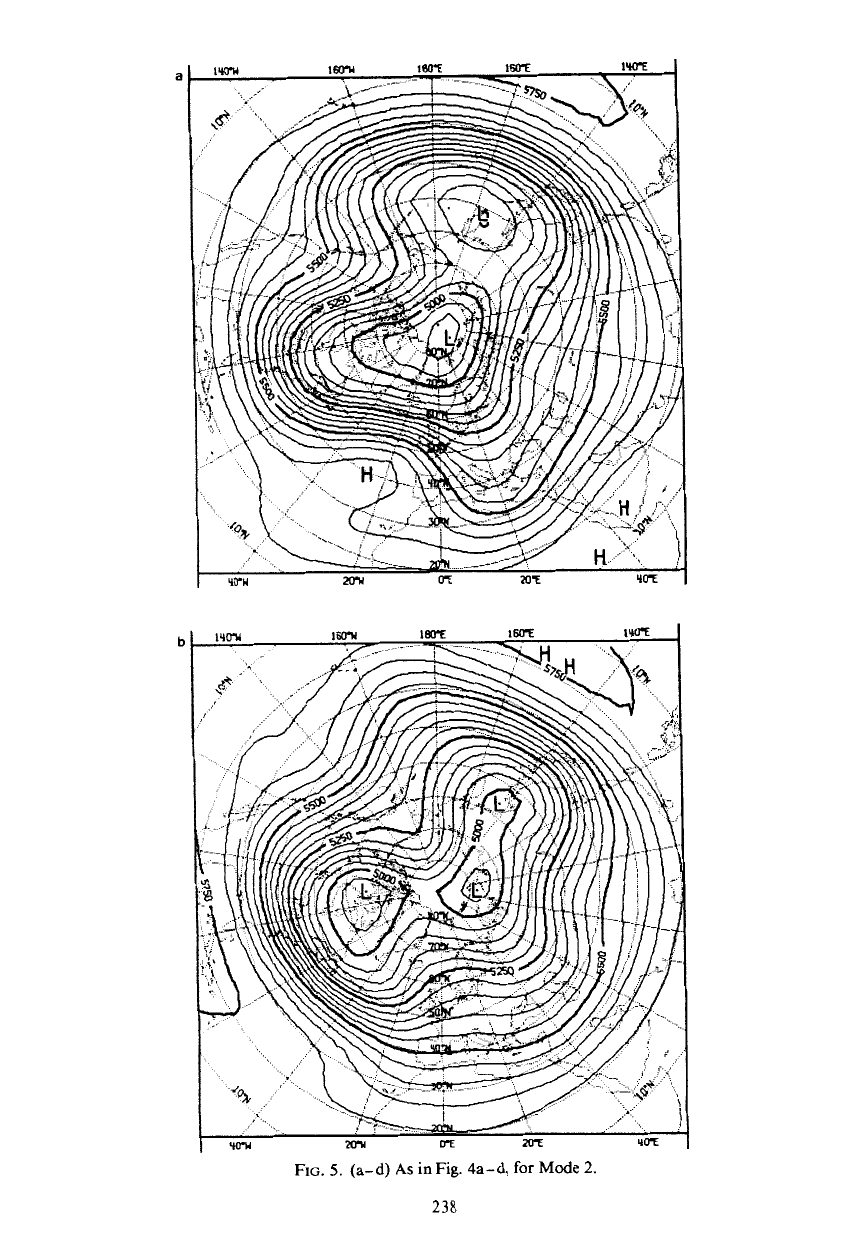
4.
Mean 500-mbar maps
for
Mode
1
events in each individual winter. Notice that the
mean maps are obtained
using
the
full
fields and not
only
the wavenumber
group
2-
4. (a) 198
1,
(b)
1982.
(c)
1983, and (d) 1984.
236
FIG.
4c
and
d.
231
a
FIG.
5.
(a-d)
As
in
Fig.
4a-d,
for
Mode
2.
238
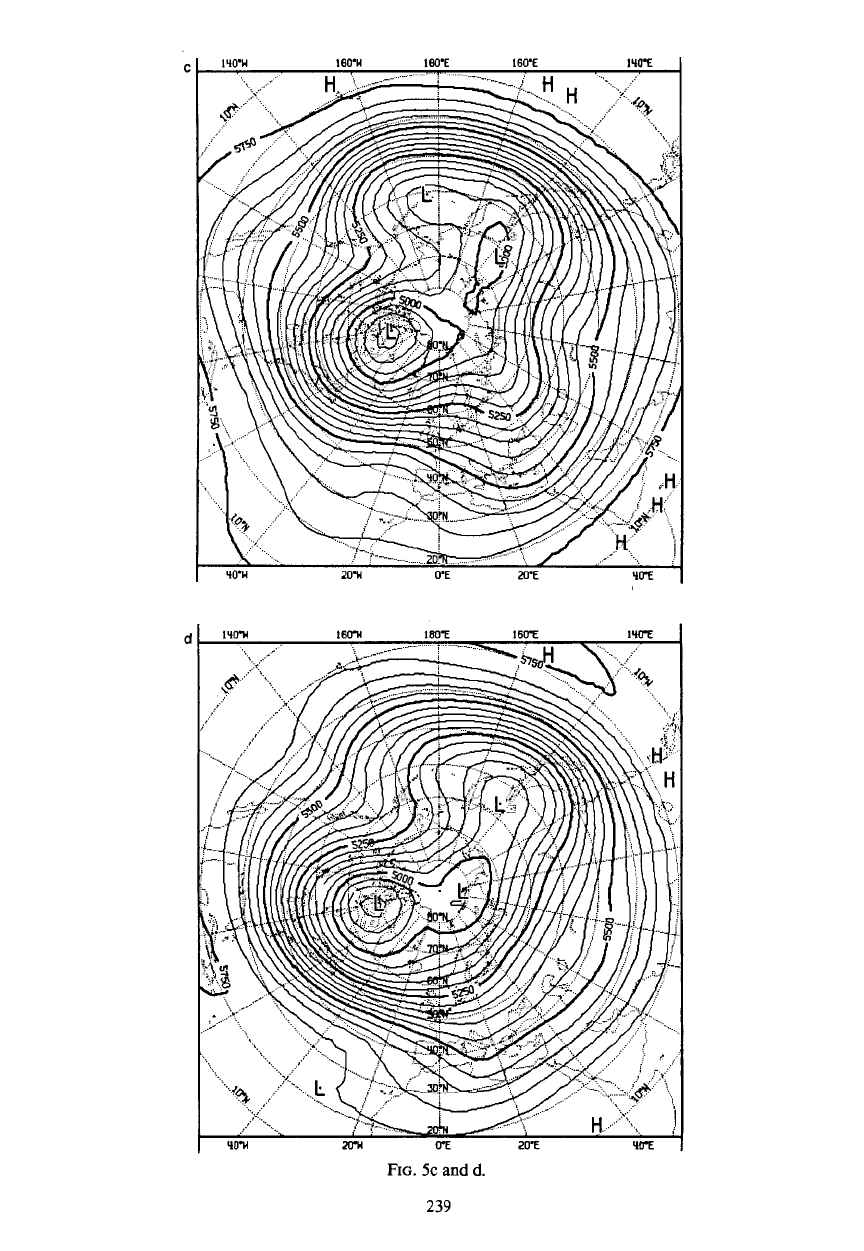
FIG.
5c
and
d.
239
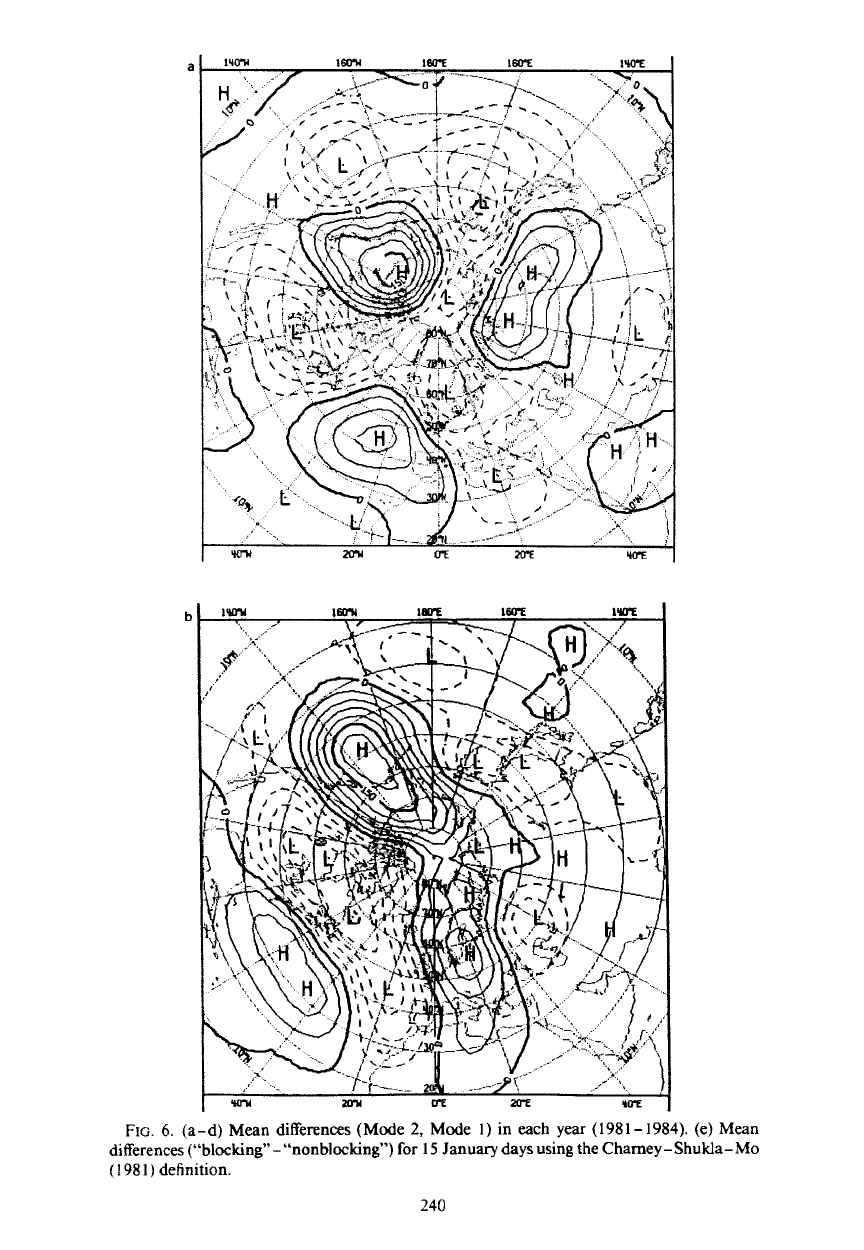
FIG.
6.
(a-d) Mean differences (Mode
2,
Mode
1)
in
each
year (1981-1984). (e) Mean
differences (“blocking”- “nonblocking”)
for
15
January days using
the
Chamey
-
Shukla-Mo
(1
98
1)
definition.
240
C
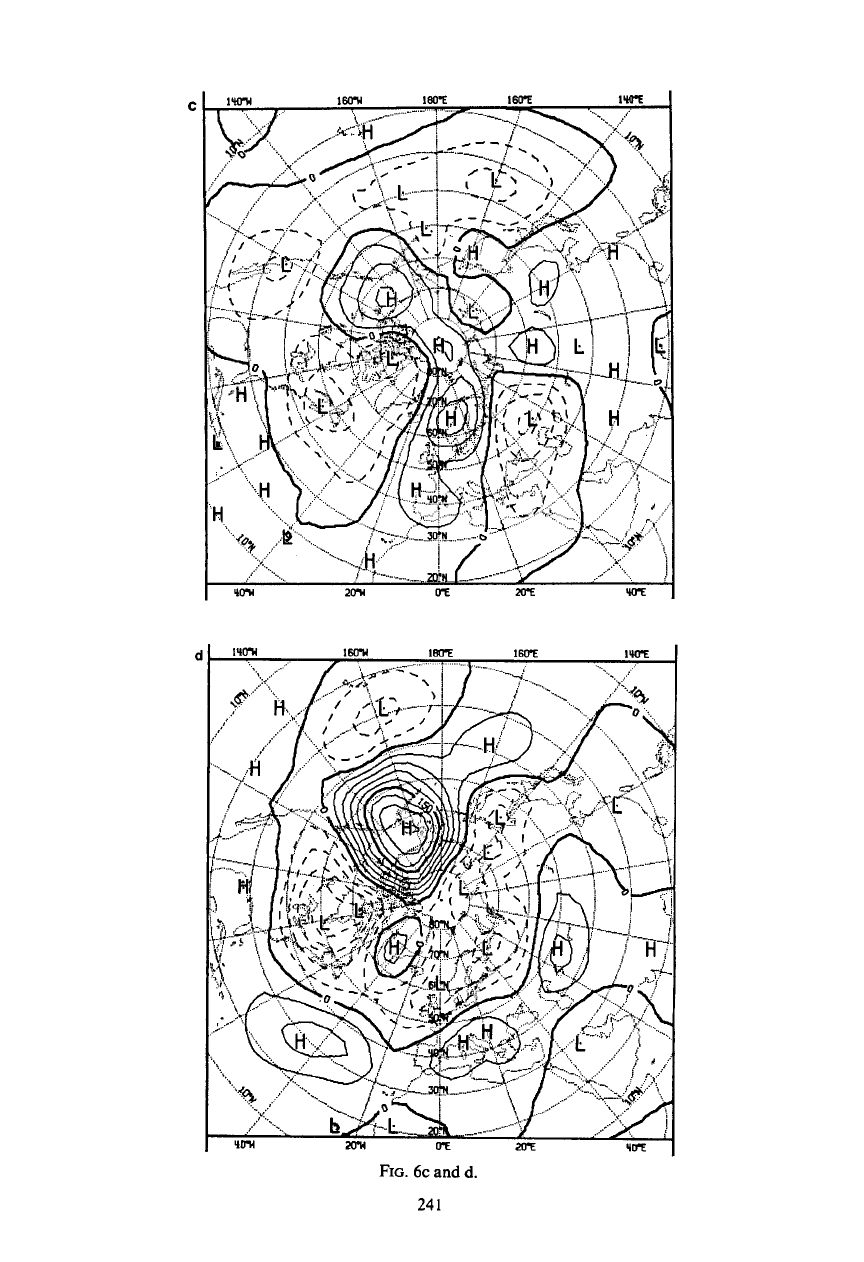
FIG.
6c and
d.
24
1
ALFONSO
SUTERA
242
t
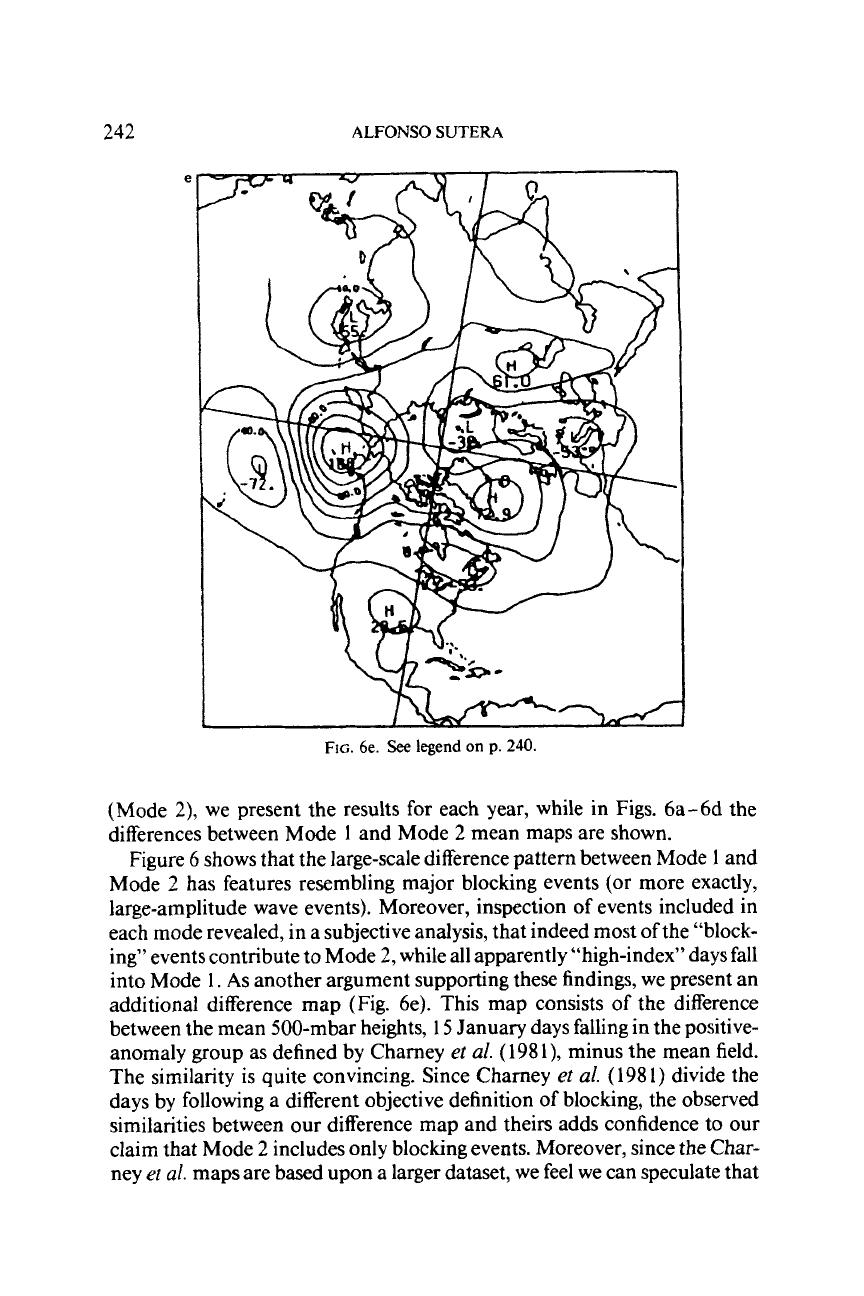
FIG. 6e.
See
legend
on
p.
240.
(Mode
2),
we present the results for each year, while in Figs. 6a-6d the
differences between Mode
1
and Mode
2
mean maps are shown.
Figure
6
shows that the large-scale difference pattern between Mode
1
and
Mode
2
has features resembling major blocking events (or more exactly,
large-amplitude wave events). Moreover, inspection of events included in
each mode revealed, in a subjective analysis, that indeed most of the “block-
ing” events contribute to Mode
2,
while all apparently “high-index” days fall
into Mode
1.
As
another argument supporting these findings, we present an
additional difference map
(Fig.
6e). This map consists of the difference
between the mean 500-mbar heights, 15 January days falling in the positive-
anomaly group as defined by Charney
et
al.
(198
l),
minus the mean field.
The similarity
is
quite convincing. Since Charney
et
a/.
(
198
1)
divide the
days by following a different objective definition
of
blocking, the observed
similarities between our difference map and theirs adds confidence to our
claim ?hat Mode
2
includes only blocking events. Moreover, since the
Char-
ney
ef
d.
maps are based upon a larger dataset, we feel we can speculate that
DENSITY DISTRIBUTION OF
ATMOSPHERIC
FLOW
243
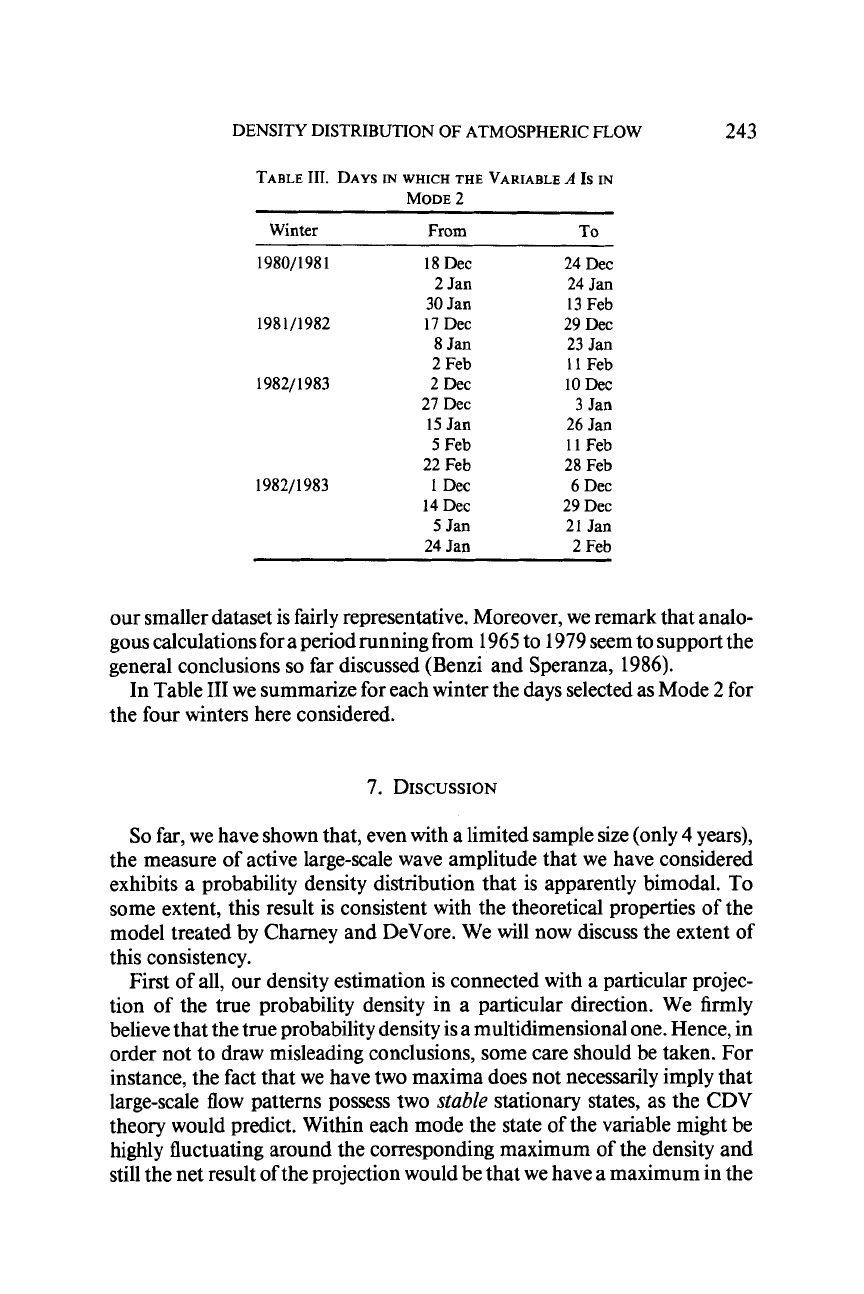
TABLE
111.
DAYS
IN
WHICH
THE
VARIABLE
A
IS
IN
MODE 2
Winter
From
To
1980/198
1
18 Dec 24 Dec
2 Jan 24 Jan
30 Jan
13
Feb
1981/1982 17 Dec 29 Dec
8
Jan 23 Jan
2 Feb
11
Feb
1982/ 1983
2Dec
10 Dec
27 Dec
3
Jan
15 Jan 26 Jan
5
Feb
11
Feb
22 Feb 28 Feb
1982/ 1983
1
Dec
6
Dec
14
Dec 29 Dec
5
Jan 21 Jan
24 Jan 2 Feb
our smaller dataset is fairly representative. Moreover, we remark that analo-
gous calculations for a period running from
1965
to
1979
seem to support the
general conclusions
so
far discussed (Benzi and Speranza,
1986).
In Table I11 we summarize for each winter the days selected as Mode
2
for
the four winters here considered.
7.
DISCUSSION
So
far, we have shown that, even with a limited sample size (only
4
years),
the measure of active large-scale wave amplitude that we have considered
exhibits a probability density distribution that is apparently bimodal. To
some extent, this result is consistent with the theoretical properties of the
model treated by Charney and DeVore. We will now discuss the extent
of
this consistency.
First
of
all, our density estimation is connected with
a
particular projec-
tion
of
the true probability density in a particular direction. We firmly
believe that the true probability density is a multidimensional one. Hence, in
order not to draw misleading conclusions, some care should be taken. For
instance, the fact that we have two maxima does not necessarily imply that
large-scale flow patterns possess two
stable
stationary states, as the CDV
theory would predict. Within each mode the state of the variable might be
highly fluctuating around the corresponding maximum
of
the density and
still the net result of the projection would be that we have a maximum in the