Russ J.C. Image Analysis of Food Microstructure
Подождите немного. Документ загружается.

(a)
(b)
(c)
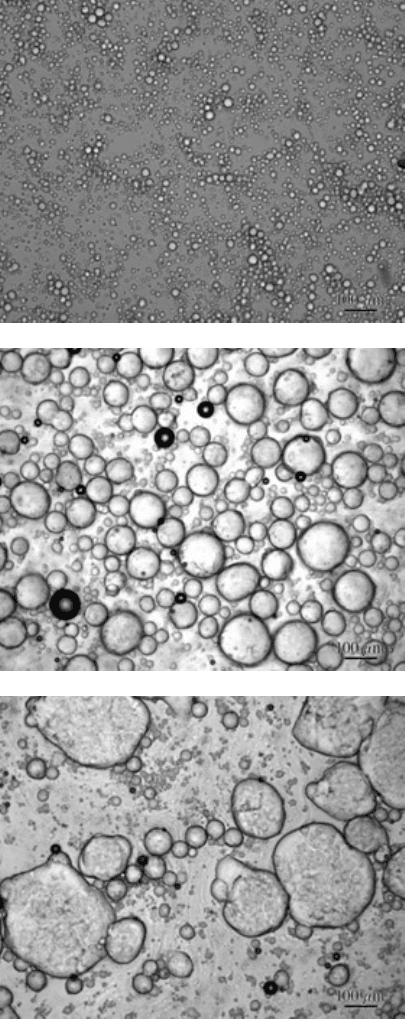
FIGURE 5.21
Fat droplets in milk: (a) after homogenization; (b) before homogenization; (c)
before homogenization, long standing time. (Courtesy of Ken Baker, Ken Baker Associates)
2241_C05.fm Page 307 Thursday, April 28, 2005 10:30 AM
Copyright © 2005 CRC Press LLC
multiple images at high magnification (which will show the small features) and then
tile them together to produce a single large image in which the large features can be seen.
The images in Figure 5.21 raise another issue for feature measurement. Just
what is the size of a droplet? The dark line around each droplet results because the
index of refraction of light in water (the matrix) is not the same as in fat (the droplets).
Consequently, each droplet acts as a tiny lens and light that passes through the edge
of each droplet is directed away from the camera, producing the dark ring. The most
(a)
(b)
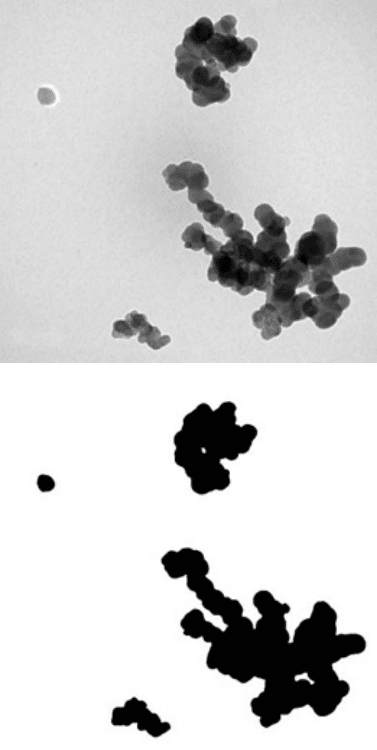
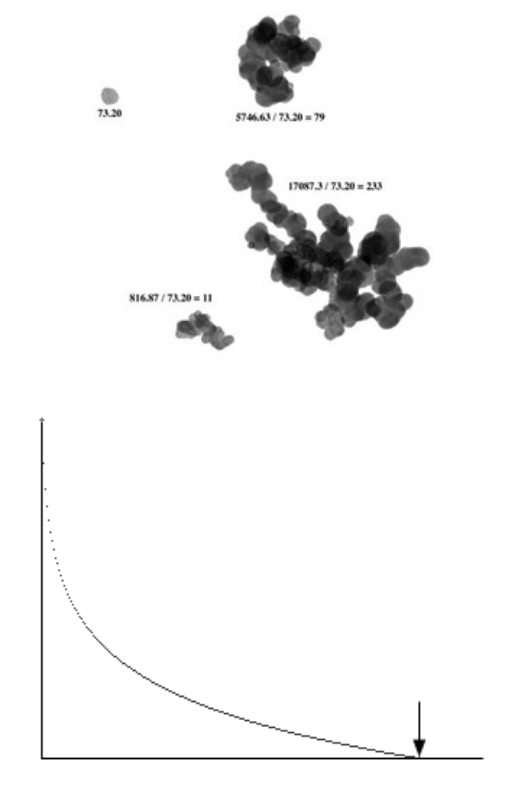
FIGURE 5.22 Using density to count particles in clusters: (a) original TEM image; (b) thresh-
olded to delineate the clusters; (c) combination of images (a) and (b) to delineate the clusters
with original grey scale values (labels give the integrated optical density and the estimated number
of particles); (d) Beer’s law calibration curve (the background point is set to the mean pixel
brightness of the background around the clusters, corresponding to no attenuation).
2241_C05.fm Page 308 Thursday, April 28, 2005 10:30 AM
Copyright © 2005 CRC Press LLC
convenient use of the dark outlines is to threshold them and fill the interiors of the
droplets. That is correct for the case of fats in water. But for an emulsion of water in
fat, the dark line would surround the droplet rather than being part of it. In that case,
the procedure should be to threshold the dark line and process the image to keep the
interior but not the line. So some knowledge of the nature of the sample and the physics
of the generation of the image is needed to obtain accurate measurements.
Physics can be used to enable measurement in another situation that would other-
wise be difficult, the case of a three-dimensional cluster of particles. In Figure 5.22
(c)
(d)
FIGURE 5.22 (continued)
816.87 / 73.20 = 11
17087.3 / 73.20 = 233
5746.63 / 73.20 = 79
73.20
1.0
0
Density (arbitrary units)
Background
= 219
0 255
Pixel brightness value
2241_C05.fm Page 309 Thursday, April 28, 2005 10:30 AM
Copyright © 2005 CRC Press LLC
several clusters of particles, all about the same size, are seen (along with one image
of a single particle). The projected area of each cluster can be measured, but is not
meaningful. If this were a two-dimensional sample with clusters, the ratio of the
area of the cluster to that of a single particle would provide a useful measure of the
number of particles present in each cluster. But for a three-dimensional cluster this
is not correct.
Physics describes the absorption of light (or any other radiation — the image is
actually an electron micrograph) by Beer’s law, an exponential attenuation of signal
with the mass of material through which it passes. So measuring the integrated
optical density (IOD) of each cluster and calculating the ratio of that value to the
IOD of a single particle (preferably after measuring several to get a good average)
will calculate the number of particles in each cluster.
Figure 5.22 shows the procedure. The original image is thresholded (based on
the uniformity of the background) to produce a binary representation of the clusters.
An opening was applied to remove isolated single-pixel noise. This binary image
was then combined with the original to erase the background and leave each cluster
with its original pixel grey scale values. A calibration curve was created using Beer’s
law of exponential absorption. The background point (zero optical density) was set
to the mean brightness level of the background. The vertical density scale is arbitrary
and does not require standards, since only ratios will be used.
The integrated optical density (IOD) of each cluster (and the single particle) is
determined by converting each pixel value to the corresponding density and summing
them for all pixels. The IOD thus represents the total absorption of radiation passing
through the cluster, which is proportional to the total mass (and thus to the total
volume) of material present. Dividing the IOD for each cluster by that for a single
particle calculates the number of particles present in the cluster. Of course, this
method only works if the cluster is thin enough that some signal penetrates com-
pletely through each point. If the attenuation is total so that a pixel becomes black,
then more mass could be added without being detected.
Generally, this method works best with images having more than 8 bits of
dynamic range. An optical density of 4 (the range that can be recorded by medical
X-ray film) corresponds to attenuation values up to 99.99% of the signal, recording
a signal of one part in 10,000. A camera and digitizer with 13 bits of dynamic range
can capture a variation of one part in 8192, while 14 bits corresponds to one bit in
16,384. Cameras with such high bit depth are expensive, require elaborate cooling,
and are generally only used in astronomy. A high-end, Peltier cooled microscope
camera may have 10 or 12 bits of dynamic range (approximately one part in 1000
to one part in 4000).
BRIGHTNESS AND COLOR MEASUREMENTS
This foray into particle counting has brought us again to the measurement of
brightness and/or color information from images. The example in Figure 5.10
showed counting of features based on their color signature. The example in Figure
5.22 showed the use of integrated optical density measurement for each feature (each
cluster) to determine the number of particles contained within the feature. In general,
2241_C05.fm Page 310 Thursday, April 28, 2005 10:30 AM
Copyright © 2005 CRC Press LLC
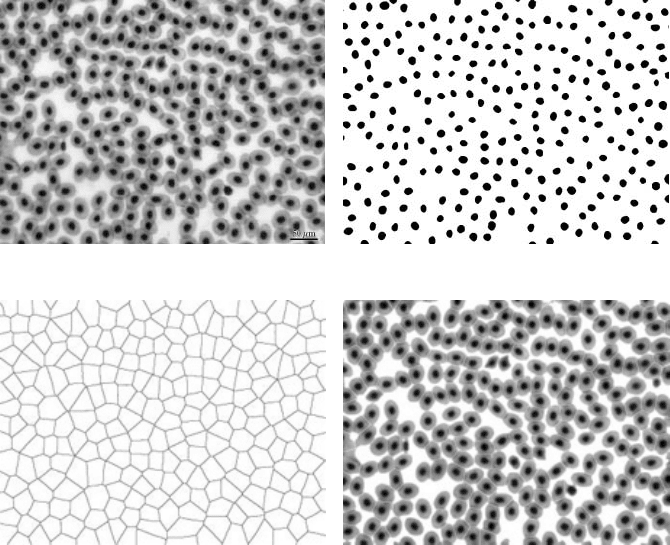
density measurements are used to measure total mass. In the example of Figure 5.23,
an image of frog blood cells shows dark nuclei and less dense cytoplasm. Because
each cell has settled into a size and shape that only partly depends on its contents,
and partly on its surroundings, measuring the area of each feature does not produce
as useful a result as measuring its volume. This three-dimensional property can be
obtained from the optical density measurement.
The cells in the original image touch each other. Rather than watershed segmen-
tation, another procedure was used in this example. Each cell has a well defined,
dark nucleus. These were thresholded and the image inverted so that the background
could be skeletonized. The skeleton of the background is called the “skiz” and
provides lines of separation that bisect the distance between features. Erasing the
pixels along the skiz lines from the thresholded image of the entire cells separates
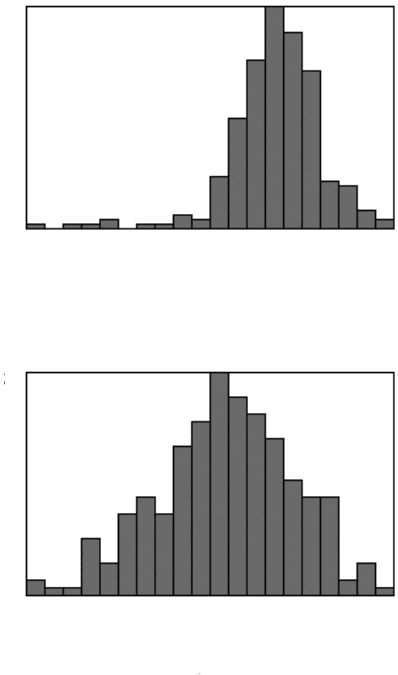
them so they can be measured individually. The distribution plot of cell areas has a
very different appearance from that of the cell integrated density values, which more
accurately reflect the total cell volumes.
In many cases the density values, either calibrated as optical density or simple
uncalibrated pixel brightness numbers, are used to measure profiles along lines across
(a) (b)
(c) (d)
FIGURE 5.23 Measurement of density to determine volume: (a) original image of cells; (b)
thresholded nuclei; (c) skeleton of the background (the skiz); (d) cells separated by erasing
the skiz; (e) cell area distribution; (f) cell density distribution (arbitrary units).
2241_C05.fm Page 311 Thursday, April 28, 2005 10:30 AM
Copyright © 2005 CRC Press LLC
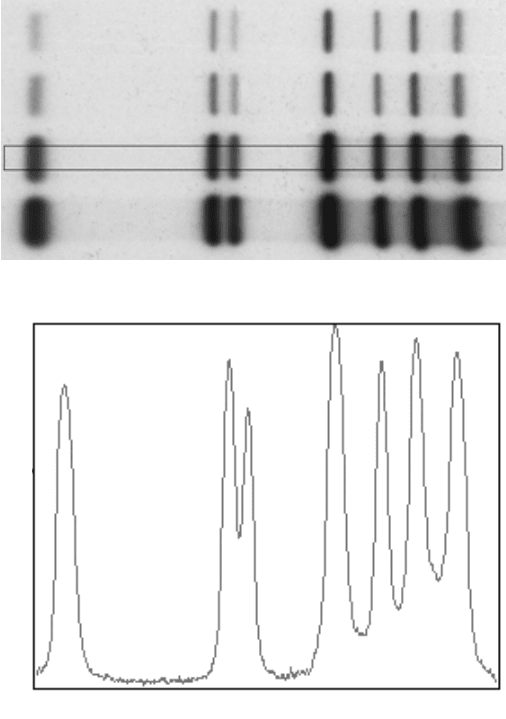
the image. Figure 5.24 shows a typical example, measuring the density along a
column in an electrophoresis separation of proteins. The values are averaged in the
vertical direction at each horizontal point within the marked column, and the average
intensity, usually converted to optical density, is plotted as shown. Analysis is then
performed on the one-dimensional plot using peak finding software.
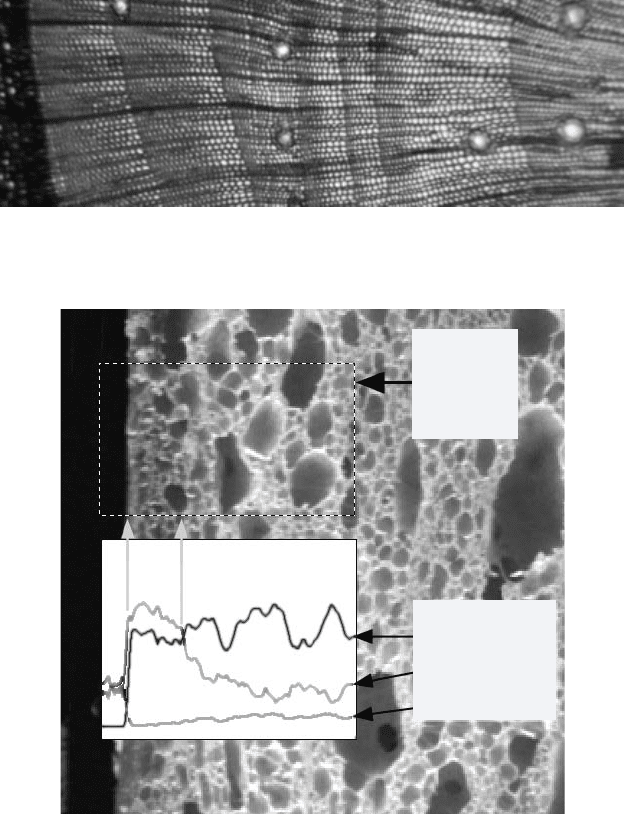
In many cases a plot of intensity is an effective way to extract information in a
way that simplifies measurement. Growth rings in plants (Figure 5.25) provide a
representative example.
Plots of color values can also be used in many cases to simplify measurement
of dimensions. In the example of Figure 5.26, determining the thickness of the crust
on the bread could be performed by a complicated procedure of thresholding and
applying morphological operations to delineate a boundary, using a Boolean AND
to apply a grid of lines, and then measuring the line lengths. It is much more efficient
(e)
(f)
FIGURE 5.23 (continued)
Min = 701 Area (pixels) Max = 2343
To tal = 232, 20 bins
Mean = 1808.74, Std. Dev. = 224.391
Skew = 1.44688, Kurtosis = 7.97697
0
48
Count
Min = 114.8 Density Max = 151.5
To tal = 232, 20 bins
Mean = 134.689, Std. Dev. = 7.00476
Skew = –0.27632, Kurtosis = 2.59955
0
28
Count
2241_C05.fm Page 312 Thursday, April 28, 2005 10:30 AM
Copyright © 2005 CRC Press LLC
to plot the average profile in a broad band perpendicular to the edge of the slice.
There is a definite change in color associated with the crust, and it is (as usual) more
effective to work with the hue, saturation and intensity values than with red, green,
and blue. In the example, the hue is virtually unchanged, and the intensity changes
only slightly at the boundary of the crust, reflecting primarily the presence of open
cells in the bread. However, the saturation drops abruptly when the crust gives way
to the interior bread structure, and provides a quick, effective and reproducible
measurement of the dimension.
Calibrating the intensity vs. concentration for fluorescence images can be diffi-
cult, but in many cases can be avoided by instead using ratios of the intensity at two
(a)
(b)
FIGURE 5.24 Plotting a density profile: (a) one column in a scanned image of protein bands
separated by gel chromatography; (b) the resulting density plot.
Distance
Density
2241_C05.fm Page 313 Thursday, April 28, 2005 10:30 AM
Copyright © 2005 CRC Press LLC
different wavelengths of excitation, or two different emission wavelengths. Ratios
of the intensity above and below the absorption edge energy of a dye, for example,
provides a direct measure of the amount of the fluorescing material at each location.
Figure 3.47 in Chapter 3 illustrates that process for a Fura stain that localizes calcium
activity.
FIGURE 5.25 Growth rings in a fir tree can also be measured by plotting an intensity profile.
FIGURE 5.26 (See color insert following page 150.) Measuring the thickness of a surface
layer (crust on bread) by plotting averaged pixel values. The saturation data are more useful
than intensity or hue in this example.
Profile
Scan
Region
Intensity
Saturation
Hue
2241_C05.fm Page 314 Thursday, April 28, 2005 10:30 AM
Copyright © 2005 CRC Press LLC
When two (or more) different dyes or stains are present, recording their emis-
sions in different color channels is often used to produce color representations of
the structure. Figure 2.15 in Chapter 2 shows a typical example. In a color image
produced by recording different images in the red, green, and blue color channels,
the co-localization of stains is indicated by color shifts or the presence of mixed
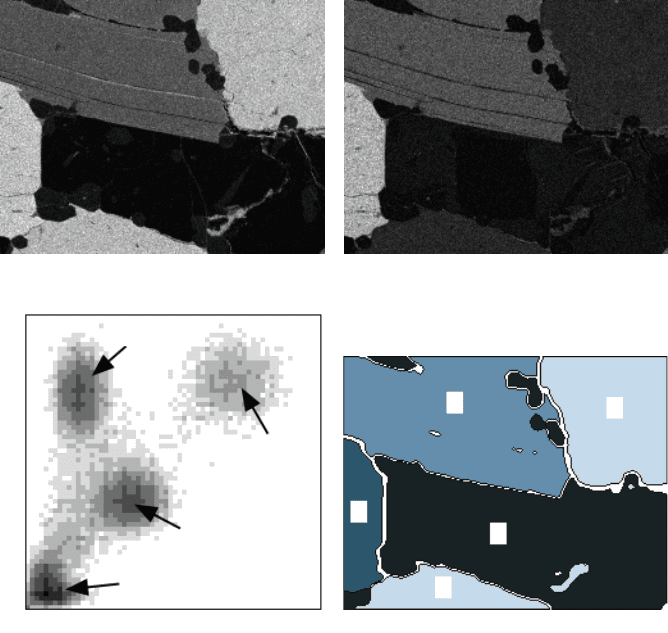
colors such as magenta or yellow. A more quantitative approach to co-localization
can be obtained by plotting the intensity values of the channels at each pixel in the
image, as shown in Figure 5.27. The example in this case uses X-ray maps from an
SEM, indicating the distribution of specific elements in the sample. Clusters in the
plot represent pixels with various ratios of the two intensities, indicating the probable
presence of structures or phases with unique chemical signatures.
(a) (b)
(c) (d)
FIGURE 5.27 Co-localization plots: (a) Si X-ray map; (b) Al X-ray map; (c) co-localization
plot. The four numbered clusters in the co-localization plot correspond to regions numbered
on the diagram (d).
Channel 1 intesity (Al)
Channel 2 intensity (Si)
4
1
2
3
4
1
2
3
4
2241_C05.fm Page 315 Thursday, April 28, 2005 10:30 AM
Copyright © 2005 CRC Press LLC
LOCATION
The location of features can be specified in several ways. The absolute coordi-
nates of the feature may be given in terms of distance from one corner of a slide or
mounting grid, or as the position of the microscope stage X- and Y- drives. This is
akin to using latitude and longitude as a way to describe position. For some purposes
it is very useful, but in others it is more interesting to know the distance and direction
from other features in the image. These in turn may either be similar features or
other structures present such as cell walls or boundaries. Examples in Chapter 4
showed how the Euclidean map could be used to measure distance from boundaries,
for instance.
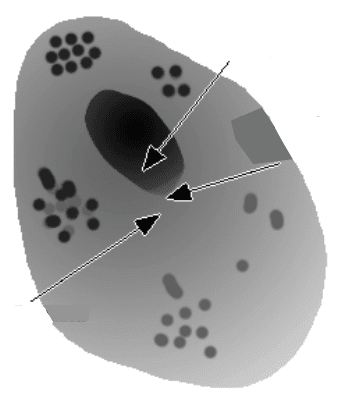
Another issue that arises in specifying the position of a feature is just what point
within the feature should be used for measurement. There are several possible
choices, as shown in Figure 5.28. The centroid of a feature is the point at which it
would balance if cut from uniform thickness cardboard, and this is one of the most
widely used location parameters. But for a feature like a cell in which density varies
from place to place (as discussed above, it typically measures local mass thickness),
the density-weighted centroid may be a more logical choice. The geometric center
can be specified in several ways, the most robust of which is the center of the
circumscribed circle around the feature. Another possible location point is the ulti-
mate eroded point from the Euclidean distance map; this is the center of the largest
inscribed circle in the feature. For most features these points will not be in the same
location and their measurement may lead to different interpretations of spatial
distribution. If the features are symmetrical, such as spherical droplets, the points
are all in the same place.
FIGURE 5.28 The location of a feature can be specified in several ways.
Density-weighted
Centroid
Geometric
Center
Centroid
2241_C05.fm Page 316 Thursday, April 28, 2005 10:30 AM
Copyright © 2005 CRC Press LLC
