Russ J.C. Image Analysis of Food Microstructure
Подождите немного. Документ загружается.

dilated to 3 pixels thick so that they show up better in the book. For measurement
purposes, they would all be just one pixel wide, and connected as shown in Figure
4.29. The skeleton lines are eight-connected, meaning that they are continuous lines
in which a pixel is understood to touch any of its eight possible neighbors. That is
also the most common convention for deciding that pixels touch each other to form
a connected object. But if an image with an eight-connected skeleton is inverted, so
that the cells become features, they are not separated. The pixels in the cells also
touch at the corners and cross the skeleton lines. In general, if an eight-connected
rule is used for pixels in features, then a four-connected rule (pixels touch only if
they share a common side, not just a corner) must be adopted for the background.
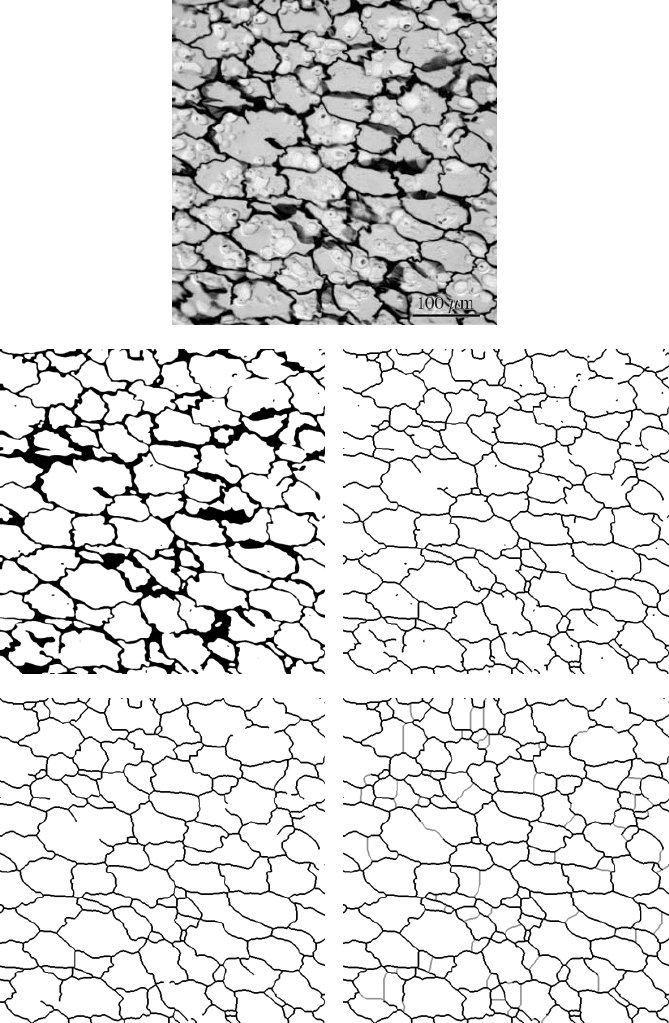
In the example of Figure 4.31, a section through potato shows broad cell walls
because of the finite thickness of the section and the angles of the walls. In the
thresholded image (from the red channel of the original color image), the broad
walls and some extraneous dark specks complicate measurement. Skeletonization
reduces the walls to lines, and discarding any terminal branches (ones that have end
points) and are short (in the example, less than 20 pixels) or lines that are not a part
of the continuous tessellation, cleans up the image.
There are still some breaks in the tessellation that may or may not be real, and
which can be seen to correspond to gaps in the original image. If the breaks are due
to inadequacies of preparation, then completing the tessellation by filling in the gaps
is legitimate. Rather than drawing them in by hand, an automatic method that works
well if the cells are convex is to invert the image and apply a watershed segmentation
to the interiors of the cells. As shown in Figure 4.31(e), this fills in the gaps, but in
this case also subdivides a few of the cells that have shapes that are narrow in the
center.
Skeletonization of a cell image allows measurement of several characteristics
that are often important descriptors of the three-dimensional structure and relate to
its macroscopic properties. As an example of the use of the skeleton for a cell
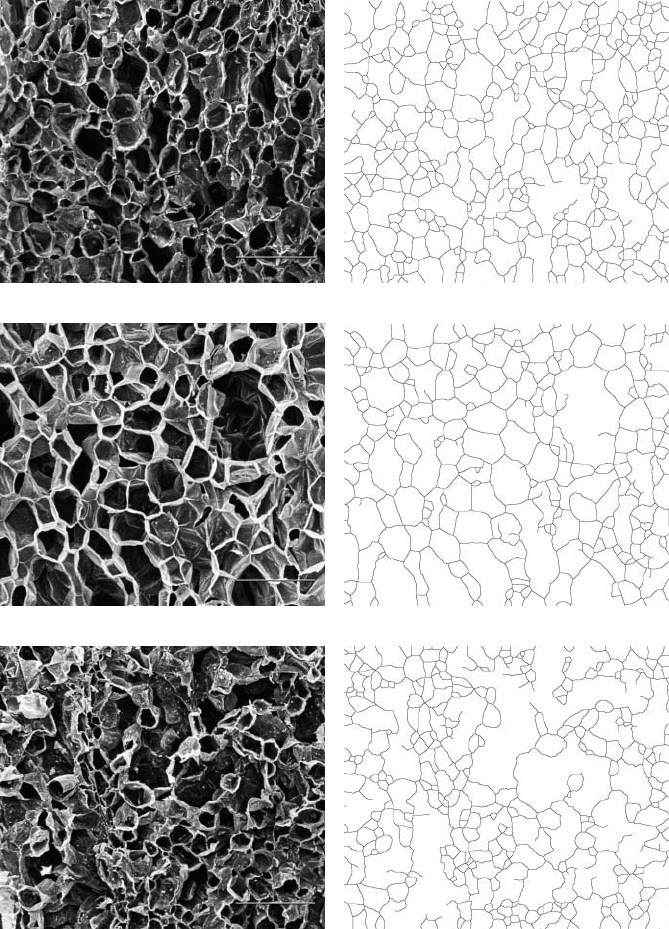
structure, Figure 4.32 shows cross-sections (at the same magnification) through
apples which are characterized by a sensory test panel as having firm, medium, and
soft textures.
In order to correlate structural properties with sensory parameters, the images
were thresholded and skeletonized. The principal difference between the firm and
medium apples is in the scale of the network structure. The node density in the firm
apples is 1.72 per 10,000 µm
2
, and this drops to 1.25 for the medium apples. The
simple coarsening of the structure allows greater compliance and can account for
the change in sensory perception. The structure of the soft apples is quite different.
The presence of a few large open spaces allows much more deformation before
fracture when the apple is bit into. From a measurement standpoint, the distribution
of lengths of the skeleton branches is very different for soft apples. The mean value
doubles and the standard deviation quadruples compared to the firm apples, while
the statistical kurtosis and appearance of the distribution suggests that a duplex
structure with two sizes of structure has formed. There may be other differences
between these apple varieties as well (for instance, the area or intercept length of
the sections through the cells will show a similar trend), but the ability of simple
microstructural measurements to support sensory experience is interesting.
2241_C04.fm Page 256 Thursday, April 28, 2005 10:29 AM
Copyright © 2005 CRC Press LLC
(a)
(b) (c)
(d) (e)
FIGURE 4.31 Editing the skeleton: (a) section of potato (red channel) showing cell walls; (b)
thresholded binary; (c) skeletonized; (d) elimination of short terminal branches and disconnected
segments; (e) filling in of additional lines by applying a watershed to the inverse image.
2241_C04.fm Page 257 Thursday, April 28, 2005 10:29 AM
Copyright © 2005 CRC Press LLC
(a) (b)
(c) (d)
(e) (f)
FIGURE 4.32 Correlation between structure and sensory perception in apples: (a, c, e) cell
structure in firm, medium and soft apples; (b, d, f) skeletonized structure measured as
discussed in text. Magnification marker is 500 µm. (Source: P. Allan-Wojtas, K. Sanford, K.
McRae, and S. Carbyn, An Integrated Microstructural and Sensory Approach to Describe
Apple Texture, Journal of the American Horticultural Society,128(3), 381–390, 2003. Repro-
duced with the permission of the Ministry of Agriculture and Agri-Food, Canada.)
2241_C04.fm Page 258 Thursday, April 28, 2005 10:29 AM
Copyright © 2005 CRC Press LLC
(a)
(b)
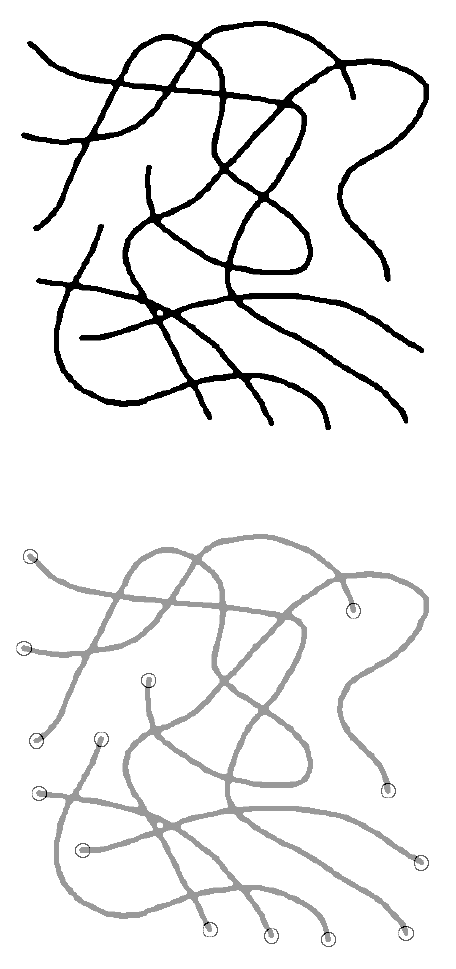
FIGURE 4.33 Example of an image with crossing fibers: (a) binary image; (b) end points
marked using skeleton (there are 14 end points, corresponding to 7 fibers, and the total length
of lines in the skeleton is 21 inches, so the average fiber length is 3 inches).
2241_C04.fm Page 259 Thursday, April 28, 2005 10:29 AM
Copyright © 2005 CRC Press LLC
FIBER IMAGES
Skeletonization is also used with fiber images, because it simplifies counting and
measurement. In the example image of Figure 4.33, even a few crossing fibers are
visually difficult to count. Counting the end points (with one neighboring pixel) in
the skeleton of the fibers gives a direct fiber count because each fiber has two ends.
Measuring the total length of the skeleton lines and dividing by the number of fibers
(half the number of ends) gives the average fiber length, without any need to
disentangle the crossing features. (In the few instances in which measurement of
individual crossing fibers is really necessary, the skeleton also plays a role. Finding
and removing all of the crossing points — pixels with more than two neighbors —
isolates the segments of the fibers so they can be individually measured. Applying
logic to match up the segments based on their having end points that lie close together
and similar orientations allows adding together the pieces of each fiber to get the
overall length. This is a very specialized process, which is only rarely employed.)
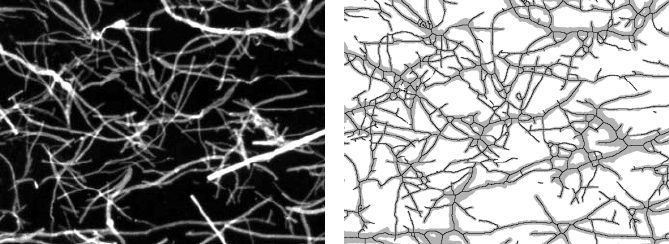
In a more complex fiber image such as the network of cellulose fibers in Figure
4.34, the same technique of counting ends still works to determine the number and
total length of fibers per unit area. If a fiber has only one end in the image field, it
is counted as one-half fiber. That gives the correct number per unit area because the
other half would be counted in an adjacent field of view. A few end points may be
missed if fiber ends lie exactly on other fibers, but that is primarily a matter of
choosing the proper image magnification.
In a branching structure, the individual segments may be of interest (for example
to measure their length, orientation, etc.). Skeletonization followed by eliminating
the nodes or branch points disconnects all of the segments so that they can be
measured as individual features. In the example of Figure 4.35, the root structure
of a soybean seedling has been captured by spreading out the roots on a flatbed
(a) (b)
FIGURE 4.34 More complex fiber image: (a) original grey scale image of cellulose fibers;
(b) skeleton superimposed on binary image (measurement of the skeleton reports 174 end
points and 48 inches of total length in an area of 3 square inches).
2241_C04.fm Page 260 Thursday, April 28, 2005 10:29 AM
Copyright © 2005 CRC Press LLC
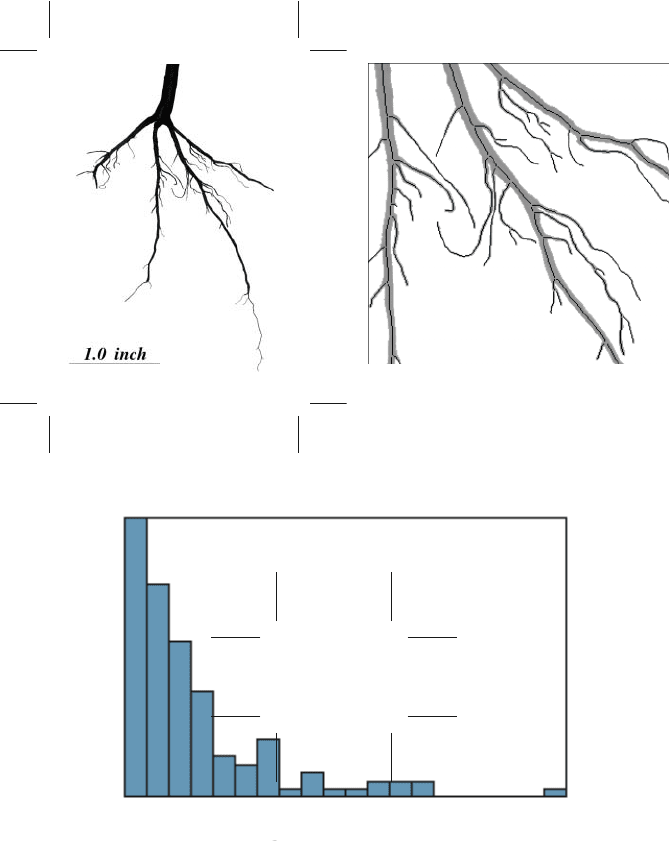
scanner. Thresholding, skeletonization, and removal of the points with more than
two neighbors, leaves the individual branches in the root structure. In a healthy plant
with adequate moisture and soil nutrients, a distribution with more uniform lengths,
rather than a few long and many very short branches, would be expected.
(a) (b)
(c)
FIGURE 4.35 Disconnecting skeleton segments: (a) original image of plant root; (b) enlarged
detail of skeleton with nodes removed, allowing measurement of individual segments; (c)
length distribution of segments.
To tal = 121
Mean = 0.14000
Std.Dev. = 0.14664
Min = 0.00664 Max = 0.84536
Length (in.), 20 bins
0
34
Number of Segments
2241_C04.fm Page 261 Thursday, April 28, 2005 10:29 AM
Copyright © 2005 CRC Press LLC
SKELETONS AND FEATURE SHAPE
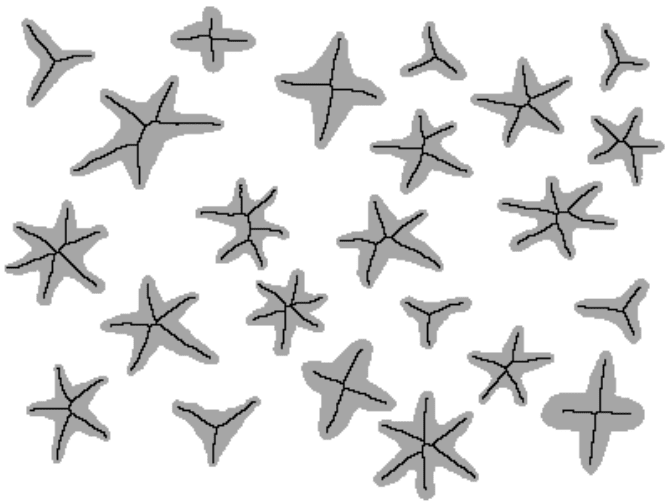
The skeletons of individual features provide basic topological (shape) informa-
tion, which will also be used in the next chapter in the discussion of feature
measurements. Figure 4.36 shows that the number of end points in the feature
skeleton corresponds to the number of points in each star, which is the most recog-
nizable shape characteristic to a human observer.
In a more complex image, the visual recognition of properties such as the number
of arms, or the length of the arms, may be more difficult for a person to recognize.
But the computer can do so easily using the same properties of the feature skeleton.
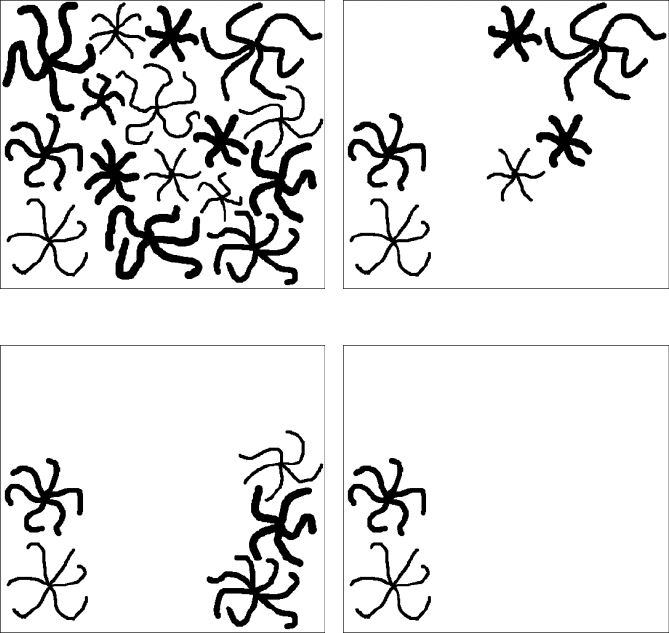
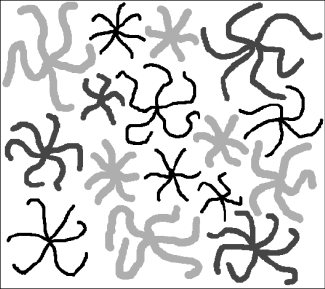
In the example of Figure 4.37, selection of the features with exactly six arms, or
with medium-length external branches (ones that end in an end point as opposed to
extending between two nodes in the structure) is illustrated. Combining these two
images with an AND selects features that meet both criteria.
FIGURE 4.36 Skeletons of some simple shapes superimposed on the original features. The
number of end points in each skeleton measures the basic topological information (number
of arms) that is recognized by human vision.
2241_C04.fm Page 262 Thursday, April 28, 2005 10:29 AM
Copyright © 2005 CRC Press LLC
MEASURING DISTANCES AND LOCATIONS
WITH THE EDM
In the preceding example, another variation present for the various irregular stars
is the width of the arms. Measuring the width of an irregular feature is often desired,
and sometimes cannot be handled well using a grid. In the example of Figure 4.19
a vertical line grid was appropriate because the thickness of the coating was implic-
itly defined in that direction. But for the cross-section of the vein in Figure 4.20 the
radial lines do not really measure the desired dimension, and for a general, arbitrary
shape such as that shown in Figure 4.38, no fixed grid can be devised that would
be useful.
(a) (b)
(c) (d)
FIGURE 4.37 Feature selection using the skeleton: (a) hand-drawn star patterns; (b) features
with exactly six ends; (c) features with medium length arms; (d) Boolean AND combining
(b) and (c).
2241_C04.fm Page 263 Thursday, April 28, 2005 10:29 AM
Copyright © 2005 CRC Press LLC
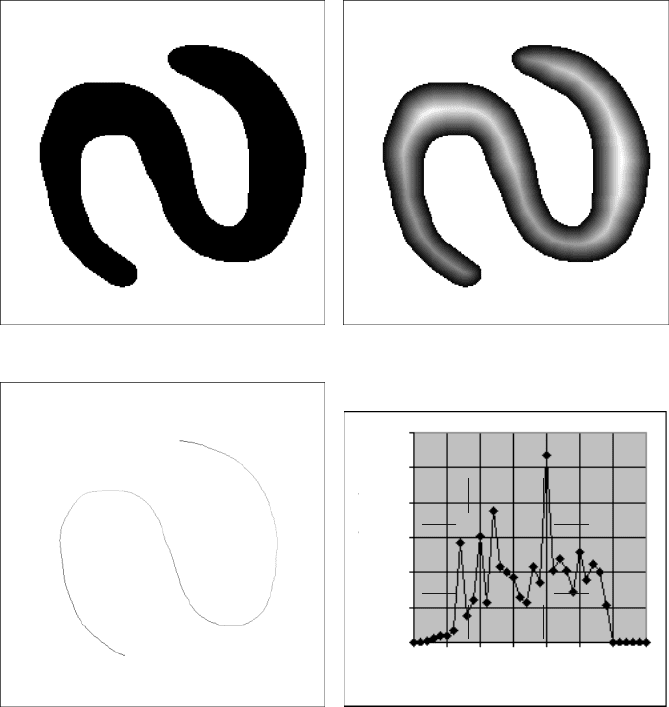
The EDM provides a way to measure the width of such irregular shapes. The
distance map values increase from each edge and reach a maximum at the center of
the feature, which appears as a ridge line if the EDM is rendered as a surface. The
value of the EDM at each point along this line is the radius of an inscribed circle
at that location, and so measures the half-width of the feature at that point. Collecting
all of the EDM values along the center line thus permits the measurement of the
mean, variation (e.g., standard deviation), minimum and maximum widths of the
feature.
(a) (b)
(c) (d)
FIGURE 4.38 Measurement of the width of an irregular feature: (a) example feature; (b)
Euclidean distance map; (c) skeleton with EDM values assigned to pixels; (d) histogram of
values in the skeleton. The minimum width of the feature is 34 (the lowest non-zero point
on the histogram is 17, which is the radius of the inscribed circle) and the maximum is 88
(the highest non-zero point on the histogram is 44). The mean width is 65.5 ± 13.1 (twice
the mean radius of 32.73 ± 6.55).
15 20 25 30 35 40 45 50
Radius (pixels)
0
20
40
60
80
100
120
Number (pixels)
2241_C04.fm Page 264 Thursday, April 28, 2005 10:29 AM
Copyright © 2005 CRC Press LLC
The skeleton marks the midline of the feature, so it can be used to collect the
desired EDM values, as shown in the figure. One way to accomplish this is to
duplicate the image, calculate the EDM of one copy and the skeleton of the second,
and then combine them arithmetically keeping whichever pixel value is lighter. All
pixels other than the skeleton are erased to white (background) while the EDM
values replace the black of the skeleton pixels. A histogram of the image (ignoring
all of the white background pixels) can be analyzed to perform the measurement.
Using the same procedure on the image from Figure 4.37, the features can be
grey-scale labeled to indicate the mean width of their arms as shown in Figure 4.39.
This adds another criterion by which they may be distinguished and sorted.
This measurement technique is particularly useful for characterizing the width
of irregular structures seen in cross section as shown in Figure 4.40. It must be
remembered that it is a two-dimensional measurement, and does not replace the use
of random line intersections as a tool for measurement of the true three-dimensional
thickness of layers sectioned at random orientations.
The location of features within cells, organs, or any other space, can also be
measured using the EDM. For a regular geometric shape such as a square or circle,
calculation of the distance of a feature from the boundary can be performed using
analytical geometry. For a typical irregular shape, this method cannot be used, but
the EDM can. Assigning the distance map value to each pixel within the cell or
region provides a measurement tool for any shape. Combining the EDM values with
an image of the centroid location of each feature, as shown in Figure 4.41, allows
the distance of each feature from the boundary to be measured using the grey scale
value (which can, of course, be calibrated in distance units rather than density).
In the example, the protein and starch granules were thresholded in one copy
of the image and the centroid feature of each marked (the ultimate eroded points
could also be used; in this example with convex features the difference is unimpor-
tant, but for irregular shapes the centroid may not lie within the feature, and the
ultimate eroded point may be preferred). A second copy of the image was thresholded
for the cell walls, which were then skeletonized and the image inverted so that the
FIGURE 4.39 The illustration from Figure 4.37(a) with features shaded according to the
width of the lines.
2241_C04.fm Page 265 Thursday, April 28, 2005 10:29 AM
Copyright © 2005 CRC Press LLC
