Russ J.C. Image Analysis of Food Microstructure
Подождите немного. Документ загружается.

BOOLEAN COMBINATIONS
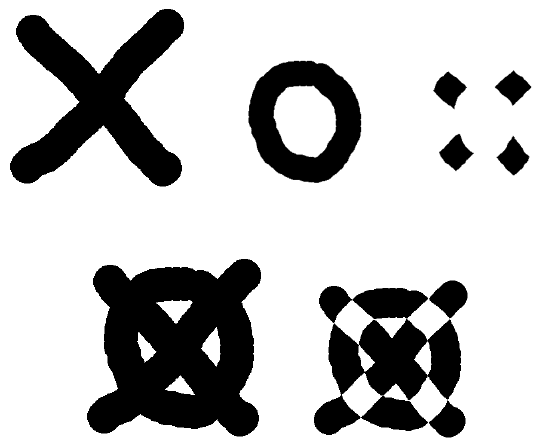
Boolean combinations of two or more binary images of the same scene can be
used to isolate specific structures or features. The use of a Boolean AND has already
been introduced in the context of color thresholding, to combine multiple criteria
from the various color channels. AND keeps just the pixels that are selected in both
of the source images. The other principal Boolean relationships are OR, which keeps
pixels selected in either of the source images, and Exclusive-OR (Ex-OR) which
keeps those pixels that are different, in other words pixels that are selected in either
image but not the other. These relationships are summarized in Figure 4.15, and will
remind many readers of the Venn diagrams they encountered in high school.
These three Boolean operators are frequently used with the logical operator
NOT. This inverts the image, making the black pixels white and vice versa, or in
other words selects the pixels which had not been selected before. Arbitrarily com-
plex combinations of these operations can be devised to make selections. But it is
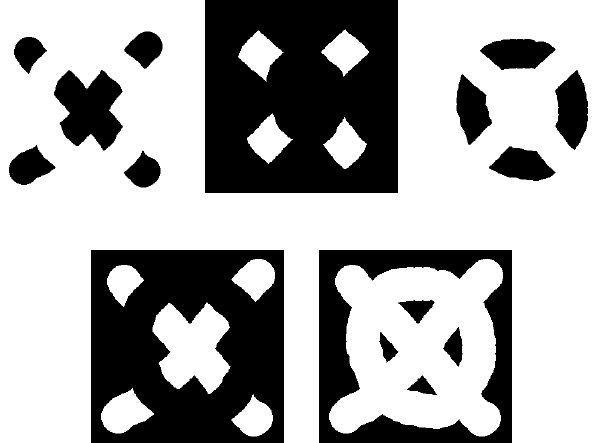
important to use parentheses to explicitly define the order of operations. As Figure
4.16 shows, a relationship such as A AND (NOT B) is entirely different from NOT
(A AND B). This becomes increasingly important as the complexity of the logic
increases.
In addition to the use of Boolean operations to combine thresholding criteria for
various color channels, there is a very similar use for images acquired using different
wavelength excitation or filters, or different analytical signals such as the X-ray
(a) (b) (c)
(d) (e)
FIGURE 4.15
Boolean combinations of pixels: (a, b) original sets; (c) A AND B; (d) A OR
B; (e) A Ex-OR B.
2241_C04.fm Page 236 Thursday, April 28, 2005 10:29 AM
Copyright © 2005 CRC Press LLC
maps from an SEM. But the same procedures can also be applied to different images
that have been derived from the same original image in order to isolate different
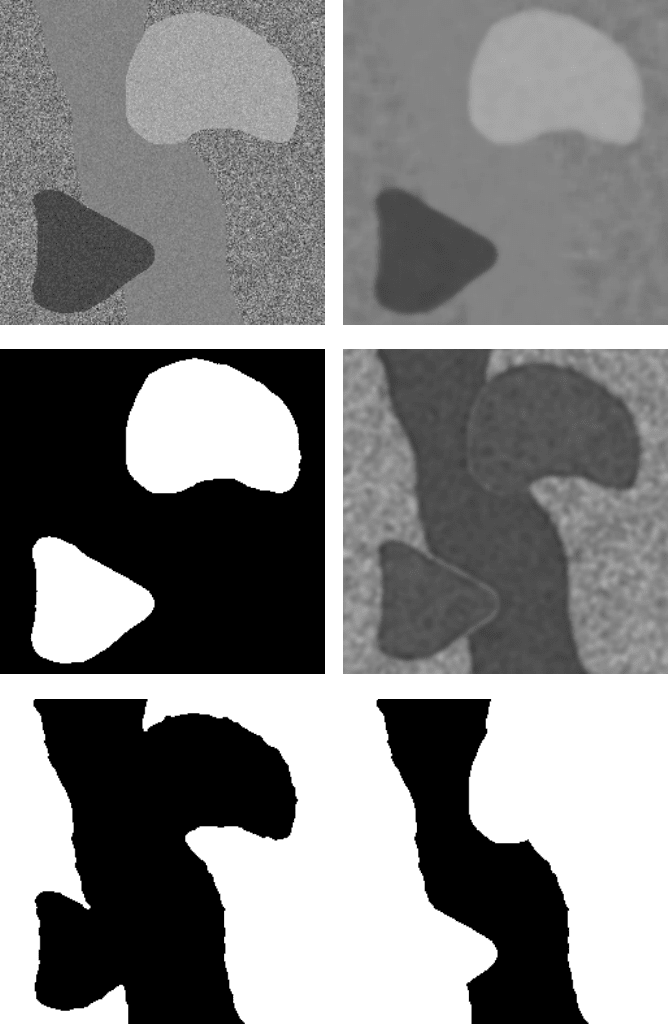
characteristics of the structure. Figure 4.17 shows an illustration. The original figure
was created with regions having different mean brightnesses and different textures.
To select a region based on both criteria, two copies of the image are processed
differently. In one, the texture is eliminated using a median filter, so that only the
brightness differences remain, and can be used for thresholding. Of course, it is not
possible to completely isolate a desired region based on only this one criterion.
Processing the second copy of the image based on the texture produces an image
that can be thresholded to distinguish the regions with different texture values, but
ignoring the brightness differences. Combining the two thresholded images with a
Boolean AND isolates just the selected region that has the desired brightness and
texture properties. Obviously, this can be extended to include any of the image
characteristics that can be extracted by processing as discussed in the previous
chapter.
Boolean logic is also useful for the selection of features present in an image
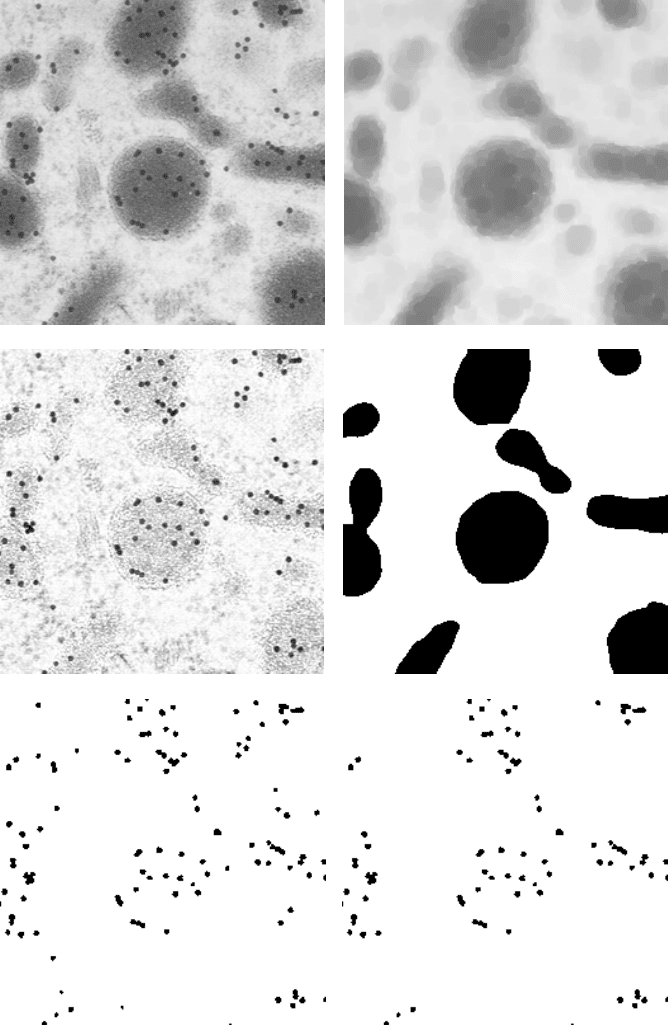
based on their position relative to some other structure. Figure 4.18 illustrates this
for the case of immunogold labeling. Most of the particles adhere to organelles but
some are present in the cytoplasm. Using two copies of the image subjected to
different processing, it is possible to select only those particles that lie on the
organelles. The full procedure includes background leveling, as shown in a previous
chapter, to enable thresholding the particles. It concludes with an AND that elimi-
nates the particles that are not on organelles.
(a) (b) (c)
(d) (e)
FIGURE 4.16
Combinations of Boolean operations: (a) A AND (NOT B); (b) NOT (A AND
B); (c) (NOT A) AND B; (d) (NOT A) OR B; (e) NOT (A OR B).
2241_C04.fm Page 237 Thursday, April 28, 2005 10:29 AM
Copyright © 2005 CRC Press LLC
(a) (b)
(c) (d)
(e) (f)
FIGURE 4.17
Selection based on multiple criteria: (a) example of image with regions having
different brightness and texture; (b) median filter eliminates texture; (c) thresholded binary
from image (b); (d) fractal filter distinguishes smooth from textured regions; (e) thresholded
binary from image (e); (f) combining (c) AND (e) isolates medium grey smooth region.
2241_C04.fm Page 238 Thursday, April 28, 2005 10:29 AM
Copyright © 2005 CRC Press LLC
(a) (b)
(c) (d)
(e) (f)
FIGURE 4.18
Example of Boolean selection: (a) original image, immunogold particles in tissue;
(b) grey scale opening to remove particles and generate background; (c) (a) divided by (b) levels
contrast for gold particles; (d) thresholding (b) gives image of organelles; (e) thresholding (c)
gives image of particles; (f) combining (d) AND (e) gives just the particles on the organelles.
2241_C04.fm Page 239 Thursday, April 28, 2005 10:29 AM
Copyright © 2005 CRC Press LLC
Notice that this procedure would not have been able to select the organelles that
had gold markers and eliminated any that did not. The simple Boolean operations work
on the individual pixels and not on the features that they form. A solution to this in the
form of feature-based logic will be introduced below, but first another important use of
Boolean logic, the application of measurement grids, must be introduced.
USING GRIDS FOR MEASUREMENT
Many measurements in images, including most of the important stereological
procedures, can be carried out by using various types of grids. With the proper grid
many tasks are reduced to measuring the lengths of straight line segments, or to
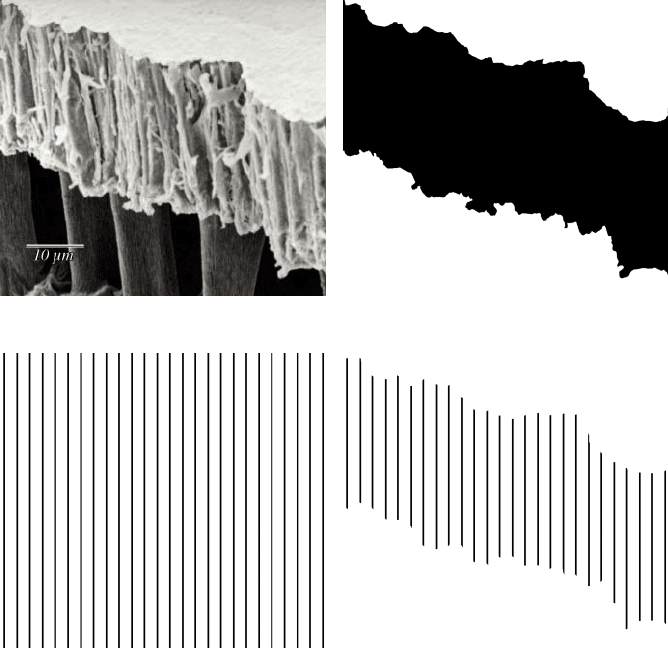
counting points. Figure 4.19 shows an example. A section through a coating has
(a) (b)
(c) (d)
FIGURE 4.19
Measurement of layer thickness using a grid: (a) original (cross-section of
sunflower seed hull, original image is Figure 9-8a in Aguilera and Stanley, used by courtesy
of the authors); (b) thresholded cross-section; (c) grid of vertical lines; (d) (b) AND (c) produces
line segments for measurement (thickness = 21.6 ± 1.3 µm).
2241_C04.fm Page 240 Thursday, April 28, 2005 10:29 AM
Copyright © 2005 CRC Press LLC
been prepared and imaged. The thickness of that coating can be described by the
minimum, maximum, mean, and standard deviation of the vertical dimension.
Thresholding the coating in the image, generating a grid of parallel vertical lines,
ANDing the grid with the thresholded binary, and measuring the lengths of the
resulting line segments, provides all of that information very efficiently.
Of course, other specific grids can be devised in other situations. For example,
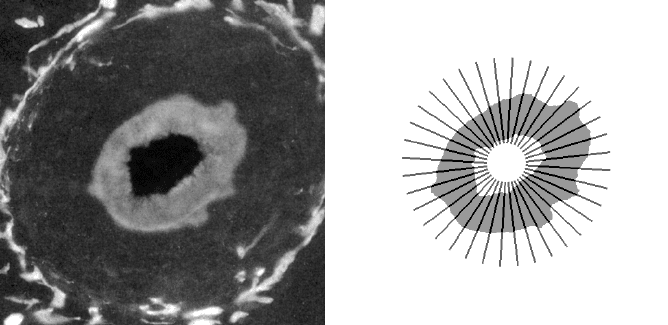
a grid of radial lines would be appropriate to measure the thickness of a cylindrical
structure, as shown in Figure 4.20. In this particular instance, note that because the
vein is not round, but somewhat elliptical (or perhaps the section plane is not
perpendicular to the axis of the vein), some of the grid lines intersect the wall at an
angle and produce an intersection value that is greater than the actual wall thickness.
While this illustrates the use of a radial grid, for this particular measurement there
is a better procedure that uses the EDM which will be introduced later in this chapter.
The vertical line grid works in the first example because by definition or assump-
tion it is the vertical direction in the image that corresponds to the desired dimension,
and because the section being imaged has been cut in the proper orientation. In the
general case of sectioning a structure, however, the cut will not be oriented perpen-
dicular to the layer of interest and the resulting observed width of the intersection
will be larger than the actual three-dimensional thickness. Stereology provides an
efficient and accurate way to deal with this problem.
As shown in Figure 1.32, if a thick layer of structure exists in three dimensions,
random line intersections with the layer (called by stereologists a “muralia”) will
have a minimum value (the true 3D thickness) only if the intersection is perpendicular
to the layer, and can have arbitrarily large values for cases of grazing incidence. A
distribution of the frequency of various intercept lengths declines asymptotically for
large values. Replotting the data as the frequency distribution of the inverse intercept
lengths simplifies the relationship to a straight line. The mean value of the reciprocal
(a) (b)
FIGURE 4.20
Cross-section through a blood vessel: (a) original; (b) thresholded with super-
imposed radial line grid.
2241_C04.fm Page 241 Thursday, April 28, 2005 10:29 AM
Copyright © 2005 CRC Press LLC
value on the horizontal axis is just two thirds of the maximum, which in turn is the
reciprocal of the true three-dimensional thickness.
So the measurement problem reduces to finding the mean value of the reciprocal
of the intercept length for random intersections. If the section plane is random in
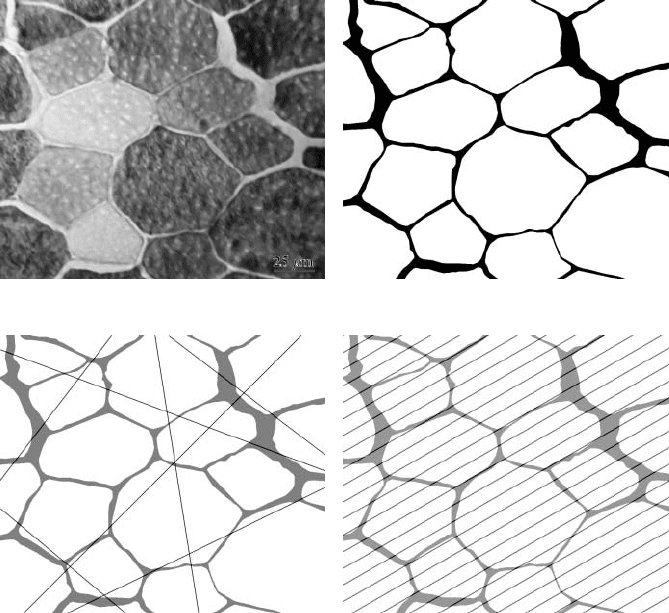
the structure, this could be done with a set of random lines as shown in Figure 4.21(c).
Random lines are very inefficient for this purpose, because they tend to oversample
some parts of the image and undersample others; a systematic measurement that
covers all orientations can be used instead. A grid of parallel lines is generated at
some angle, ANDed with the binary image of the layer, and the intersection lengths
measured. A running total of the inverse of the intercept values can be stored in
memory as the procedure is repeated at many different angles, to produce a robust
estimate of the mean.
(a) (b)
(c) (d)
FIGURE 4.21
Measurement of three-dimensional layer thickness: (a) section of pork muscle
(reacted for glycogen by periodic acid–Schiff reaction; courtesy of Howard Swatland, Depart-
ment of Animal and Poultry Science, University of Guelph); (b) thresholded sections through
layers; (c) random line grid; (d) parallel line grid in one orientation.
2241_C04.fm Page 242 Thursday, April 28, 2005 10:29 AM
Copyright © 2005 CRC Press LLC
In the example, the measured mean reciprocal intercept value (from more than
2000 total intercepts obtained with 18 placements of the parallel line grid, in rota-
tional steps of 10 degrees) is 0.27
µ
m
–1
. From this, the true mean three-dimensional
thickness is calculated as 2.46
µ
m. Thus, a true three-dimensional thickness of the
structure has been measured, even though it may not actually be shown anywhere
in the image because of the angles of intersection of the section plane with the
structure.
In the preceding examples, it was necessary to measure the length of the inter-
sections of the lines with the features. In many of the stereological procedures shown
in Chapter 1 for structural measurement, it is only necessary to count the number
of hits, places where the grid lines or points touch the image. This is also done easily
by using an AND to combine the grid (usually generated by the computer as needed,
but for repetitive work this can also be saved as a separate binary image) with the
image, and then counting the features that remain. Note that these may not be single
pixel features; even if the intersection covers several pixels it is still counted as a
single event.
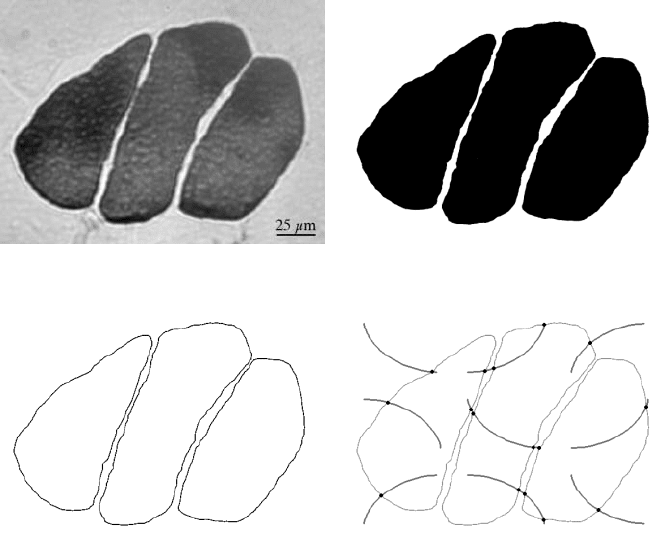
In the example shown in Figure 4.22, a vertical section is used to measure the
surface area per unit volume of bundles of stained muscle tissue. Thresholding the
image delineates the volume of the muscle. The surface area is represented by the
outline of these regions. The outline can be generated by making a duplicate of the
image, eroding it by a single pixel, and combining the result with the original binary
using an Exclusive-OR, which keeps just the pixels that have changed (the outline
that was removed by the erosion). Generating an appropriate grid, in this case a
cycloid since a vertical section was imaged, and combining it with the outlines using
a Boolean AND, produces an image in which a count of the features tallies the
number of hits for the grid. As noted in Chapter 1, the surface area per unit volume
is then calculated as 2·
N
/
L
where
N
is the number of hits and
L
is the total length
of the grid lines.
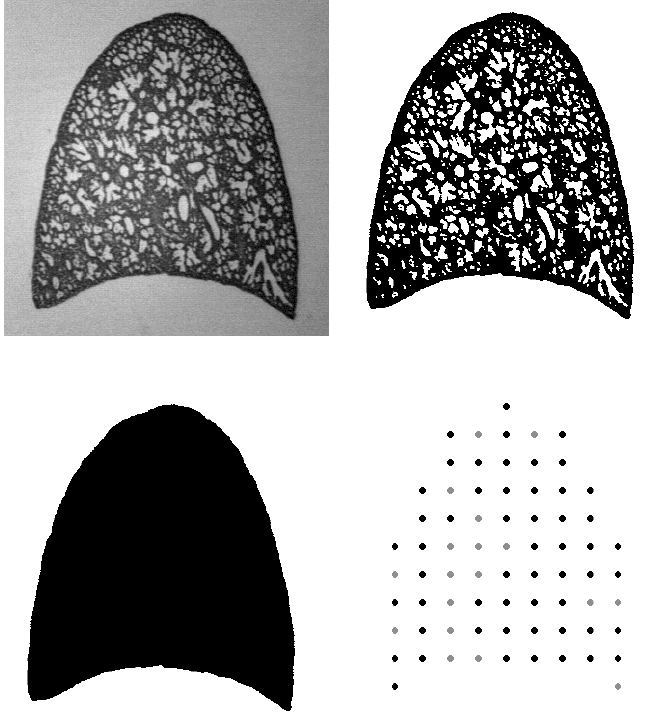
Automatic counting of hits made by a grid also applies to point grids used to
measure area fraction and volume fraction. Figure 4.23 shows an example. The
original image is a transverse section through a lung (as a reminder, for volume
fraction measurements, vertical sectioning is not required since the points in the grid
have no orientation). Processing this image to level the nonuniform brightness
enables automatic thresholding of the tissue. Because the image area is larger than
the sample, it will also be necessary to measure the total cross-sectional area of the
lung. This is done by filling the holes in Figure 4.23(b) to produce Figure 4.23(c)
(filling holes is discussed just after this example).
A grid of points was generated by the computer containing a total of 132 points
(taking care not to oversample the image by having the points so close together that
more than one could fall into the same void in the lung cross section). ANDing this
grid with the tissue image (Figure 4.23b) and counting the points that remain (54)
measures the area of tissue. ANDing the same grid with the filled cross-section image
(c) and counting the points that remain (72) measures the area of the lung. In the figure,
these points have been superimposed, enlarged for visibility, and grey-scale coded to
2241_C04.fm Page 243 Thursday, April 28, 2005 10:29 AM
Copyright © 2005 CRC Press LLC
indicate which ones hit tissue. The ratio (54/72) = 75% estimates the volume fraction
of tissue. Of course, to meet the criterion of uniform sampling these point counts
should be summed over sections through all parts of the lung before calculating the
ratio.
In the preceding example, and several others in this chapter, holes within binary
features have been filled. The logic for performing that operation is to invert the
image, identify all of the features (connected sets of black pixels) that do not have
a connected path to an edge of the image field, and then OR those features with the
original image. The grouping together of touching pixels into features and deter-
mining whether or not a feature is edge-touching is part of the logic of feature
measurement, which is discussed in the next chapter.
(a) (b)
(c) (d)
FIGURE 4.22
Vertical section through pork with slow-twitch muscle fibers stained (acid-
stable myosin ATPase reaction, image courtesy of Howard Swatland, Department of Animal
and Poultry Science, University of Guelph): (a) red channel from original color image; (b)
thresholded binary image of stained region; (c) outlines produced by erosion and Ex-OR; (d)
superimposed cycloid grid and intersection points identified with a Boolean AND.
2241_C04.fm Page 244 Thursday, April 28, 2005 10:29 AM
Copyright © 2005 CRC Press LLC
Filling of holes within thresholded features is often required when the original
image records the outlines of features, as shown in the example of Figure 4.24. The
use of edge-enhancing image processing, as described in the preceding chapter, also
creates images that, when thresholded, consist of outlines that require filling to
delineate features. Macroscopic imaging with incident light sources that produce
bright reflections from objects can also require filling of holes.
(a) (b)
(c) (d)
FIGURE 4.23
Measuring volume fraction with a point grid: (a) cross-section of mouse lung
tissue: (b) leveled and thresholded; (c) holes filled as described in text; (d) ANDing with a
point grid; dark points ANDed with (b), light grey with (c).
2241_C04.fm Page 245 Thursday, April 28, 2005 10:29 AM
Copyright © 2005 CRC Press LLC
