Russ J.C. Image Analysis of Food Microstructure
Подождите немного. Документ загружается.


(a)
(b)
FIGURE 4.3
Drawing of a panda: (a) original; (b) closing, neighbor count > 0, 1 iteration;
(c) opening, neighbor count > 0, 1 iteration; (d) dilation, neighbor count > 7, 1 iteration; 2)
erosion, neighbor count > 7, 1 iteration.
2241_C04.fm Page 216 Thursday, April 28, 2005 10:29 AM
Copyright © 2005 CRC Press LLC

(c)
(d)
FIGURE 4.3 (continued)
2241_C04.fm Page 217 Thursday, April 28, 2005 10:29 AM
Copyright © 2005 CRC Press LLC

illustrates some of the possibilities. It contains isolated pixel noise (shot noise) in
both the white and black areas, as well as fine lines and narrow gaps. Applying a
single iteration of classical open or closing can be used to fill in the gaps (closing)
or remove the fine lines (opening). In classical erosion and dilation, each pixel with
any touching neighbors of the opposite color is flipped to that color. By changing
only those pixels that have more than seven (i.e., all eight touching neighbors) adjacent
pixels of the opposite color, it is possible to use erosion and dilation to selectively
remove just the isolated pixel noise, without altering anything else in the image.
While it is often possible to remove noise from an image by using erosion and
dilation after thresholding, in general this is not as good a method as performing
appropriate noise reduction on the grey scale image before thresholding. More
information is available in the grey scale image to reduce the noise, using tools such
as the median filter or maximum likelihood filter to evaluate the grey scale values
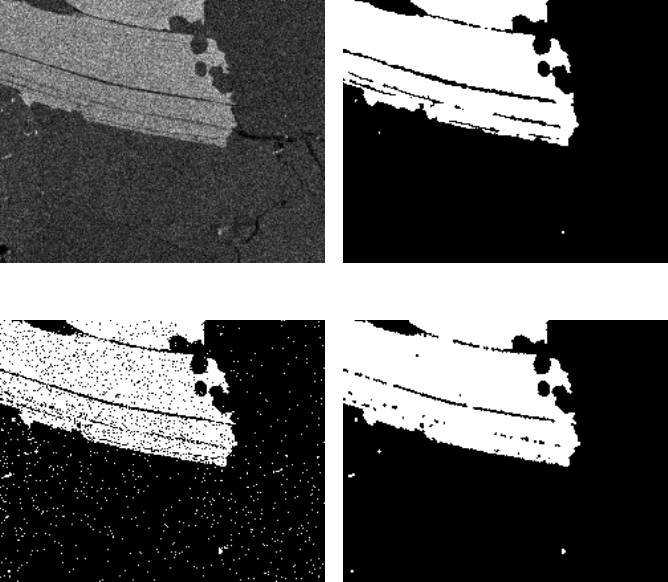
in the neighborhood and adjust pixel values accordingly. As shown in Figure 4.4,
this makes it possible to preserve fine detail and local boundary shapes better than
applying morphological operations to the binary image after thresholding.
(e)
FIGURE 4.3 (continued)
2241_C04.fm Page 218 Thursday, April 28, 2005 10:29 AM
Copyright © 2005 CRC Press LLC
THE EUCLIDEAN DISTANCE MAP
The shape modifications introduced by erosion and dilation are of two kinds:
those that are intended and which are ideally dependent only on the shape of the
original thresholded feature, and those that occur because of the nature of the square
pixel grid from which the features are constructed. The latter alterations are unfor-
tunately not isotropic, and alter shapes differently in horizontal and vertical directions
as compared to 45 degree diagonal directions. Figure 4.5 shows a circle. Ideally, erosion
and dilation would act on this circle to produce smaller or larger circles, with a difference
in radius equal to the number of iterations (pixels added or removed).
(a) (b)
(c) (d)
FIGURE 4.4
Noise reduction: (a) original X-ray map; (b) grey scale noise reduction before
thresholding; (c) thresholding applied to image (a); (d) closing (neighbor count > 5, 1 iteration)
applied to image (c).
2241_C04.fm Page 219 Thursday, April 28, 2005 10:29 AM
Copyright © 2005 CRC Press LLC
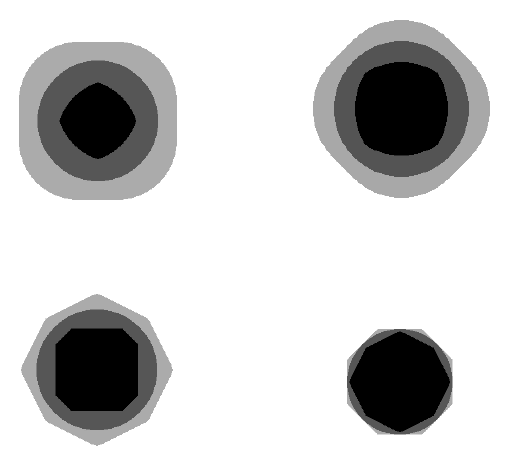
In fact, this is not the actual result. The dark figures show the effect of erosion
using twenty-five iterations. When classic erosion is used, pixels are removed that
touch any background pixel. Removing a pixel in the diagonal directions changes
the dimension by the diagonal of the square pixel, which is 41% greater than the
width of the pixel in the horizontal or vertical directions. Hence, the erosion proceeds
more rapidly in the diagonal directions and the original circle erodes toward the
shape of a diamond. Similarly, the light grey figure shows the result of dilation, in
which the feature grows more in the diagonal direction and evolves toward the shape
of a square.
Using other neighborhood criteria can alter the shape of the eroded or dilated
features, but it cannot produce an isotropic circle as a result. The figure shows the
effects of requiring more than 1, more than 2 or more than 3 neighbor pixels to be
of the opposite color. The shapes erode or dilate toward the shapes of squares,
diamonds or octagons, but not circles. Also the size of the resulting shapes varies,
so that the number of iterations cannot be used directly as a measure of the size
change of the feature. These problems limit the usefulness of erosion and dilation
based on neighboring pixels, and in most cases it is not wise to use them for the
addition or removal of more than 1 or 2 pixels.
There is another approach to erosion and dilation that solves the problem of
anisotropy. The Euclidean distance map (EDM) is used with binary images to assign
(a) (b)
(c) (d)
FIGURE 4.5
Anisotropy of erosion/dilation (grey circle eroded 25 times to produce the black
inner shape, dilated 25 times to produce the light grey outer shape: (a) classic; (b) neighbor
count > 1; (c) > 2; (d) > 3.
2241_C04.fm Page 220 Thursday, April 28, 2005 10:29 AM
Copyright © 2005 CRC Press LLC
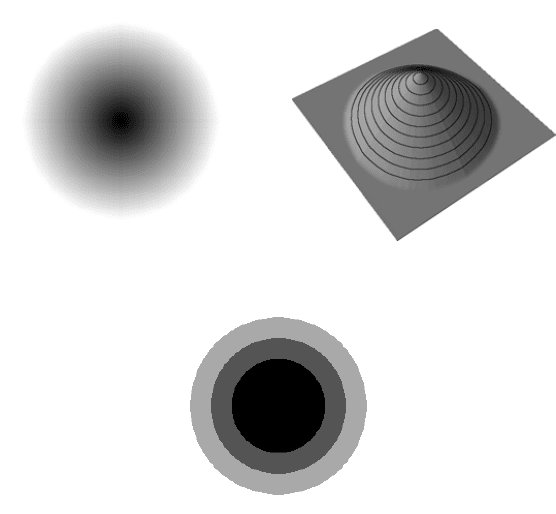
to every pixel that is black (part of the thresholded structure or features) a number
that measures the distance from that pixel to the nearest white (background) pixel,
regardless of direction. The construction of this grey scale image is very rapid, and
as shown in Figure 4.6 produces values that can be rendered as though they were a
surface to produce a smooth mountain with sides of uniform slope. Thresholding
this grey scale image is equivalent to eroding the original binary image. To perform
dilation, the image is inverted and the EDM is computed for the background, and
then thresholded. As shown in the figure, erosion and dilation using the EDM method
is isotropic and produces larger or smaller features that preserve shape. Because it
is not iterative, the method is also much faster than the traditional method.
In general, the EDM-based erosion and dilation methods should be used when-
ever more than 1 or 2 pixels are to be removed from or added to feature boundaries,
because of the improved isotropy and avoidance of iteration. However, the traditional
method using neighbor relationships offers greater control over the selective removal
of (or filling in of) fine lines and points. Also, the EDM-based method requires that
the assigned grey scale pixels values that represent distance have more precision
than the integer values that grey scale images usually contain. The distance between
a feature pixel and the nearest point in the background is a real number whose
precision must be maintained for accurate results, and not all software systems do
(a) (b)
(c)
FIGURE 4.6
EDM of the circle, rendered as a surface to show values (plotted with isobrightness
contour lines) and isotropic erosion/dilation using the EDM (compare to preceding image).
2241_C04.fm Page 221 Thursday, April 28, 2005 10:29 AM
Copyright © 2005 CRC Press LLC
this properly. This becomes particularly important for some of the additional uses
of the EDM discussed below.
Just as for traditional morphological erosion and dilation, the EDM-based oper-
ations can be combined into openings and closings. In many cases, both are needed.
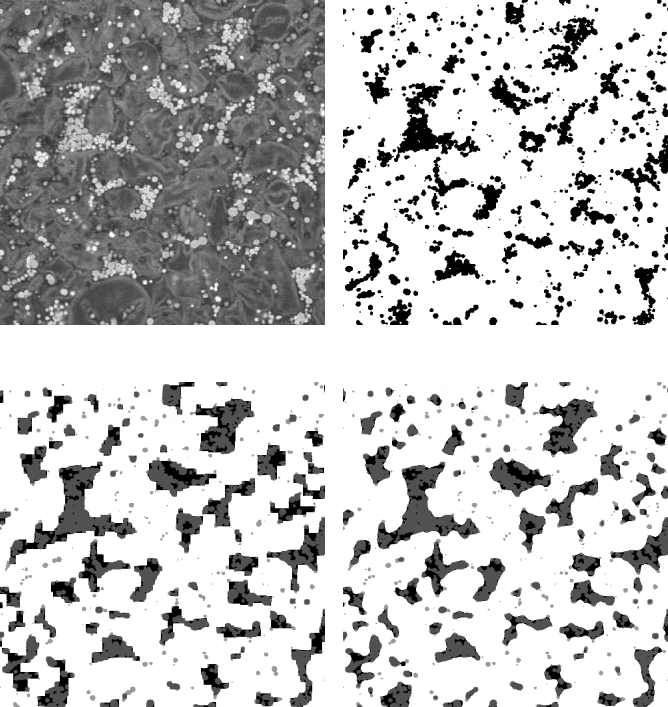
For instance, Figure 4.7 shows the distribution of stained fat particles in custards.
It is the clusters of particles that are important in determining the rheology, appearance,
and other properties of the product. Simply thresholding the red channel of the original
(a) (b)
(c) (d)
FIGURE 4.7
Structural phase separation in custard: (a) grey scale rendering of original color
image (detail of Color Figure 4.7, nile red stain applied to fat globules; see color insert
following page 150); (b) fat droplets thresholded from red channel; (c) classic closing (six
iterations) and opening (three iterations) to delineate phase regions; (d) EDM-based closing
and opening, distance of 6.5 pixels. Images (c) and (d) are shown with original thresholded
image overlaid for comparison; the dark grey areas are the original thresholded pixels, the
light grey areas were removed by the opening, the black regions filled in by the closing).
2241_C04.fm Page 222 Thursday, April 28, 2005 10:29 AM
Copyright © 2005 CRC Press LLC
color image produces a good binary image of the distribution of nile red stain in the
sample. But there are gaps within the cluster regions that must be filled in, and a few
isolated particles in the other portions of the structure that should be erased.
Applying a closing to fill in the gaps, and an opening to remove the isolated,
scattered features, produces an image in which the total volume fraction and size of
the clusters and the spacing between them can be measured. However, if done with
classic morphological methods this process produces suspicious shapes in which
90- and 45-degree boundary lines are prevalent. The EDM-based erosion and dilation
procedures generate shapes that are much more realistic and better represent the
actual structure present, so that more accurate measurements can be made.
SEPARATING TOUCHING FEATURES
The Euclidean distance map has other uses as well. Watershed segmentation
uses the EDM as the basis for separating touching, convex shapes. This is primarily
useful for section images or surface images in which features are adjacent or overlap
only slightly. It is less useful for arrays of three-dimensional particles because
particles of different sizes may overlap significantly, and small particles may be
hidden by larger ones. The method also has difficulties with jagged or irregular
shapes, and depending on the quality of the EDM used to control the separation,
may cause the breakup of fibers.
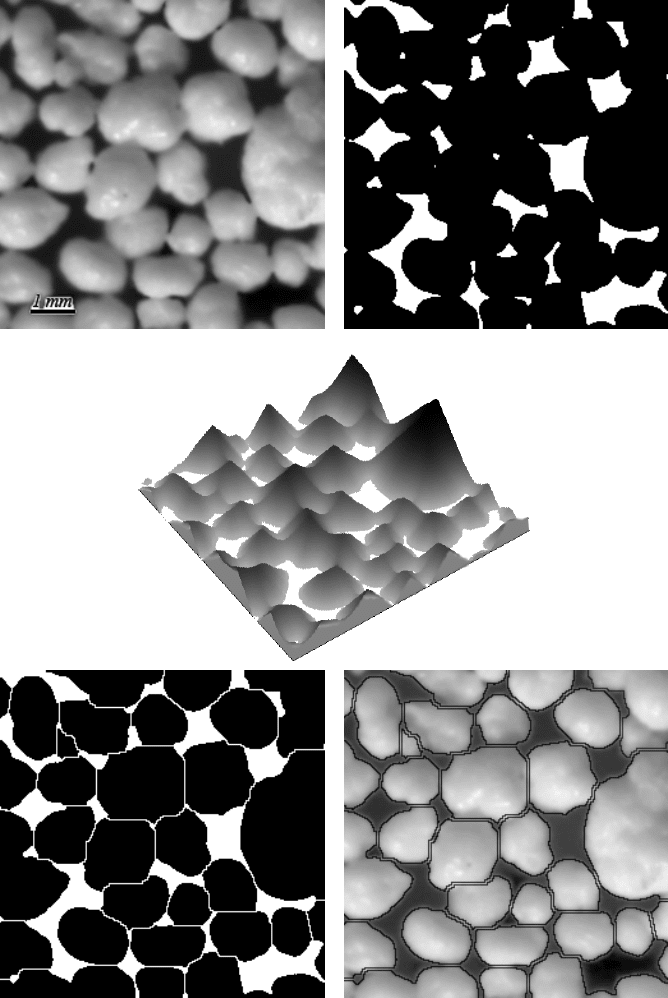
Figure 4.8 shows the basic logic behind watershed segmentation. Thresholding the
image of touching particles produces a binary representation in which all of the pixels
touch, and would be considered to be part of a single feature. The grey scale values
generated by the EDM, when represented as a rendered surface, produce a mountain
peak for each of the particles. Imagine that rain falls onto this terrain; drops that strike
the mountains run downhill until they reach the sea (the background). Locations on the
saddles between the mountains are reached by drops running down from two different
mountain peaks. Removing those points separates the peaks, and correspondingly sep-
arates the binary images of the various particles as shown in the figure. Notice that
some boundaries around the edge of the image are not separated, because the informa-
tion is missing that would be required to define the mountain peak beyond the edge.
The edge-touching features cannot be measured anyway, as discussed in the chapter on
feature measurements, so this does not usually create analysis difficulties.
The watershed method works well when particles are convex, and particularly
when they are spherical (producing circular image representations). It happens that
in many cases, due to membranes or physical forces such as surface tension, particles
are fairly spherical in shape and, as shown in Figure 4.9, the separation of the
particles for counting or individual measurement can use the watershed segmentation
method.
There is an older technique that is also used with spherical particles that has
found its principal application in fields other than food science, but which can
certainly be used for food structure images as shown in Figure 4.10. The two methods
for erosion and dilation described earlier in this chapter apply to binary images after
thresholding. A third erosion/dilation procedure was described in an earlier chapter
that is applied to grey scale images. Used, for instance, to remove features from an
2241_C04.fm Page 223 Thursday, April 28, 2005 10:29 AM
Copyright © 2005 CRC Press LLC
(a) (b)
(d) (e)
FIGURE 4.8
Watershed separation of touching particles: (a) original image; (b) thresholded;
(c) EDM of thresholded image rendered as a surface to show mountain peaks, passes, and
background; (d) watershed separation; (e) feature outlines superimposed on the original image.
(c)
2241_C04.fm Page 224 Thursday, April 28, 2005 10:29 AM
Copyright © 2005 CRC Press LLC
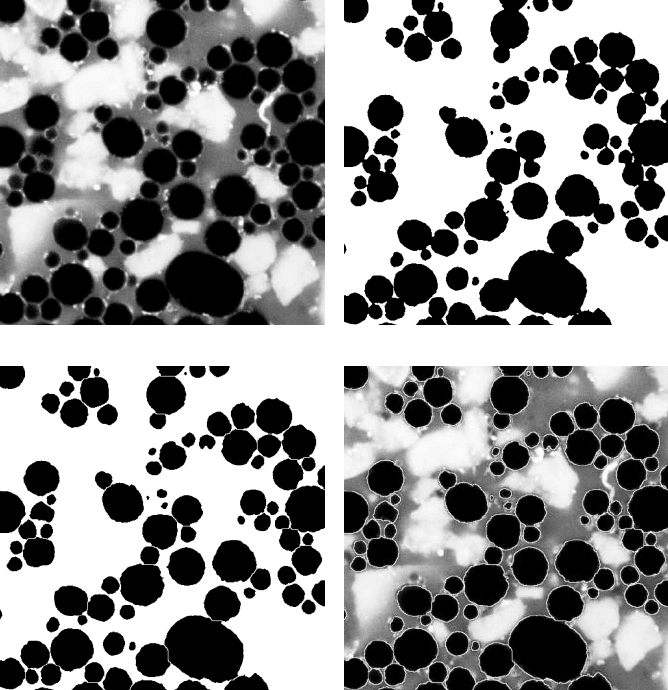
image and produce a background that can be used to level an image by subtraction
or division, grey scale erosion and dilation replace each pixel with the brightest or
darkest (respectively) pixel values in a neighborhood.
When applied to an image such as the one shown in the figure, the process
shrinks all of the features by one pixel on all sides. If the particles are convex and
not overlapped by more than 50%, they will eventually separate before disappearing
completely as the procedure is repeated. By counting the number of features that
disappear at each iteration of erosion or dilation, a distribution of particle sizes can
be obtained. Since each iteration reduces the radius of the particles by 1 pixel, the
distribution is the number of features as a function of the inscribed radius. Performing
the counting operation requires some additional Boolean logic that has not yet been
introduced, but is relatively straightforward and very fast.
(a) (b)
(c) (d)
FIGURE 4.9
Separation of touching spherical particles: (a) red channel of original color
image of mayonnaise; (b) thresholded fat globules; (c) watershed segmentation of (b);
(d) overlay of separate particle outlines on original image.
2241_C04.fm Page 225 Thursday, April 28, 2005 10:29 AM
Copyright © 2005 CRC Press LLC
