Russ J.C. Image Analysis of Food Microstructure
Подождите немного. Документ загружается.

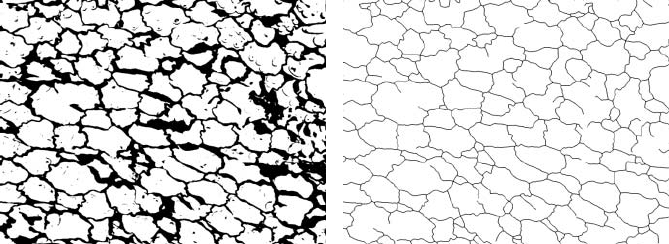
thresholded binary image relaxes the requirements for thresholding. In Figure 3.59
the thresholded red channel (Figure 3.57b) is skeletonized to thin lines whose total
length is related stereologically to the surface area of the cells. Since the skeleton-
ization (discussed in the next chapter) is used to thin down the cell walls, the setting
of the threshold (which controls to some extent the apparent thickness of the stained
tissue) can be varied over a considerable range without affecting the final result.
Of course, not all images contain just two populations of pixels. The statistical
tests can be extended to deal with more groups, provided that the actual number of
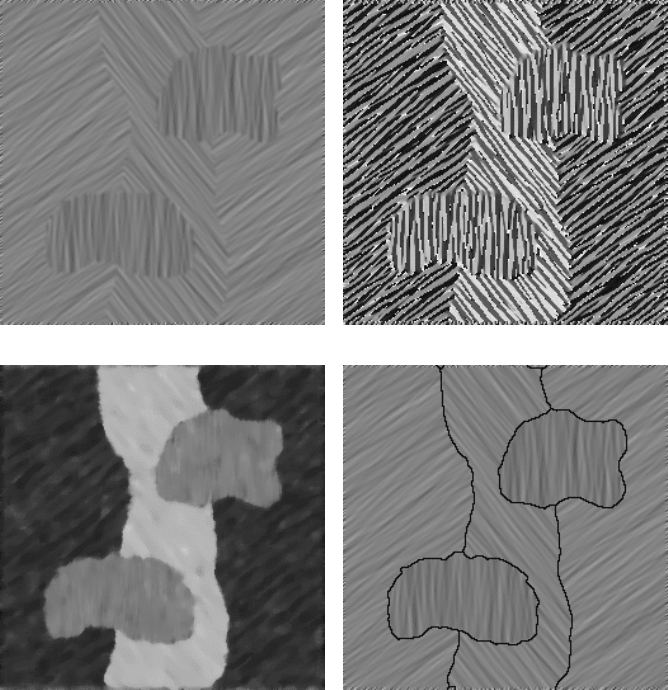
distinguishable structures is known. Figure 3.60 shows an example. The original
image has visually distinguishable regions that have the same brightness values (both
mean and distribution), but the texture has an orientation. Applying a Sobel orien-
tation filter as described above assigns grey scale values from 0 to 255 as the direction
of the brightness gradient vector varies from 0 to 360 degrees. By using a color
lookup table (CLUT) as described previously, the pairs of direction values that are
180 degrees apart in Figure 3.60(b) can be mapped to the same value, and the 0- to
360-degree range of directions converted to 0 to 180 degrees, as shown in Figure
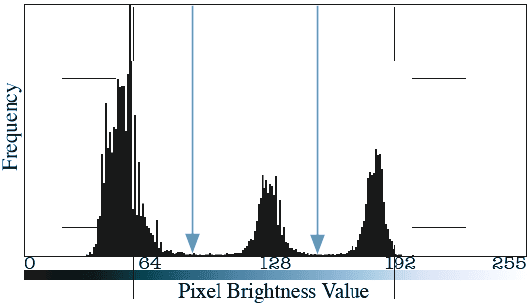
3.60(c). This image has a histogram with three well-defined peaks. Generalization
of the student’s t-test described above to more than two populations results in the
familiar analysis of variance (ANOVA) statistical test. Applying that with the
assumption of three populations of pixels calculates threshold values that separate
the regions.
This example is also a reminder that the thresholding step generally occurs after
various stages of image processing. If nonuniform illumination is present, or exces-
sive image noise, or other image acquisition defects, thresholding cannot be suc-
cessfully accomplished until those problems have been corrected. If enhancement
is required to convert some characteristic of the image that can be visually distinguished
to a brightness difference so that thresholding is possible, that must be done first.
(a) (b)
FIGURE 3.59 Thinning after thresholding: (a) thresholded red channel from Figure 3.57(b);
skeletonized (and short branch segments discarded).
2241_C03.fm Page 195 Thursday, April 28, 2005 10:28 AM
Copyright © 2005 CRC Press LLC
(a) (b)
(c) (d)
FIGURE 3.60 Example of thresholding three populations of pixels: (a) test image containing
three orientations of texture; (b) application of Sobel orientation filter; (c) conversion of 0 to
360° angle values to 0 to 180° values; (d) boundary lines between regions obtained by
automatic thresholding using an ANOVA test; (e) histogram showing three well-separated
peaks, and the threshold settings calculated using an ANOVA statistical test used to produce
the boundaries shown in image (d).
2241_C03.fm Page 196 Thursday, April 28, 2005 10:28 AM
Copyright © 2005 CRC Press LLC
AUTOMATIC THRESHOLDING USING THE IMAGE
All of the methods described above use the image histogram as a starting point,
and treat the pixel values as individual and independent bits of information. In
particular, they ignore the relationship between a pixel and its neighborhood. Most
pixels in an image represent the same structure as their neighbors, and have similar
brightness values. Only a few lie adjacent to the boundaries between one structure
and another, or between feature and background. When we perform manual threshold
adjustment, rather than observing the histogram, most of the attention is directed
toward the appearance of the resulting image. The boundaries of the thresholded
binary representation of the structure must agree with what is seen and what is
known about the structures.
One of the most commonly encountered situations is images in which the feature
boundaries are locally smooth. For liquids, such as the images in Figures 3.55 and
3.56, surface tension creates a force that makes the droplets more-or-less spherical
and makes the surfaces locally smooth. In tissue, cell membranes do the same. Many
structures that form by slow growth have locally smooth boundaries because diffu-
sion along the boundary tends to fill in any irregularities. Wear on surfaces can also
result in smooth shapes, as can local melting. When it is expected that the boundaries
should be smooth, the process of adjusting a threshold setting involves watching the
image and moving the slider so that the irregularities along the boundary are min-
imized. An algorithm that finds the threshold setting such that minor changes in
threshold produce the least change in the total length of the perimeter can automate
the process.
(e)
FIGURE 3.60 (continued)
2241_C03.fm Page 197 Thursday, April 28, 2005 10:28 AM
Copyright © 2005 CRC Press LLC
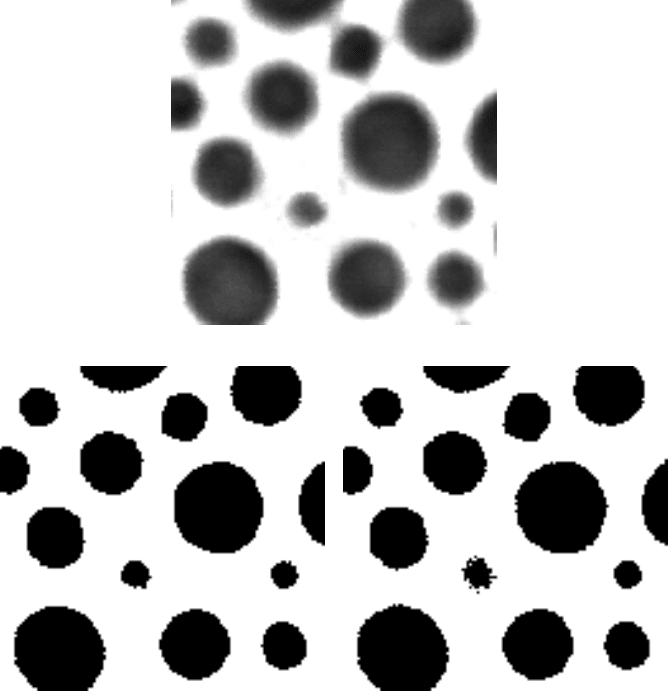
Figure 3.61 shows an image of bubbles in a whipped foam food product (the
full image was shown in Chapter 2, Figure 2.19). Setting an accurate threshold is
difficult because of the intermediate grey values that lie around the periphery of the
bubbles (due to the penetration of light into the foam so that the image represents
a significant depth in the material). It is reasonable to expect the bubbles to have
smooth borders, due to surface tension. Thresholding this using the smoothest
perimeter criterion produces a setting of 121 on the 0 to 255 scale. Changing that
setting even slightly (a value of 125 is shown in the figure) makes the borders of
the bubbles significantly more irregular.
(a)
(b) (c)
FIGURE 3.61 Smooth boundary thresholding: (a) detail of image of bubbles in a whipped
food product (courtesy of Allen Foegeding, North Carolina State University, Department of
Food Science); (b) binary image resulting from automatic threshold setting for smoothest
perimeter; (c) binary image resulting from changing the threshold setting from 121 to 125.
2241_C03.fm Page 198 Thursday, April 28, 2005 10:28 AM
Copyright © 2005 CRC Press LLC
For images in which the boundary is sharp and has good contrast to begin with,
this method usually produces results that agree closely with what a skilled and
knowledgeable human operator determines. The ability to produce reasonable results
as the image quality degrades is a strong plus for this method. But its use depends
on knowing a priori that the boundaries should be smooth, and this is by no means
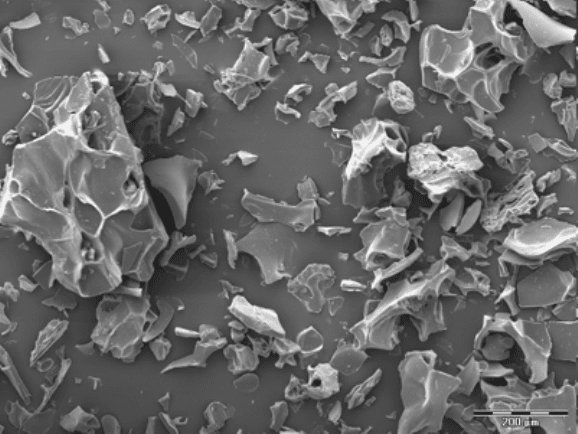
a universal condition. Figure 3.62, for instance, shows an example of particles that
have very rough boundaries. In general, objects produced by fracture and some forms
of agglomeration have rough, even fractal borders. In some cases using a criterion
of maximum, rather than minimum, perimeter change with threshold setting can
successfully produce automatic threshold values.
Many other criteria can be used to generate automatic thresholding algorithms,
but all require independent knowledge about the nature of the sample, which in most
cases must come from information external to the image. It is often useful to try to
make such knowledge explicit by forcing yourself to write down every detail you
can think of about the specimen, its preparation, and the imaging process. If this
information is sufficient to allow someone else to obtain the same images, results,
and understanding that you have, then probably the list contains the information that
would enable successful thresholding of the features.
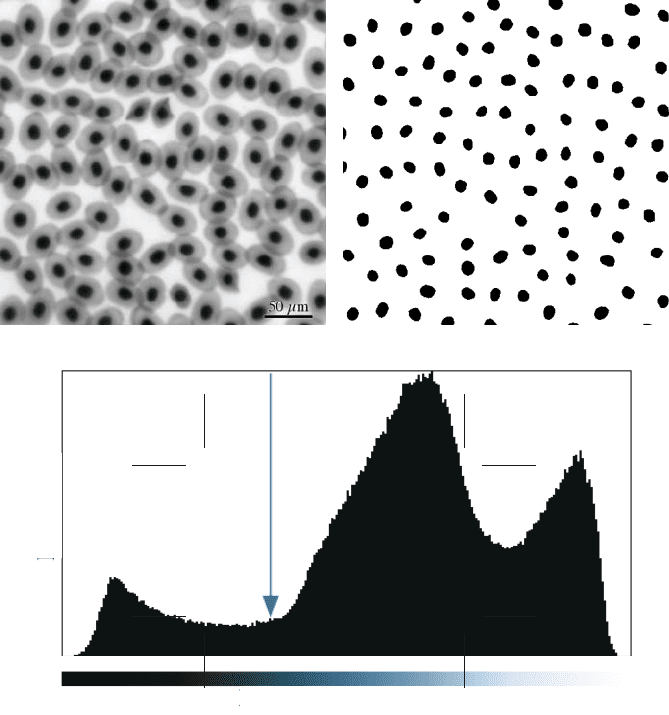
Figure 3.63 shows an example in which it can be anticipated that the features
(nuclei in frog red blood cells) should all be about the same size. Applying that
criterion to the thresholding process produces the threshold setting shown). It has
no obvious relationship to the shape of the histogram.
FIGURE 3.62 SEM image of pregelatinized cornstarch. Brittle fracture has produced highly
variable, irregular shapes.
2241_C03.fm Page 199 Thursday, April 28, 2005 10:28 AM
Copyright © 2005 CRC Press LLC
OTHER THRESHOLDING APPROACHES
There are many other techniques that are used, particularly in specialized appli-
cations, to separate the features of interest in an image from each other or from the
background. One of these, often used in robotics and machine vision, is a split-and-
merge strategy. Starting with the entire image, the histogram is examined. If statistical
(a) (b)
(c)
FIGURE 3.63 Threshold setting based on size uniformity: (a) original (frog red blood cells);
(b) thresholded binary result; (c) histogram with threshold setting.
Pixel Brightness Value
Frequency
064128
192 255
2241_C03.fm Page 200 Thursday, April 28, 2005 10:28 AM
Copyright © 2005 CRC Press LLC
tests indicate that it is not composed of a single class of pixels, the image is split,
usually into four parts (from which the name “quadtree” is also taken to apply to
this method). The same uniformity test is repeated on each part, so that any regions
that are not homogeneous are ultimately split down to the individual pixels. At the
same time, after each iteration of splitting, regions are compared to their neighbors
and joined (merged) if the same statistical test indicates similarity. The method is
reasonably efficient, but depends critically on the ability to detect the presence of
inhomogeneity within a region from the histogram. If the inhomogeneity represents
only a small fraction of the area, it is unlikely to be detected.
Another approach that is complementary to traditional thresholding draws con-
tour or iso-brightness lines on the image. Instead of using the logic that a peak in
the histogram indicates the similarity of the pixels represented, this method examines
the valleys in the histogram as indicators of boundaries between regions. Contour
lines have several advantages for separating the structures in an image. For one
thing, they are continuous lines that close on themselves (or run off the edge of the
image). For another, it is not necessary for a pixel to have any particular value to
locate the contour line. It follows a path between values that are greater and ones that
are smaller than a given threshold value. Finally, the contour lines very often correspond
to the visually detected boundaries in images, even for rather complex structures.
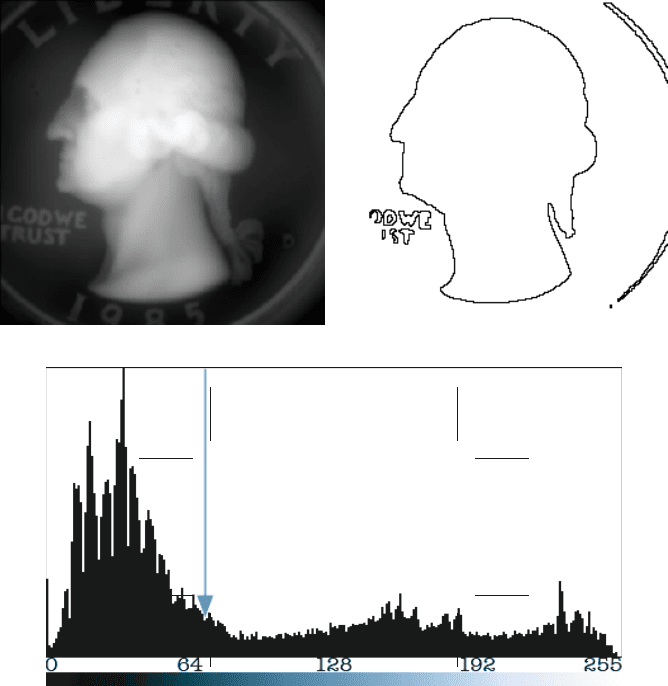
Figure 3.64 shows a simple contour line applied to a scanned-probe image of a
coin. In this case, the brightness of each pixel represents a physical elevation.
Consequently, the contour line really is a line of constant elevation and as such can
mark the boundaries of the raised figure on the surface.
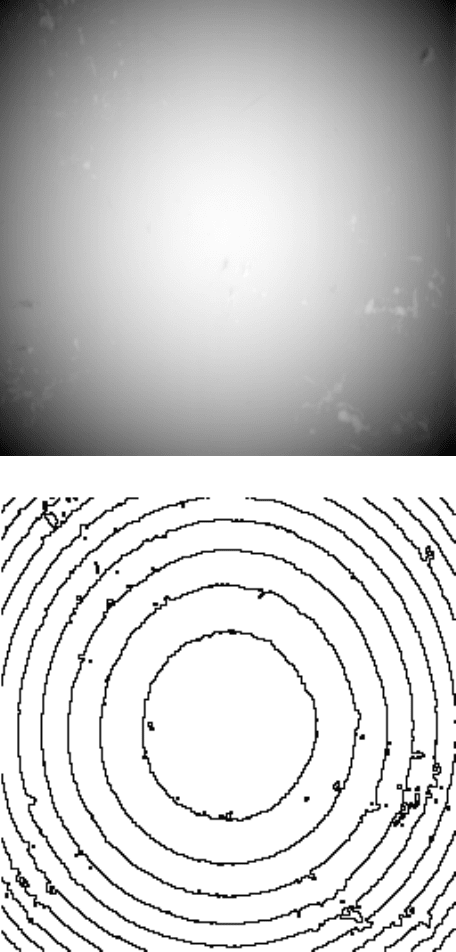
It is easy to extend this method to draw multiple contour lines, converting the
image to a contour map in which the lines have exactly the same meaning as on a
conventional topographic map. In the example of Figure 3.65, a set of ten lines
equally spaced in brightness or elevation are drawn using a scanned probe image of
the tip of a ball point pen. The irregularities of the lines show clearly the roughness
of the ball, their spacing can be used to measure its curvature, and the elongation
of the circles into ellipses measures the out-of-roundness of the ball. All of this same
information is, of course, present in the original image, but it is much more visible
and more easily accessed for measurement purposes in the contour map.
One of the most useful attributes of the contour method is the outlining of
boundaries around features, which facilitates measurements of structure or features.
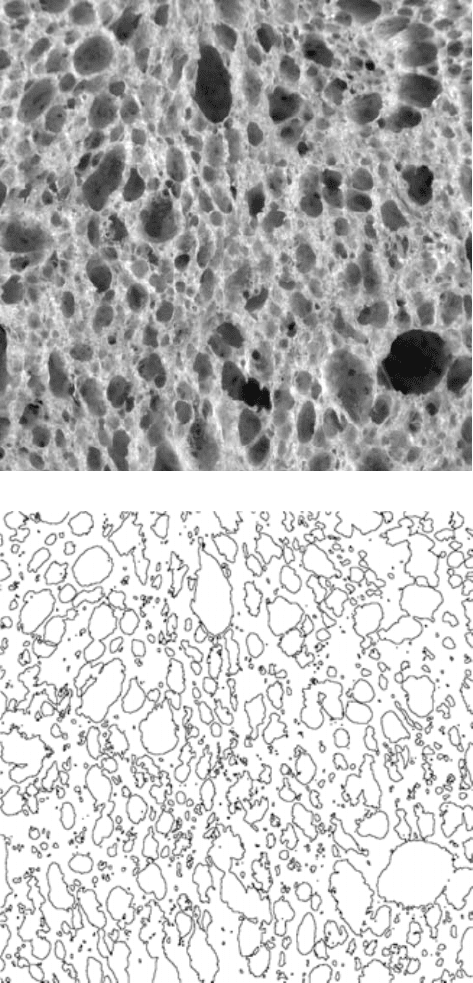
In Figure 3.66 a typical image of bread shows a variety of pore sizes and shapes.
Drawing a single contour line on this image produces an outline of the pores. The
same logic for determining the optimum threshold setting was used as for binary
thresholding (in this example the Shannon algorithm). As discussed in Chapter 1,
the resulting lines provide a direct measure of the total surface area of the pores (the
surface area per unit volume of the bread, which is a major factor in the mouth-feel
and texture of the bread, is equal to 4/π times the total length of the contour lines
divided by the area of the image).
2241_C03.fm Page 201 Thursday, April 28, 2005 10:28 AM
Copyright © 2005 CRC Press LLC
(a) (b)
(c)
FIGURE 3.64 Drawing a contour line on an image: (a) scanned probe image of a coin; (b)
contour line drawn to outline the raised head; (c) histogram of image (a) with the brightness
value used for the contour line marked.
2241_C03.fm Page 202 Thursday, April 28, 2005 10:28 AM
Copyright © 2005 CRC Press LLC
(a)
(b)
FIGURE 3.65 Drawing a contour map: (a) scanned probe image of a ball point pen; (b)
contour map drawn from the image.
2241_C03.fm Page 203 Thursday, April 28, 2005 10:28 AM
Copyright © 2005 CRC Press LLC
(a)
(b)
FIGURE 3.66 Contour lines for structure measurement: (a) image of pores in bread; (b)
contour line drawn to mark the edges of the pores.
2241_C03.fm Page 204 Thursday, April 28, 2005 10:28 AM
Copyright © 2005 CRC Press LLC
