Pump Handbook by Igor J. Karassik, Joseph P. Messina, Paul Cooper, Charles C. Heald - 3rd edition
Подождите немного. Документ загружается.

2.42 CHAPTER 2
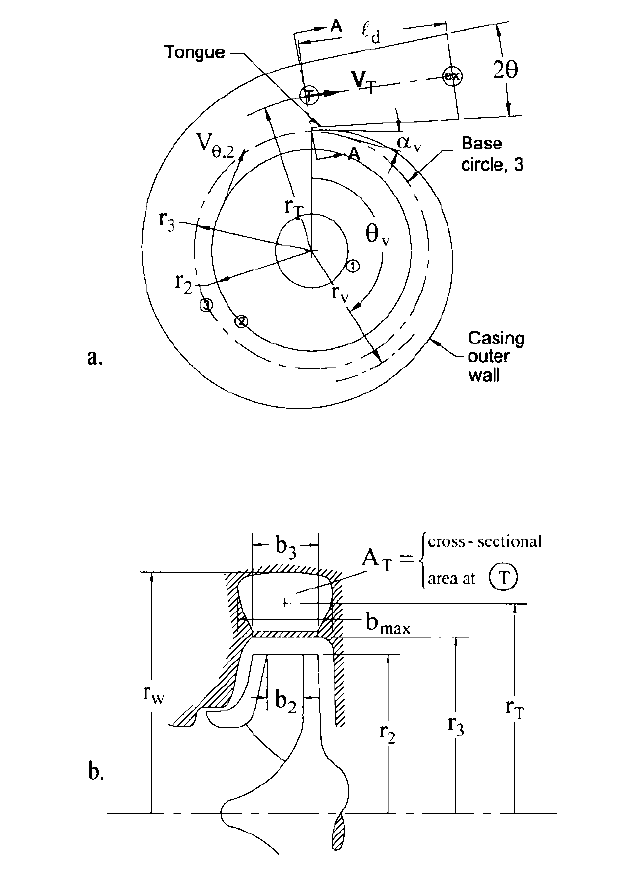
FIGURE 20 Volute casing: a) polar view; b) meridional view including Section A-A of throat T
Gap B. (For radial-discharge impellers, as in Figure 20, this is a radial gap, and the base
circle has radius r
3
.) Beginning at the tongue, the cross-sectional area A
v
of the volute pas-
sage is zero, but it increases with angle u in the direction of rotation, ending up at area
A
T
in the “throat” T, as depicted in Figure 20. Worster demonstrated that the desired
peripheral uniformity of static pressure can be achieved if the product rV
u
is constant
2.1 CENTRIFUGAL PUMP THEORY 2.43
everywhere in the volute
25
. One-dimensionally, this means that r
T
V
u,T
r
2
V
u,2
; and, if the
velocity V
T
is essentially tangential (in the u-direction), r
T
V
T
r
2
V
u,2
. The diffusion or
reduction of the velocity V from the impeller periphery at r
2
to the larger r
T
of the throat
produces a static pressure increase above that at the impeller exit; however, friction losses
in the volute would cause a reduction in static pressure around the impeller at r
2
from
tongue to throat unless the throat area A
T
Q/V
T
is slightly enlarged, creating a little
more diffusion to compensate for this loss. Thus, in practice, at the BEP,
(61)
At off-BEP conditions, the volute will be either too large or too small and Eq. 61 will not
be satisfied. When the flow coefficient (or Q/N) drops below the BEP value, there will be
excessive diffusion and an increase of static pressure around the volute from the zero area
point around to the maximum area point at the throat. Proceeding around further, past
the throat, a sudden drop in pressure occurs across the tongue to bring the pressure back
to what it was at the starting point
25
. The opposite situation occurs above BEP.
Each of these off-BEP circumferential static pressure distributions is properly
viewed as the consequence of a mismatch between the head-versus-flow characteristics
of the impeller and volute
26
. For the impeller, there is the falling, straight, H
i
-versus-Q
line or “impeller line” of Figure 6, whereas the volute characteristic or “casing line”
would be a straight line starting at the origin of Figure 6 and crossing the impeller line
at the match point, which is generally at or close to the BEP flow rate. This casing line
is straight because the throat velocity V
T
varies directly with flow rate Q and, through
Eq. 61, directly with the ideal head H
i
—
because r
2
V
u,2
H
i
(Eq. 15b for V
u,1
0). In
other words, the same volute could be optimum at a different value of Q if it were paired
with another impeller whose H
i
-versus-Q line crossed this same casing line at that dif-
ferent Q.
To essentially eliminate the consequent radial thrust on the impellers of large pumps
at off-BEP conditions, a double volute is used; that is, there are two throats, 180 degrees
apart, there being either two discharge ports or a connecting “back channel” to carry the
fluid from one of the throats around to join the flow emerging from the other
—
to form a
single discharge port.
The value of the volute cross-sectional area A
v
at a given polar position u
v
can be found
for the portion of the total pump flow rate Q being carried in the volute at that u
v
-position
together with the condition rV
u
constant versus radius. This will produce a distribution
A
v
(u) that is slightly below a straight-line variation versus u
v
from zero to A
T
. Often, the
practice is to use the latter straight-line design because this produces larger values of A
v
where the hydraulic radius of the volute is small, thus compensating for the greater fric-
tion loss in that region through lower velocity
—
particularly for the smaller pump sizes.The
cross-sectional shape of the volute is dictated by the need to make a minimum-loss transi-
tion from a small area at the beginning of the volute where the height (as can be deduced
from Figure 20b) is much smaller than the width b
3
to the throat, for which the height (to
the outer casing wall at r
w
) and the width b
max
are more nearly equal. Too small an aspect
ratio (height/width) decreases the hydraulic diameter too much and increases the loss.
There is another transition from the throat through an essentially conical diffuser (which
may negotiate a turn) to a larger, circular exit port. This diffuser can be designed with the
help of charts of flow elements and will normally have a 7-deg. angle of divergence and a
discharge area up to twice that of the throat A
T
27
.Thus, there is a substantial diffusion from
the impeller periphery to the pump or stage exit port.This generally produces a static pres-
sure rise in the collection system that is 20 to 25 percent of that of the whole stage.
b) Vaned diffusers. A vaned diffuser is rotationally symmetric and, if properly applied,
produces minimal radial thrust over the whole flow rate range of a pump. Although diffu-
sion can be accomplished in a radial outflow configuration without vanes due to the essen-
tial constancy of the angular momentum per unit mass rV
u
, one rarely finds a pump with
a vaneless diffuser, partly because so much radial distance is needed to effect the reduc-
tion of tangential velocity required, as well as the still larger volute needed on single-stage
r
T
V
T
10.9 to 0.952 r
2
V
u, 2
2.44 CHAPTER 2
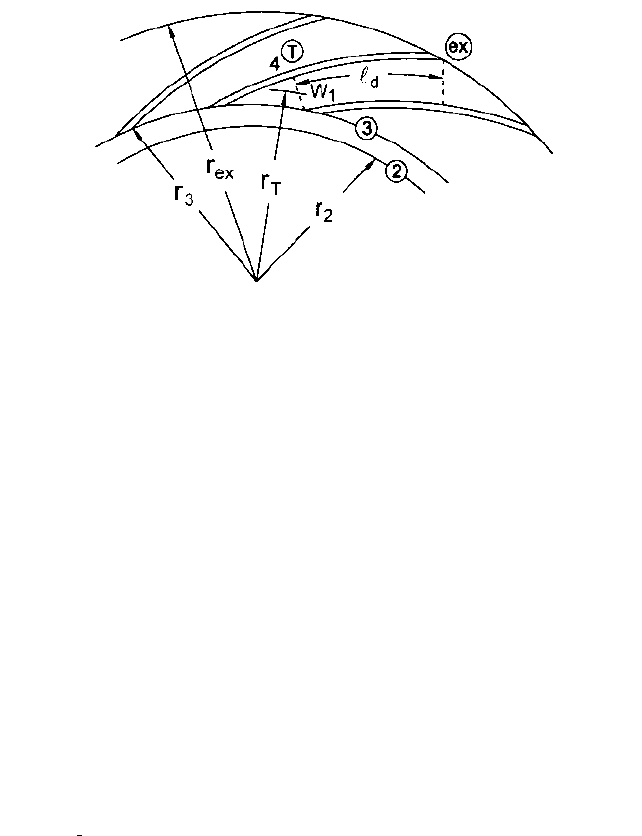
FIGURE 21 Vaned diffuser
pumps to collect the fluid at the exit of such a diffuser. Also, the absolute flow angle a
2
(Fig-
ure 15) of the fluid leaving the impeller is usually too small to satisfy the conditions for
stall-free flow in a vaneless diffuser
28
. A vaned diffuser, on the other hand, can accomplish
the reduction of velocity in a shorter radial distance. Also it can diffuse axially and, to a
degree, even with radially inward flow.
Vaned diffusers are similar to multiple volutes in concept, except they are subject to off-
design flow instabilities if not shaped correctly. Width b
3
is usually slightly greater than
b
2
in order to accommodate discrepancies in the axial positions of impellers that feed them.
With reference to Figure 21, “Gap B” ( r
3
r
2
) is in effect a short vaneless diffuser, and
by the time the fluid has reached the throat (the dashed line at Station 4), it has gained a
substantial portion of the static pressure recovery that takes place via diffusion from Sta-
tion 2 to Station “ex.” This “pre-diffusion” is enhanced by the fact that the throat area at
Station 4 ( b
3
w
1
per passage for parallel-walled radial-flow diffusers) is larger than it is
for volutes, the following relation applying to diffusers
29
:
(62)
Therefore, more diffusion than would result from applying Eq. 61 occurs in a vaned dif-
fuser, the skin friction loss due to an otherwise higher velocity at the throat being offset by
an efficient reduction of the velocity up to that point and a lower velocity onward.
The fully vaned portion from throat to exit (Figure 21), which performs most of the rest
of the diffusion and associated static pressure recovery of the stage, is designed to perform
efficiently and maintain stable flow. For typical radial-flow geometries with parallel walls,
the vanes can be of constant thickness and comparatively thin or can thicken up to form
“islands.” The latter approach usually produces a channel that is two-dimensional with
straight sides diverging at an included angle, length-to-entrance width //w
1
, and area ratio
A
ex
/A
T
in a combination that avoids appreciable stall
30
. A typical combination is an included
angle of 11 deg., //w
1
4, and A
ex
/A
T
1.8, which also applies for vanes of constant thick-
ness, as illustrated in Figure 21. Constant thickness vanes have curvature.This modifies the
performance somewhat
31,32
, but it allows a smaller overall radius ratio of the diffuser, r
ex
/r
3
.
Also, this ratio r
ex
/r
3
will be smaller as the number of vanes n
v
increases.The best expe-
rience seems to be with diffusers that have only a few more vanes than the number of
impeller blades n
b
(n
b
rarely exceeds 7 in traditional commercial pumps). For pumps of
higher energy levels (or high head per stage, as discussed further on in connection with
high-energy pumps), it is important that n
v
be chosen so as to avoid a difference of 0 or 1
between n
b
and n
v
or their multiples
—
up to at least the third multiple or “order” of each.
A difference of 2 should also be avoided for at least the lower orders
33
.
At off-design flow-coefficients (or off-design flow rate at a constant speed), the angle a
of the absolute velocity vector V (Figure 15) approaching the diffuser will vary; yet, for typ-
1
2
r
T
V
T
0.8r
2
V
u, 2
2.1 CENTRIFUGAL PUMP THEORY 2.45
ical stages, a wide range of flow coefficient is possible without damaging instabilities, even
at high energy levels. This is likely the case because a is rather small at the design point
or BEP (except for designs having high specific speed), so variations of the angle that occur
with flow changes are within the unstalled performance range of the diffuser vane system.
c) Return passages. Conducting the relatively low-velocity fluid from the diffuser to the
eye of the next impeller in a multistage pump is accomplished with return vanes or pas-
sages that also deswirl the fluid wholly or partially. Except for development of stall in the
diffuser, these passages will not see a changing angle of the approaching velocity vector
because the diffuser feeding them is a stationary element. In radial-flow pumps, there is
a sharp turn in the meridional plane in order to redirect the fluid inward. The fluid, still
possessing a circumferential component of velocity that is greater than the meridional
component, actually sees a much gentler turn. However, downstream of this point, a sharp
turn of the blades is invariably a feature of a return passage; and this, together with the
need to ensure undistorted flow into the following impeller, often dictates that the vane
system accelerate the fluid as it approaches the eye. Although losses in the return pas-
sages
—
being related to the low velocity within them
—
have a minor effect on the overall
stage efficiency, the design of such passages must ensure unstalled flow into the impeller in
order to avoid the negative impact of a distorted inlet flow on the efficiency and to promote
pulsation-free operation of the impeller.
A variety of return-passage geometries exist, some of which are presented in the litera-
ture
29,34
. The continuous-vane type is integral with the upstream diffuser, thereby eliminat-
ing the entry losses into yet another vane system after the diffuser
4,34
. Improvements in
manufacturing technology have made this potentially more efficient approach more viable
for radial machinery. The continuous-vane concept is standard practice in the design of
mixed-flow “bowl”-type pumps
21
. The diffusing stator vane row that receives the fluid from
the impeller of an axial-flow pump
—
being an axial-flow element itself
—
possesses the return
feature already. Diffusion in axial-flow stators is typically accomplished by a reduction in
velocity of about 30 to 40 percent. The actual value is governed by an acceptable level of the
diffusion factor, Eq. 57. (A similar reduction in relative velocity is needed for an axial-flow
impeller to generate static pressure, as can be seen from Eq. 21. By comparison, centrifugal
impellers, on the rms streamline, usually have W
2
about equal to W
1
—
as seen in Figure 17.)
Axial-Flow Pumps The preceding development, though general, is applicable mainly to
centrifugal and mixed-flow pumps. In that procedure, the impellers have appreciable solid-
ity, and original blade shapes are constructed from the viewpoint of one- or two-dimensional
channel flow. The collectors are often volutes or non-axial-flow vane systems. Performance
is not known a priori and so must be estimated, as outlined further on. On the other hand,
the extensive two-dimensional, experimental, axial-flow cascade data amassed by NACA
researchers
23
and others enables the designer to adopt existing airfoil blade shapes and so
predict the performance with greater confidence. The procedure for utilizing these shapes
and the corresponding experimental results has long been the basis for designing axial-
flow compressors for gas-turbine engines and is clearly described by Hill and Peterson
35
.
This approach is widely used, especially for high-specific-speed, low-solidity axial-flow pro-
peller pumps—in designing both rotating and stationary blade rows. Insights for propeller
pump design and performance characteristics can be found in Stepanoff
4
.
An exception to this axial-flow pump design approach is the case of inducers.Although
they are axial flow pumps, they have high solidity and are usually designed as channel-
flow machines. The design philosophy outlined in the preceding paragraphs is applicable,
except that the blades usually approximate constant- or variable-pitch helices. Perfor-
mance prediction is generally accomplished via one-dimensional calculations and the cor-
relations described in the following paragraphs.
PREDICTING THE PERFORMANCE CURVES ______________________________
The choices made in the foregoing design procedures can and should be verified analyti-
cally, the objectives being first to generate the performance characteristic curves for head
2.46 CHAPTER 2
and power at constant speed and second to ensure stable behavior of the various systems
in which the pump is to be applied. For the first objective, the solution involves analytical
or empirical approaches: a) at non-recirculating flow conditions; that is, from flow rates Q
somewhat below Q
BEP
out to the maximum “runout” flow rate, b) at shut-off (Q 0) and
low flow, or c) the complete set of curves for a given pump predicted by means of
computational fluid dynamics (CFD).
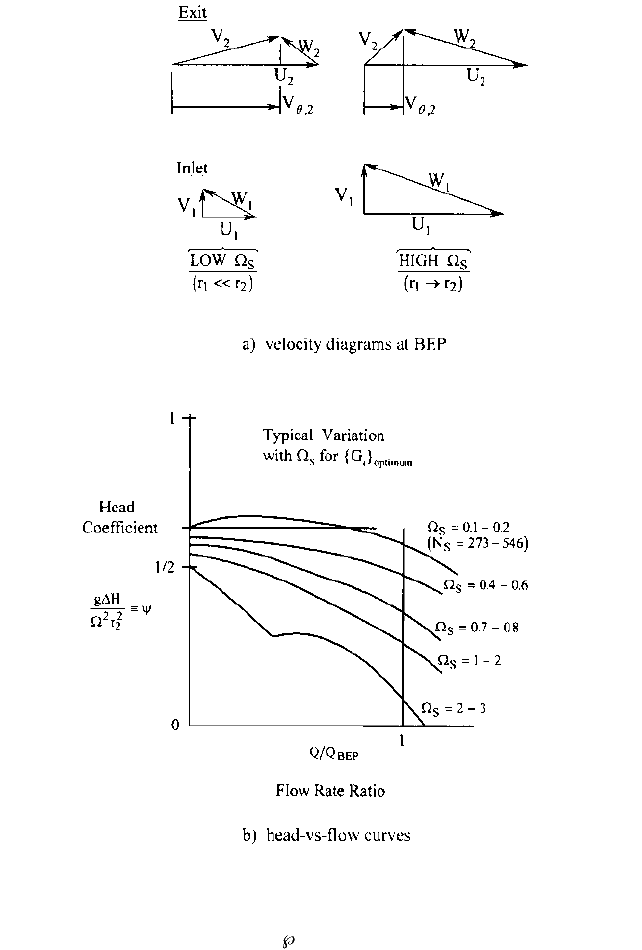
Generating Performance Curves The fluid dynamical limitation on the deceleration
of the relative velocity W determines the shape of the head-versus-flow curves. This is
inherent in the choice made for the head coefficient c in Figure 12, which sizes the
impeller and is illustrated in Figure 22. The typical situation of zero (or nearly so) inlet
whirl V
u,1
0 means that the ideal head coefficient c
i
equals the most significant ratio of
the outlet velocity diagram because from Eqs. 15 and 31 (with for V
u,1
0):
(63)
(64)
Figure 22 illustrates how specific speed
s
affects the BEP value of c
i
and therefore c.
Overall, only a small reduction of W occurs in most impellers. So, at low
s
, the low value
of W
1
associated with the small eye relative to the maximum diameter (Figure 9) enables
the outlet velocity diagram (Figure 22a) to have a high value of V
u,2
/U
2
. On the other hand,
this ratio drops as
s
increases and the eye grows to be as large as the maximum diame-
ter of the wheel. Figure 22b is the result because the value of c at shut-off (about ) is not
based on the one-dimensional concept of velocity diagrams but primarily on the pressure
generated by solid body rotation of stalled (though recirculating) fluid contained within
the impeller. The BEP values of c in Figure 22b are consistent with Figure 12 and illus-
trate why a high-specific-speed impeller has such a substantial “rise to shut-off” of the
head curve. This is dramatically illustrated in Figures 8–10 of Section 2.3.1 in which the
head curves are normalized to that of the BEP
36
.
a) Non-recirculating flows. The BEP efficiency and head can be determined from corre-
lations for typical pumps or from computation of the losses. Fluid dynamic procedures
described in this section can be used to determine the shapes of the head and power curves
at all flow rates to runout, using the BEP as an anchor point for such computations. For
pumps designed conventionally, beginning with Figure 12, Anderson’s overall (BEP) effi-
ciency correlation (Eq. 44) as modified in Figure 10 is useful. Other similar charts, espe-
cially Figure 6 in Section 2.3.1, are in widespread use. The breakdown of the losses
involved, as expressed by Eqs. 8–11, is quantified through the development of the three
component efficiencies h
HY
, h
m
,and h
v
in Table 3. All three decrease with decreasing spe-
cific speed
—
as might be expected from the charts just mentioned.
This can be seen in the h
HY
-expression (a) of Table 3 because c
i
is greater at low
s
as
discussed relative to Figure 22. Jekat’s h
HY
-expression (b) of the table works surprisingly
well, largely because of the flow effect in Figure 9 (explained there as the “size effect” of
larger relative roughness and clearances in smaller pumps) and because low
s
tends to
go hand-in-hand with low flow rate Q.
To compute h
HY
at Q Q
BEP
(and, if required, at Q Q
BEP
as well), it is necessary to go
deeper into the prediction of h
HY
by developing expressions for the losses noted in Eq. 21,
which are basically expansions of the expression for the collector loss coefficient z
c
26
and
for the impeller loss expression (c) of Table 3
37
. In this expression, the incidence loss coef-
ficient k can be obtained from cascade data or developed as a combination of a turning and
a sudden expansion loss
4,8,27
. The “pipe-type friction factor” f can be increased to include
secondary flow and diffusion losses due to blade loading (or turning
38
of the absolute veloc-
ity vector V). The resulting f-value can thus be twice the usual pipe value associated with
the skin friction losses in the passage. (The pipe value of f is found from the well-known
1
2
c h
HY
c
ideal
h
HY
V
u, 2
U
2
c
ideal
U
2
2
1V
u, 2
>U
2
2
U
2
2
2.1 CENTRIFUGAL PUMP THEORY 2.47
FIGURE 22 Performance versus specific speed: a) velocity diagrams at BEP; b) head-versus flow curves.
pipe friction chart—Figure 31 in Section 8.1—by substituting a representative average
passage hydraulic diameter D
h
4A
p
/ for the pipe diameter d.) A further increase in
this f-value occurs if the impeller is missing one or both rotating shrouds; that is, it is a
semi- or fully-open impeller with blade tip leakage losses appearing in the main flow
stream
39
. Multiphase flows in pumps often are accompanied by greater than normal
hydraulic losses; for example, increasing the concentration of solids in the carrier liquid
flowing through a slurry pump increases the f-value still further
40
(see Section 9.16.2).
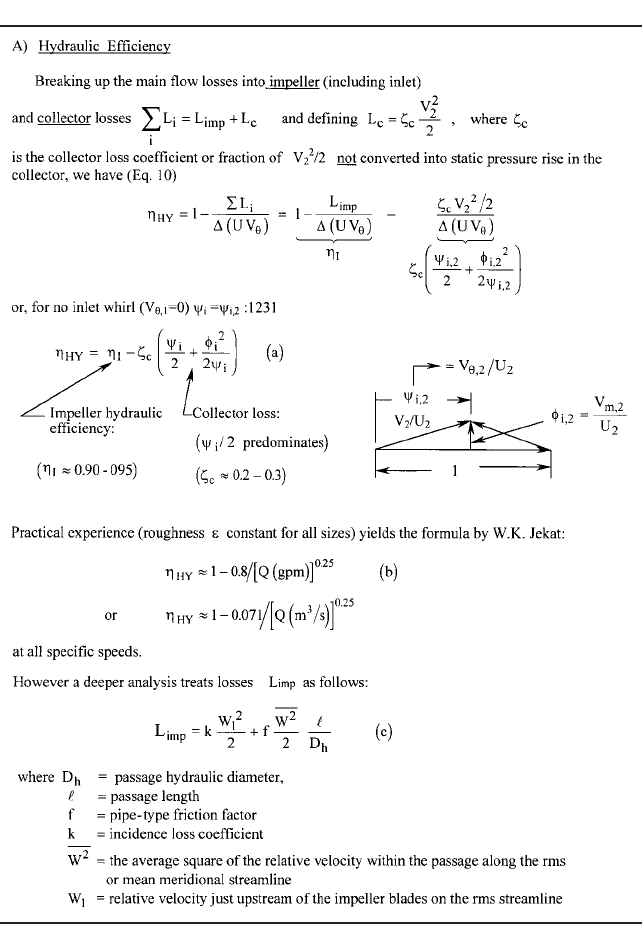
TABLE 3 Component efficiency expressions developed
2.48 CHAPTER 2
Quasi three-dimensional (Q3D) analysis
41
affords an assessment of the secondary flow
and diffusion losses and gives results similar to inviscid three-dimensional (3D) flow
analysis. Q3D analysis starts by solving the 2D meridional (hub-to-shroud) flow field
—
as
in Figure 14, but with blades present. This is followed by a series of 2D blade-to-blade
2.1 CENTRIFUGAL PUMP THEORY 2.49
TABLE 3 Continued.
inviscid solutions
42
, each on a surface of revolution generated by one of the meridional
streamlines of the hub-to-shroud 2D solution and producing results like that of Figure 17.
From this, one computes the diffusion factors (Eqs. 57
—
59) and decides whether the diffu-
sion losses are significant
—
in which case a redesign is in order, followed by a further Q3D
evaluation. This type of iterative design approach for impeller blading has led some
designers to combine Q3D analysis with an “inverse” design approach and a performance
prediction scheme as discussed in this subsection. Here, in distinction to the more common
“direct” choice of the conformal blade shape (Figure 19) between inlet and outlet as

2.50 CHAPTER 2
described in paragraph (e) (vi) under “Designing the Impeller,” one specifies the distribu-
tion of fluid dynamical quantities from inlet to outlet
—
such as UV
u
or W
—
and finally pro-
duces the corresponding blading
17,43
. In this sense, specifying W
g
as described in the same
paragraph (e) (vi) is an inverse design procedure.
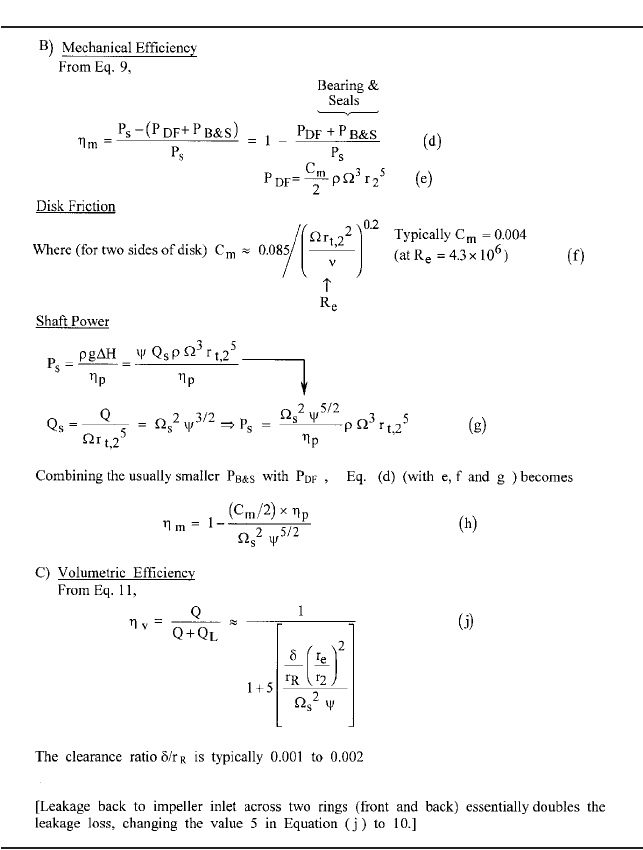
Mechanical efficiency h
m
, as stated earlier, is largely the result of impeller disk friction.
If the drag of bearings and seals is added, as in Eq. (d) of Table 3, the moment coefficient
C
m
in the disk friction formula (e) can be increased over known disk friction values
44,45
to
include these effects. (On the other hand, the drag power loss of shaft seals, though usually
quite small, is generally directly proportional to speed. Such losses can therefore be sig-
nificant in small pumps running at lower-than-normal speeds.) The C
m
-expression given in
Formula (f) reflects this adjustment and includes the drag on both sides of a smooth
impeller for a typical clearance ratio s/a 0.05, where a is the disc radius.This works well
for most impellers: The drag at the ring fits roughly compensates for the fact that the
impeller eye has been cut out of the disk, and so on. (There is very little influence on C
m
of
the gap width s between impeller shroud and casing wall, C
m
being proportional to (s/a)
0.1
in general
44
. For very small s/a, C
m
instead grows as s/a decreases; see Refs. 44 and 45 for
formulas.)
The value of C
m
can be even larger for semi- or fully-open impellers, if the neighboring
fluid is rotating faster relative to the wall
—
as is the case with radial-bladed open impellers.
The fluid between a shrouded impeller and adjacent wall, on the other hand, rotates at half
speed
44
. (In cases where the impeller surface and adjacent wall are both rough, C
m
is larger
than just discussed
45
.) Finally, notice in Eq. (h) that very low specific speed
s
produces a
dramatically low value of h
m
. This drives c to the larger values of Figure 12 at low
s
—
also
dictated by the W-deceleration considerations per Figure 22. Overall there is a benefit,
despite possibly lower h
HY
[Eq. (a)] due to the consequently greater c
i
and collector loss.
Volumetric efficiency h
v
applies to leakage across impeller shroud rings or “neck rings”
and balancing drums. Eq. (j) in Table 3 is an approximation for the leakage across a typi-
cal ring of a closed-impeller pump, assuming orifice-type flow at a discharge coefficient of
, as reported by Stepanoff
4
. Referring to Figure 2, leakage Q
L
occurs at r r
R
,(r
R
being
approximately 1.2 times r
e
) under a pressure difference across the ring of about that of
the pump stage. If the shroud is removed and the open blades are fitted closely to the adja-
cent wall, as with open impellers, the consequent leakage from one impeller passage to the
next across the blade tips does not affect h
v
, and Eq. (j) should be modified accordingly.
Rather, the tip leakage causes a hydraulic efficiency loss as previously discussed. Finally,
as with h
m
, Eq. (j) indicates that low-
s
pumps have low h
v
.
At flow rates Q other than Q
BEP
, the analytical methods described previously for com-
puting the hydraulic efficiency are utilized, together with computation of the inlet and
outlet velocity diagrams, which yield the ideal head and power curves as illustrated in
Figure 6. In this procedure, the slip velocity V
s
(Figure 15) applies to the BEP and, at other
flow rates, the exit relative flow angle b
f,2
can be assumed constant. This accords with the
fact that V
s
for the narrower active jet at low flow rates must be smaller. A blockage model
for the thickening wakes and narrower active jets that develop as Q is decreased can be
introduced to compute the one-dimensional velocity diagrams, but ignoring this at non-
recirculating flow rates appears not to be serious in determining the shapes of the head
and power curves.
b) Shut-off and low flow. The foregoing analyses apply over that portion of the flow rate
range that does not involve recirculation, as illustrated in Figure 6. The complexity of
recirculation has not been readily handled analytically, and this has forced pump design-
ers to estimate the low-flow end of the H-Q curve with the help of empirical correlations.
Nevertheless, insightful fluid dynamical reasoning about the physics of the flow have led
to useful expressions for the head developed and the power consumed at shut-off. Shut-
off, then, in addition to the BEP, becomes the other anchor point of the head and power
curves; and this
—
together with the shapes established for these curves at the higher flow
rates
—
gives the analyst an idea of the intervening shapes.
Shut-off head H
s/o
can be viewed as the sum of two effects occurring at Q = 0, each being
represented by a term in this equation:
2
3
1
2
2.1 CENTRIFUGAL PUMP THEORY 2.51
(65)
or
(66)
where the first term is the centrifugal effect of essentially solid body rotation of the fluid
confined within the impeller; and the second term is the pitot effect of the recirculating
fluid from the impeller that impinges against the volute or diffuser throats which in turn
are connected through stagnant fluid to the exit port of the pump. While the factors k
imp
and k
ex
associated with these effects vary with the hydraulic configuration, the values
involved can be estimated as follows: k
imp
≈ 1, as the radial equation of motion
3
would indi-
cate for fluid rotating at r everywhere within the blades, i.e., for r
h,1
6 r 6 r
t,2
(Fig. 8).
Thus, as indicated by Eqs. 65 and 66, increasing the minimum radius of the blades at inlet
r
h,1
tends to reduce the shut-off head. However, the presence or absence of fluid swirl in the
region upstream of the impeller blades at shut-off has been found experimentally to affect
the value of k
imp
in surprising ways—sometimes increasing it above unity in such a way as
to minimize the effect on shut-off head of any non-zero value of r
h,1
. The value of k
ex
depends on (r
3
r
2
)/r
2
, or “Gap B” and other features of the impeller exit and collector
geometry. It is usually in the range 0.2 0.1, any change in the geometry that increases
the shut-off power coefficient (see below) raising k
ex
by driving more recirculating flow
from the impeller against the volute or diffuser throats.Thus the shut-off head coefficient
c
s/o
(Eq. 66) for typical radial-flow pumps generally exceeds , the value of 0.585 being
advanced by Stepanoff
4
. Estimates for c
s/o
are also indicated in Fig. 22b.
Shut-off power consumption P
s/o
includes disk, bearing, and seal drag power P
D
and
that which drives the recirculation P
recirc
. The latter is generally dominant by far. From
similarity arguments (Eq. 33), the shut-off power coefficient
(67)
is a constant for a given pump geometry. Mockridge, in a discussion attached to an ASME
paper by Stepanoff, reasoned that a wider impeller (larger b
2
at the same diameter D
2
)
would recirculate more fluid at shut-off and therefore have a higher value of this coeffi-
cient. His correlation is shown in Figure 23 and is probably the most significant quanti-
tative result available for predicting the performance of centrifugal pumps at shut-off
conditions
36
.
c) Complete prediction via CFD. The uncertainties that have characterized the predic-
tion of pump performance are now being overcome through advances in computational
fluid dynamics. CFD entails three-dimensional solution of the flow fields within pumps
via the Reynolds-averaged Navier-Stokes equations. Graf demonstrated the ability of a
CFD computer code to calculate recirculation, the consequent prediction of the head curve
for the impeller comparing favorably with experimental data
46
. The resulting distorted
flows entering and leaving adjacent systems of impeller blades and stator vanes produce
time-varying boundary conditions on each, the associated computational grids also mov-
ing relative to each other. This involves extensive, time-dependent computation. To pro-
vide solutions quickly on conventional, storage- and speed-limited workstations, some
steady-flow codes treat these interfaces by circumferentially averaging the conditions at
each point of the blade and vane leading and trailing edges as they appear in the merid-
ional plane. Even with this simplification, pump analysts can now predict the entire per-
formance curve of head within about two percent and the power curve with slightly less
accuracy
47
.
P
ˆ
s>o
P
s>o
r
3
r
5
2
1
2
c
s>o
k
imp
a
r
2
t,2
r
2
2
r
2
h,1
r
2
2
b
2
k
ex
2
H
s>o
k
imp
1U
2
t,2
U
2
h,1
2
2g
k
ex
U
2
2
2g