Pump Handbook by Igor J. Karassik, Joseph P. Messina, Paul Cooper, Charles C. Heald - 3rd edition
Подождите немного. Документ загружается.

2.12 CHAPTER 2
(8)
where
(9)
(10)
(11)
Approximate formulas for the three component efficiencies of Eq. 8 will be given fur-
ther on. Their product yields the overall pump efficiency as defined in Eq. 5, and reflects
the following division of the pump losses:
a. External drags on the rotating element due to i) bearings, ii) seals, and iii) fluid fric-
tion on the outside surfaces of the impeller shrouds
—
called “disk friction”; the total
being P
D
P
S
P
I
. Generally, the major component of P
D
is the disk friction, and the
“mechanical efficiency” is that portion of the shaft power that is delivered to the fluid
flowing through the impeller passages.
b. Hydraulic losses in the main flow passages of the pump; namely, inlet branch,
impeller, diffuser or volute, return passages in multistage pumps, and outlet branch.
The energy loss per unit mass is ggH
L
g(H
i
H), the ratio of output head H to
the input head H
i
being the hydraulic efficiency. This is the major focus of the designer
for typical centrifugal pump geometries (which are associated with normal “specific
speeds”
—
to be defined later). The other two component efficiencies are then quite high
and of relatively little consequence.
c. External leakages totaling Q
L
leaking past the impeller and back into the inlet eye.
This leakage has received its share of the full amount of power P
I
rg H
i
(Q Q
L
)
delivered to all the fluid (Q Q
L
) passing through the impeller. This leakage power
is P
L
rg H
i
Q
L
, which is lost as this fluid leaks back to the impeller inlet. The
remaining fluid input power is thus (P
I
P
L
) rg H
i
Q, the ratio of this power to
the total (P
I
) being the volumetric efficiency.
There are exceptions to this convenient model for dividing up pump losses. The main
exception is that if the pump has an open impeller, that is, one without either or both
shrouds, that portion of the total leakage Q
L
disappears.The leakage now occurs across the
blade tips and affects the main flow passage hydraulic losses. The volumetric efficiency is
now higher, but the hydraulic efficiency is lower. In that case disk friction is still present,
as the impeller still has to drag fluid along the adjacent stationary wall(s).Another excep-
tion
—
for closed impellers
—
is that disk friction is fundamentally an inefficient pumping
action, the fluid being flung radially outward
2
; and this can result in a slight increase in
pump head if the fluid on the outside of an impeller shroud or disk is pumped into the
main flow downstream of the impeller.
VELOCITY DIAGRAMS AND HEAD GENERATION__________________________
The mechanism of the transfer of shaft torque (or power) to the fluid flowing within the
impeller is fundamentally dynamic; that is, it is connected with changes in fluid velocity.
This requires the introduction of Newton’s second law, which when combined with the first
Volumetric
Efficiency
fh
v
Q
Q Q
L
Hydraulic
Efficiency
fh
HY
¢H
¢H
i
¢H
i
gH
L
¢H
i
“Mechanical”
Efficiency
fh
m
P
I
P
S
P
S
P
D
P
S
h
P
I
P
S
¢H
¢H
i
Q
Q Q
L
h
m
h
HY
h
v
2.1 CENTRIFUGAL PUMP THEORY 2.13
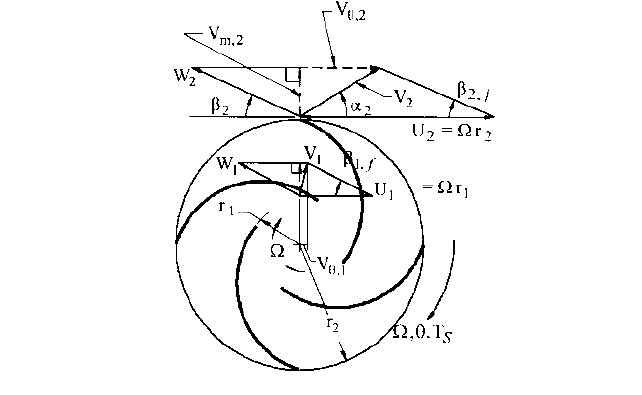
FIGURE 3 Impeller velocity diagrams (1 = inlet; 2 = outlet)
law of thermodynamics, yields Euler’s Pump Equation. Fluid velocities at inlet and exit of
the impeller are fundamental to this development. Fluid flowing along the blades of an
impeller rotating at angular velocity and viewed in the rotating reference frame of that
impeller has relative velocity W. Vectorially adding W to impeller blade speed U r
yields the absolute velocity V, as shown in the velocity diagrams of Figure 3.
Newton’s Second Law for Moments of Forces and Euler’s Pump Equation Relat-
ing impeller torque T to fluid angular momentum per unit mass rV
u
is the convenient way
of applying Newton’s second law to centrifugal pumps. This is stated as follows for the
control volume V that contains the pump impeller (Eq. 12):
(12)
where T T
S
T
D
is the summation of torques acting on the impeller; namely, the net
torque T
I
acting on the fluid flowing through it. The volume integral (first term on the
right side) of Eq. 12 is the unsteady term, which is zero for steady operation. It comes into
play during changing or transient conditions, such as start up and shutdown; that is, when
the angular momentum per unit volume rrV
u
is changing with time within the impeller
volume V.
The surface integral (second term on the right hand side) of Eq. 12 is the one that
pump designers and users are mainly concerned with. Its integration over the exterior
surface of the control volume V is effectively accomplished for most impellers by combin-
ing one-dimensional results from inlet to outlet on each of several stream surfaces
—
imag-
ined to be nested surfaces of revolution bounded by the hub and shroud stream surfaces
(indicated in Figure 2). Insight into the power of this term can be gained by taking the
mean value of the integrand in terms of the velocities on a representative stream surface;
that is, essentially the surface of revolution lying at an appropriate mean location
between hub and shroud. Each of the two velocity diagrams of Figure 3 lies in a plane tan-
gent to this mean stream surface. For flow through an impeller, the torque delivered to the
fluid is therefore given by the following relationship involving these average quantities:
(13)
or :
T
I
1m
#
m
#
L
2 1r
2
V
u, 2
r
1
V
u, 1
T µµµ
V
101rrV
u
2> 0t2>dV µµrrV
u
dQ
2.14 CHAPTER 2
(14)
Eq. 13 says that the torque is equal to the mass flow rate times the change of angular
momentum per unit mass (rV
u
). This becomes the “power” statement of Eq. 14 when both
sides are multiplied by . Following the statement of the second law of thermodynamics
in Eq. 4, we now can similarly say that gH must be less than the power input to the fluid
per unit of mass flow rate, namely (UV
u
) from Eq. 14. So, we now arrive at Euler’s Pump
Equation
—
expressed three different ways as follows:
(15a)
(15b)
or
(15c)
The inequality (Eq. 15a) is quantified by Eq. 15b, which follows in view of Eq. 7. Eq. 15c
then follows from the definition of hydraulic efficiency (Eq. 10). Euler’s Pump Equation
makes one of the most profound statements in the field of engineering, because it deter-
mines the major geometrical features of the design of a rotodynamic machine. By revers-
ing the inequality in Eq. 15a, the same principle applies to turbines; hence, the more
encompassing title, “Euler’s Pump and Turbine Equation.”
So, to design or analyze a pump, one needs to a) obtain the velocity diagrams that will
produce the ideal head at the design flow rate and b) determine how the shape of these
diagrams affects the hydraulic efficiency h
HY
, so as to obtain the desired pump stage head.
Step (a) for a given pump is a simple one-dimensional exercise that utilizes the principles
of continuity and kinematics (Eqs. 16 and 17) to construct the velocity diagrams for a given
total impeller volume flow rate Q and pump rotative speed ( or N):
Continuity:
(16)
where W V
m
/sin b
f
Kinematics: (17)
Step (b) is in essence the evaluation of the hydraulic losses gH
L
in Eq. 10, which
depend mainly on the relative and absolute velocities, the associated flow passage dimen-
sions, and incidence angles. Eq. 15c then gives the head that the pump stage will gener-
ate. Performing steps (a) and (b) at several other flow rates at the same speed enables one
to develop the pump performance characteristics.
STATIC PRESSURE GENERATION ______________________________________
The Extended Bernoulli Equation
To estimate the losses, it is convenient first to inves-
tigate the static pressure and velocity head portions of the total head. Eq. 15c can be writ-
ten in terms of the total pressure P, which equals rgH. Similarly, we may speak of
hydraulic losses as losses of static pressure gp
L
, which equals rggH
L
;so
(18)
where, from Eq. 3, the static, dynamic and potential energy components of the total pres-
sure are brought into evidence:
P P
in
r1UV
u
U
1
V
u, 1
2 p
L
V
u
U W cos b
f
Q 2prbV
m
g¢H h
HY
¢1UV
u
2
g¢H
i
¢1UV
u
2
g¢H 6¢1UV
u
2
P
I
1m
#
m
#
L
2 1U
2
V
u, 2
U
1
V
u, 1
2
(21)
Static Centrifugal Passage Losses:
Pressure Effect Diffusion Incidence
Change Friction
∞ Secondary Flow ∂1r¢u2
Tip Leakage
Mixing
p p
1
1
2
r1U
2
U
1
2
W
2
1
W
2
2 p
L, i
rg1Z
e Z
e,1
2
2.1 CENTRIFUGAL PUMP THEORY 2.15
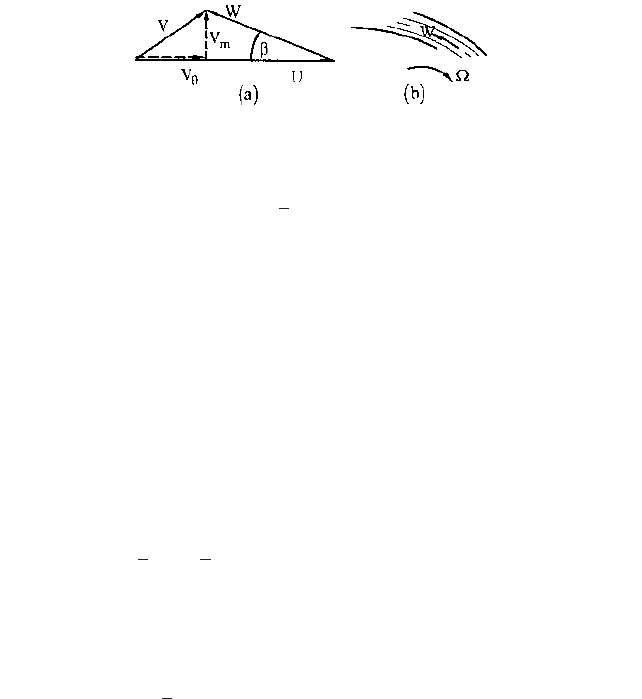
FIGURE 4 Velocity triangle and flow within impeller passageway
{
{
{
{
(19)
Eq. 18 is the turbomachine form of the “extended Bernoulli equation,” which states that
along a streamline the total pressure P
—
also known as the Bernoulli constant and defined
in Eq. 19
—
is a) decreased by losses and b) increased by energy addition that occurs along
the streamline.
Centrifugal and Diffusion Effects in Impellers Changes in potential energy across a
pump stage are small; so the static pressure rise is found essentially from subtracting
the dynamic (velocity) pressure change from the total pressure change. Within the
impeller, the static pressure in turn arises from a) centrifugal and b) passage diffusion
effects.
Fluid in the impeller passage of Figure 4b flows from low to high radius r or blade
speed U, often also experiencing a decrease in passage relative velocity W. The geometry
of the velocity diagram (Figure 4a) leads to the following combination of Eqs. 18 and 19
applied across the impeller:
(20)
and, because V
m
W
m
, this simplifies to the following form of the extended Bernoulli equa-
tion, which applies along a streamline from the inlet of the impeller:
¢ ap
1
2
rV
m
2
1
2
rV
u
2
b ¢ 3rU 1U Wcosb24 p
L, i
¢1rgZ
e
2
P p
1
2
rV
2
rgZ
e
rgH
Here, the U-increase corresponds to the centrifugal contribution to the static pressure rise,
and the W-decrease to the diffusion contribution. There is no U-change along an axial
streamline in an axial-flow impeller or propeller; so, static pressure rise is due only to dif-
fusion. Radial-flow impellers, on the other hand, often have little or no net W-change, the
centrifugal effect being paramount. [A study of the velocity diagrams of Figure 3 suggests
that such impellers possess a high “degree of reaction.” The degree of reaction is defined
as that fraction of the total energy addition within the impeller (Eq. 15b) that does not
include the change in absolute velocity energy, (V
2
/2). This fraction is, therefore, the sum
2.16 CHAPTER 2
of the static pressure energy change, that due to elevation change, and the energy losses
in the impeller, as can be seen from Eqs. 18 and 19.]
Collector Static Pressure Rise, Inlet Nozzle Drop A similar form of Eq. 21 applies in
the stationary flow elements, where W is also the absolute velocity V and blade speed U is
zero. (This would be a more recognizable form of the extended Bernoulli equation, wherein
only losses modify the Bernoulli constant.
3
) A further static pressure increase occurs in the
stationary collection system downstream of the impeller (with the attendant losses); namely,
in the stationary volute or diffuser. This static rise is generally about a third of that in the
impeller, and it is due only to diffusion, that is, the decrease in velocity in that passage. To
complete the picture, there is often an increase in the comparatively small velocity in the
approach passageway or nozzle or suction branch from the pump inlet port or flange to the
impeller eye or blade leading edge.This is accompanied by an attendant small pressure drop.
Internal Static Pressure Distribution If the fluid enters the pump from a stagnant
pool, the total pressure at the impeller eye P
1
will be very nearly the static pressure of the
upstream pool (plus the pressure equivalent of the elevation of the pool above the eye).
This is one reason why the local static pressure p within the pump is often referenced to
P
1
, as indicated in the following form of Eq. 21:
(22)
where
(23)
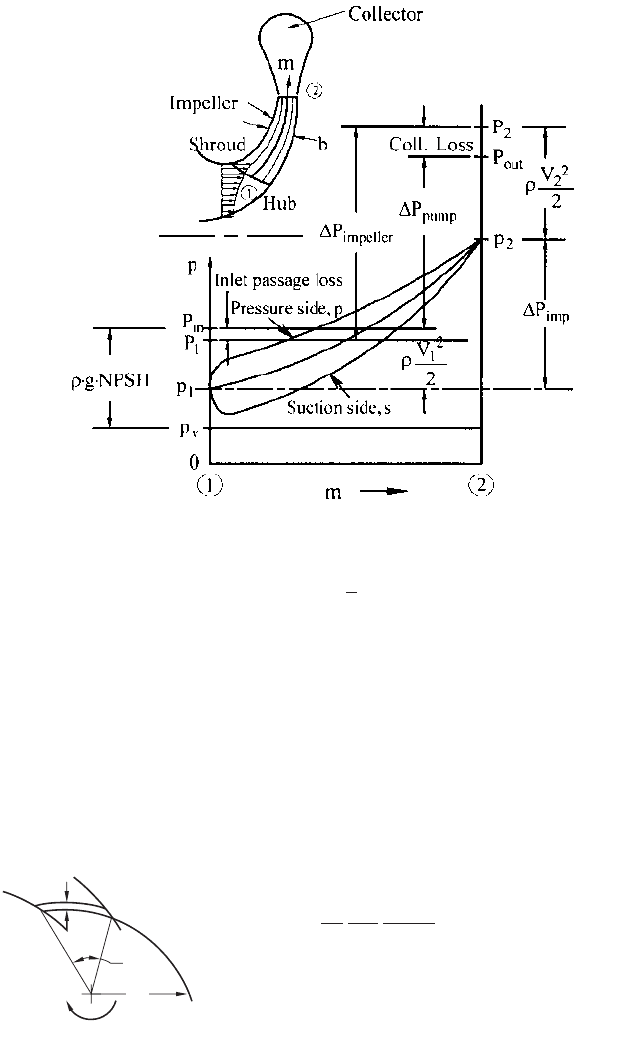
Figure 5 is an illustration of the internal static pressure development. The difference
between P
1
and p
1
is due to the impeller inlet absolute velocity head or dynamic pressure
rV
1
2
/2, a much larger difference existing at the impeller exit, namely rV
2
2
/2. Losses in the
collector result in the pump or stage outlet total pressure P
out
being less than P
2
, the rise
in total pressure P
pump
from port to port being P
out
P
in
. In the figure, P
in
is very nearly
the same as P
1
, the inlet passage loss being comparatively small for most pumps.
NET POSITIVE SUCTION HEAD_________________________________________
Local reduction of the static pressure p to the vapor pressure p
v
of the liquid causes vapor-
ization of the liquid and cavitation. Internal pressure drops are due to a) impeller inlet
velocity head and inlet passage loss and b) blade loading and loss within the impeller. In
order to prevent a substantial decrease of impeller pressure rise, the sum of these pressure
drops should not exceed the difference between P
in
and p
v
, the head equivalent of which is
called “net positive suction head” or NPSH:
(24)
Insufficient NPSH leads to cavitation and loss of pump pressure rise. That is because the
impeller can become filled with vapor, in which case the density r of the fluid within the
impeller is then reduced by orders of magnitude.This in turn, as can be seen in Eqs. 18–22,
results in essentially zero pump pressure rise; that is, total loss of pump performance.
Eq. 24 substituted into Eq. 22 yields the local static pressure above vapor pressure in
terms of the NPSH:
P
in
p
v
rg
NPSH 1 P
in
rgNPSH p
v
P
1
p
1
r
V
1
2
2
rgZ
e, 1
p P
1
1
2
r1U
2
W
2
2 p
L, i
rgZ
e
rU
1
V
u, 1
dm
p
Ω
∆
r
(26)
p
p
p
s
2p
n
b
rV
m
Æ
d1UV
u
2
dm
r1p
p
p
s
2bdm rV
m
br
#
¢u
#
d1rV
u
2
2.1 CENTRIFUGAL PUMP THEORY 2.17
FIGURE 5 Pump stage internal pressure development. Total pressure rise P = rgH.
(25)
This, together with the foregoing pressure drops, which occur in the inlet region of the
pump, is illustrated in Figure 5. The figure contains three plots of p along the representa-
tive streamline from 1 to 2, m being distance along this line in the meridional plane. These
plots are for the suction side or trailing face of an impeller blade, the pressure side or dri-
ving face, and the average or mid-passage position. The middle or average pressure plot is
readily described by Eq. 25 in terms of the local average W-distribution. The local blade-
to-blade static pressure difference p
p
p
s
arises from the torque exerted on a strip of fluid
between the blades and approximated here via blade-to-blade average velocity compo-
nents in Newton’s Second Law for Moments of Forces:
p
L, i I>L
rgZ
e
rU
1
V
u, 1
p p
v
rgNPSH
1
2
r1U
2
W
2
2
2.18 CHAPTER 2
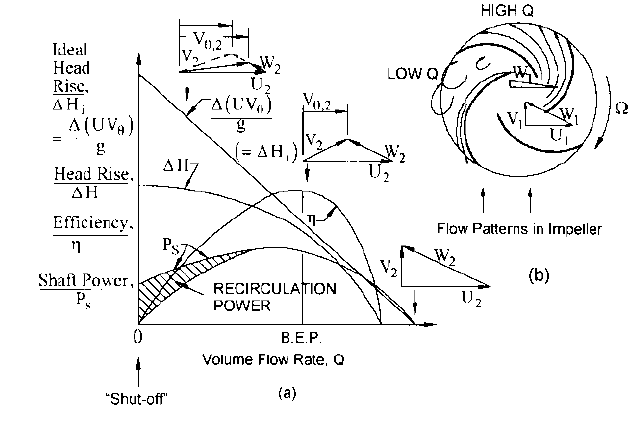
FIGURE 6A and B Characteristic performance curves of a pump stage, related to velocity diagrams
where, for ease of illustration, the blade-to-blade polar angle difference u is taken equal
to 2p/n
b
, the actual value of u being slightly less than this due to the thickness of the
blades.Thus, for example, too small a number of blades n
b
results in a larger value of p
p
p
s
and a lower minimum static pressure in the inlet region of the impeller.
The density reduction in a cavitating impeller is difficult to predict analytically;
therefore, empirical relationships for acceptable levels of NPSH have been developed and
will be presented further on, as guidelines for design and performance prediction are
developed.
PERFORMANCE CHARACTERISTIC CURVES _____________________________
Velocity diagrams and ideal head-rise vary with flow rate Q as illustrated in Figure 6 for the
typical case of constant rotative speed N or angular speed . Flow patterns in Figure 6b cor-
respond to points on the characteristic curves of Figure 6a.The inlet velocity diagrams (just
upstream of the impeller) are shown there for high and low flow rate
—
with zero swirl being
delivered by the inlet passageway to the impeller; that is, V
u,1
0. The outlet velocity dia-
grams on Figure 6a are found one-dimensionally, the magnitude of the exit relative veloc-
ity vector W
2
varying directly with Q and its direction being nearly tangent to the impeller
blade. From these diagrams are found the absolute velocity vector V
2
and its circumferen-
tial component V
u,2
. Because blade speed U
2
is constant, the resulting plot of the ideal head
H
i
U
2
V
u,2
/g (from Eq. 15b) is a straight line, rising to the point U
2
2
/g at zero-Q or “shut-
off head.” This is twice the impeller OD tip speed head U
2
2
/2g. The right-most velocity dia-
gram in Figure 6a has zero V
u,2
; however, the maximum or “runout” flow rate happens at
lower Q than this. That is because the actual head H is less than H
i
due to losses (as seen
in Eq. 10), and H 0 at runout
—
where overall pump efficiency (Eq. 8) is also zero.
This one-dimensional analysis works well in the vicinity of the best efficiency point
(b.e.p. or BEP) and at higher Q because the fluid flows smoothly through the impeller pas-

2.1 CENTRIFUGAL PUMP THEORY 2.19
sages as illustrated in Figure 6b for “high Q.” However, it fails at “low Q,” where recircu-
lating flow develops
—
indicated by a substantial one-dimensional deceleration or reduc-
tion in the fluid velocity relative to those passages
—
that is, W
2
V W
1
. This is analogous to
a diffuser with side walls that diverge too much: the main fluid stream separates from one
or both walls and flows along in a narrow portion of the passage in a jet
—
the rest of the
passage being occupied with eddying fluid that can recirculate out of the impeller inlet and
exit. Consequently, the real outlet velocity diagram at low Q is the one with the dashed
lines and the smaller value of V
u,2
, rather than the solid-lined, one-dimensional diagram
superimposed on it. This in turn reduces the ideal head at the low-Q point of the curves.
To complicate matters further at low Q, one-dimensional application of this “corrected”
outlet velocity diagram via Eq. 14 would produce a pump power consumption curve that
passes through the origin of Figure 6a. Such a result (assuming negligible external drag
power P
D
), is known not to occur in a real pump. Rather, superimposed on the jet flow pat-
tern just described is recirculating fluid that leaves the impeller, gives up its angular
momentum to its surroundings, and re-enters the impeller to be re-energized.
In other words, the one-dimensional simplifications mentioned after Eq. 12 do not hold
at low Q; rather, there is an added “recirculation power,” which is the UV
u
-change experi-
enced by the recirculating fluid integrated over each element of re-entering mass flow rate
4
.
The complexity of this recirculation destroys one’s ability to interpret pump performance
under such conditions by means of velocity diagrams. Instead, a transition is made from
empirical correlations for head and power at “shutoff” or zero net flow rate to the high-Q,
one-dimensional analysis, enabling one to arrive at the complete set of characteristic curves
for efficiency, power, and head illustrated in Figure 6a. In fact, impeller pressure-rise at
shutoff is very nearly what would be expected due to the centrifugal effect of the fluid rotat-
ing as a solid body, namely rU
2
2
/2.The recirculating flow patterns seem to be merely super-
imposed with little effect on impeller pressure-rise. This recirculation, on the other hand,
does produce some additional shutoff pressure rise in the collecting and diffusing passages
downstream of the impeller.
SCALING AND SIMILITUDE ____________________________________________
When a set of characteristic curves for a given pump stage is known, that machine can
be used as a model to satisfy similar conditions of service at higher speed and a differ-
ent size. Scaling a given geometry to a new size means multiplying every linear dimen-
sion of the model by the scale factor, including all clearances and surface roughness
elements. The performance of the model is then scaled to correspond to the scaled-up
model by requiring similar velocity diagrams (often called “velocity triangles”) and
assuming that the influences of fluid viscosity and vaporization are negligible. The pro-
portions associated with Eqs. 27, 29, and 32 illustrate this. The blade velocity U (Eq. 30)
varies directly with rotative speed N or angular speed
—
and directly with size, as
expressed by the radius r. For the velocity V (or W) to be in proportion to U, the flow rate
Q must therefore vary as r
3
; hence, the “specific flow” Q
s
must be constant (Eq. 28). Fur-
ther, as the head is the product of two velocities, it must vary as
2
r
2
; hence, the head
coefficient c must be constant (Eq. 31). Finally, as power is the product of pressure-rise
and flow rate, shaft power P
s
must vary as r
3
r
5
; hence, the power coefficient must be
constant.
(27)
and (28)
Q
r
2
3
Constant Q
s
1 Q ND
3
or r
2
3
Q AVe
A r
2
2
D
2
V r
2
ND
2.20 CHAPTER 2
At above Q,
(29)
(30)
and (31)
(32)
and (33)
Figure 7a is the result of following these similarity rules for a given pump that under-
goes a change in speed from full speed to half speed without a change in size. The similar
Q at half speed for a given Q at full speed is half that at full speed. At each such half-
speed Q-value, the head H is accordingly one-fourth of its full-speed value and the effi-
ciency h is unchanged. One can avoid replotting the characteristic curves in this manner
for every change in speed (and size) by expressing them nondimensionally in terms of Q
s
,
c, h, and
s
. They then all collapse on one another as illustrated in Figure 7b. Note that a
change in pump geometry or shape of the hydraulic passageways destroys this similitude
and necessarily produces a new set of curves
—
shaped differently but similar to each other.
Similitude enables the engineer to work from a single dimensionless set of perfor-
mance curves for a given pump model. This is a practical but special case of the more gen-
eral statement that pump performance as represented by efficiency, head, and power, is
more generally expressed in terms of the complete physical equation as follows:
(34)
where {/
i
} is the infinite set of lengths that defines the pump stage geometry. A common
group of these lengths is illustrated in Figure 8. Dimensionlessly, Eq. 34 becomes
(35)
where the dimensionless quantities containing flow rate, viscosity and NPSH are respec-
tively defined as follows:
where
(36)
and
• {G
i
} {/
i
/r} defines the dimensionless geometry or shape.
• {2-} the dimensionless quantities arising from the set of fluid, thermal, vaporization,
and heat transfer properties {2-ph} that influence the flow of two-phase vapor and liq-
uid. These quantities come into play when the NPSH is low enough for such flow to be
extensive enough to influence pump performance.
Specific
Flow
Machine
Reynolds
Number
Cavitation
Coefficient
Q
s
Q
r
2
3
R
e
r
2
2
y
t
2
2gNPSH
2
r
2
2
h, c, P
ˆ
S
fct's. 1Q
s
, R
e
, t
2
, 52-£6, 5
p
6, 5g6, 5G
i
62
h, ¢H, P
S
fct’s. 1Q, r
2
, , r, y, NPSH, 52-ph6, 5g
p
6, 5S6,5/
i
62
P
ˆ
P
ˆ
S
P
S
r
3
r
2
5
constant
1 P
S
rN
3
D
5
P
S
rQg¢H
h
c
g¢H
U
2
2
constant
U r
1¢H N
2
D
2
g¢H h
HY
¢1UV
u
2
h Constant, and
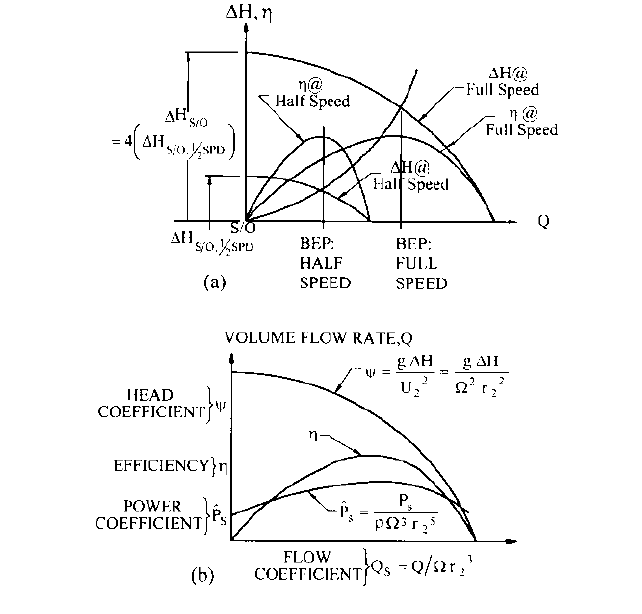
2.1 CENTRIFUGAL PUMP THEORY 2.21
FIGURE 7 Similar performance curves: a) dimensional; b) dimensionless
• {g} the dimensionless quantities arising from the set of properties associated with
entrained solids and emulsifying fluids that affect the performance of slurry pumps and
emulsion pumps.
SPECIFIC SPEED AND OPTIMUM GEOMETRY ____________________________
The hydraulic geometry or shape of a pump stage can in principle be chosen for given values
of the other independent variables in Eqs. 34 or 35 to optimize the resulting performance; for
example, to maximize the best efficiency h
BEP
under certain conditions on the head and power.
Two such conditions that are common are a) no positive slope is allowed anywhere along the
H-vs.-Q curve of Figure 7 (called the “no drooping nor dip” condition) and b) the maximum
power consumption must occur at the BEP (often called the “non-overloading” condition). A
fundamental and generally typical pumping situation involves a) negligible influence of vis-
cosity, (that is, high Reynolds number) b) the absence of two-phase fluid effects, (that is, the
existence of sufficient NPSH or t) and c) the absence of solid particles and emulsion-related
substances in the fluid. In this situation, Eq. 35 has one remaining significant independent
variable; namely, the specific flow Q
s
, which in the definitions of Eq. 36 contains the volume
flow rate Q, the pump speed , and the characteristic radius r
2
. Most users don’t know the