Power electronic handbook
Подождите немного. Документ загружается.

1058 S. M. Halpin and A. Card
−0.08
−0.06
−0.04
−0.02
0
0.02
0.04
0.06
0.08
4.03
4.05
4.07
4.09
4.11
4.13
4.15
4.17
4.19
4.21
4.23
4.25
4.27
4.29
Time (ms)
Voltage
FIGURE 38.7 Multiple zero crossings.
converter, a maximum time of 1/(6×60) seconds is available to
turn on a switching device. Similarly, for a 12-pulse converter,
a maximum of 1/(12×60) is available to turn on a switching
device. Considering that all switching devices have a short (but
non-zero) turn-on time, manufacturers tend to design drive
circuits that bring up the firing pulse for a limited amount of
time. If, for example, a firing pulse is maintained for 100 µs,
the device must begin conduction in that time. In situations
where voltage distortion is excessive, the device to be switched
could be reverse biased during the first several milliseconds of
the time available for device firing during which time conduc-
tion cannot begin. If the firing signal is removed before the
certain classes of switching devices are correctly biased, con-
duction will not begin at all. This situation, commonly called
a “misfire,” can lead to equipment mis-operation and failure.
Because some switching devices can conduct in both direc-
tions when the firing signal is applied (but only one direction
is intended to carry appreciable current), applying the firing
pulse at a time when the voltage is of the wrong polarity can
destroy the device. Excessive voltage distortion can certainly
lead to such a situation, and manufacturers typically design
products to function only under limited-distortion conditions.
Because of the numerous potential problems with harmonic
currents, standards exist for their control. The IEC goes as
far as to limit the harmonic currents produced by certain
individual pieces of equipment, while the IEEE takes more
“system-level” point of view and prescribes limits for harmonic
currents for a facility as a whole, including one of more har-
monic producing loads. Harmonic standards will be further
discussed in Section 38.4.
38.2.5 Voltage Fluctuations and Flicker
Voltage flicker is not directly caused by electronic loads except
in the largest of applications. Voltage fluctuations, and the
corresponding light flicker due to them, are usually created by
large power fluctuations at frequencies less than about 30 Hz.
In most applications, only
1. Large dc arc furnaces and welders,
2. Reactive power compensators, and
3. Cycloconverters
are potentially problematic. Each of these types of end-use
devices can create large, low-frequency (about 30 Hz or less)
variations in the system voltage, and can therefore lead to
voltage flicker complaints. At this time, the IEEE prescribes
a “flicker curve” based originally on research conduction by
General Electric. The IEC, however, has adopted a different
methodology that can consider voltage fluctuations and flicker
that are more complex than those considered by the IEEE
flicker curve.
Most equipment is not sensitive to the voltage fluctua-
tions that cause flicker complaints. The change in output of
incandescent lamps as viewed by human observers becomes
objectionable at levels of change around 0.3%, but electronic
equipment will not be affected at all. Because most utility
supply companies limit voltage fluctuations, regardless of the
frequency of repetition, to less than a few percent, equipment
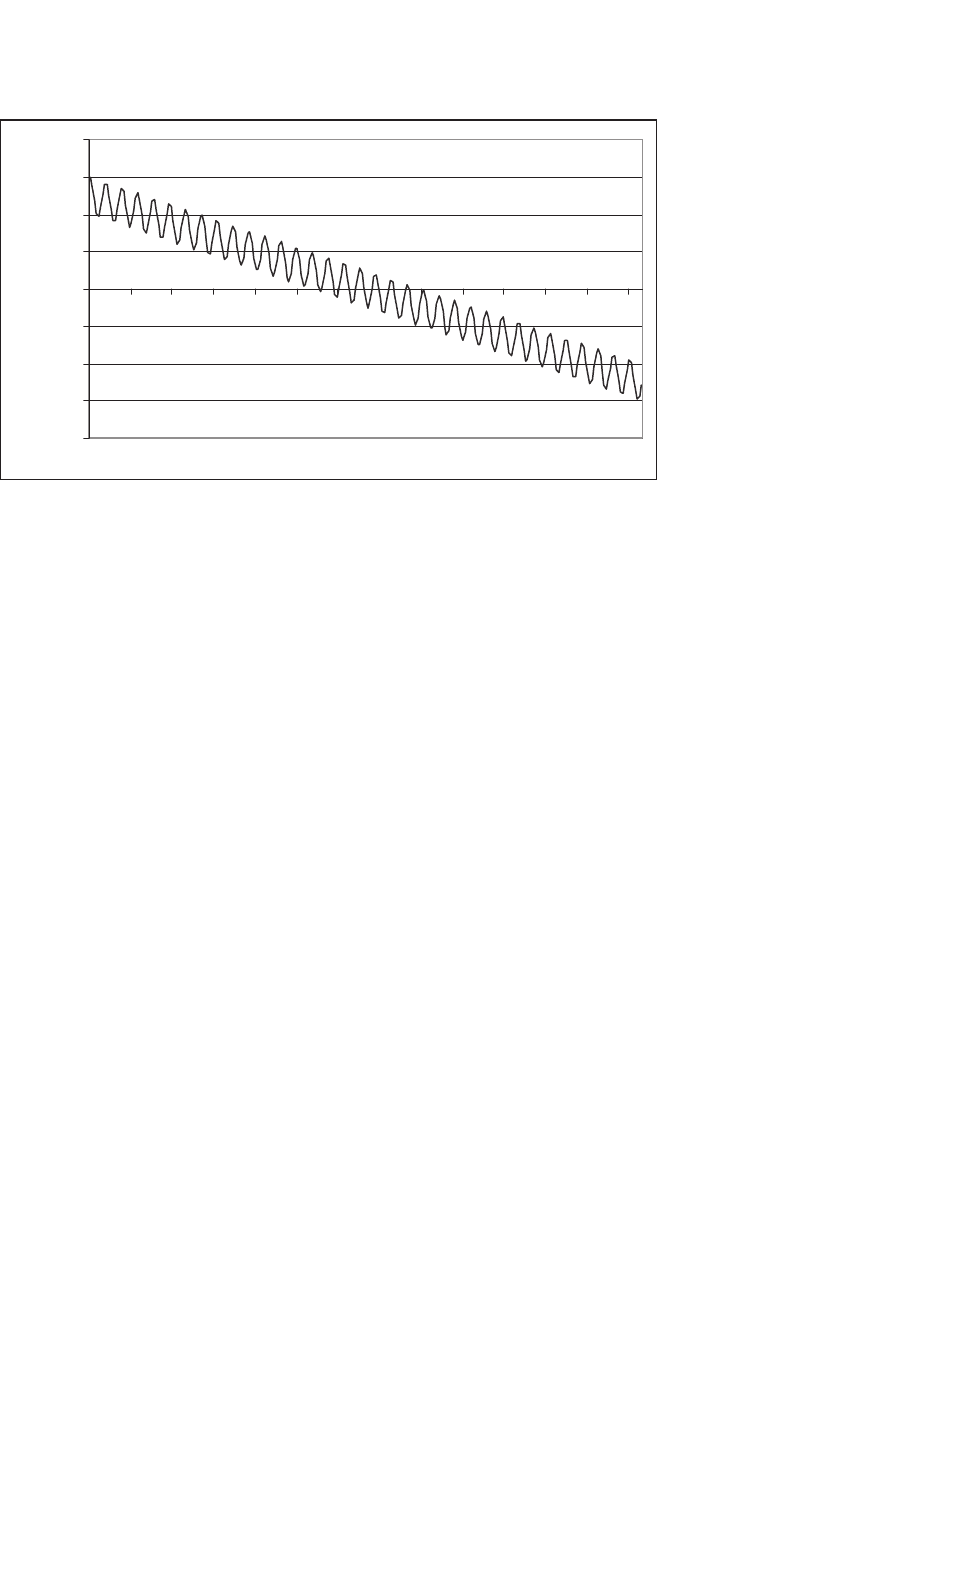
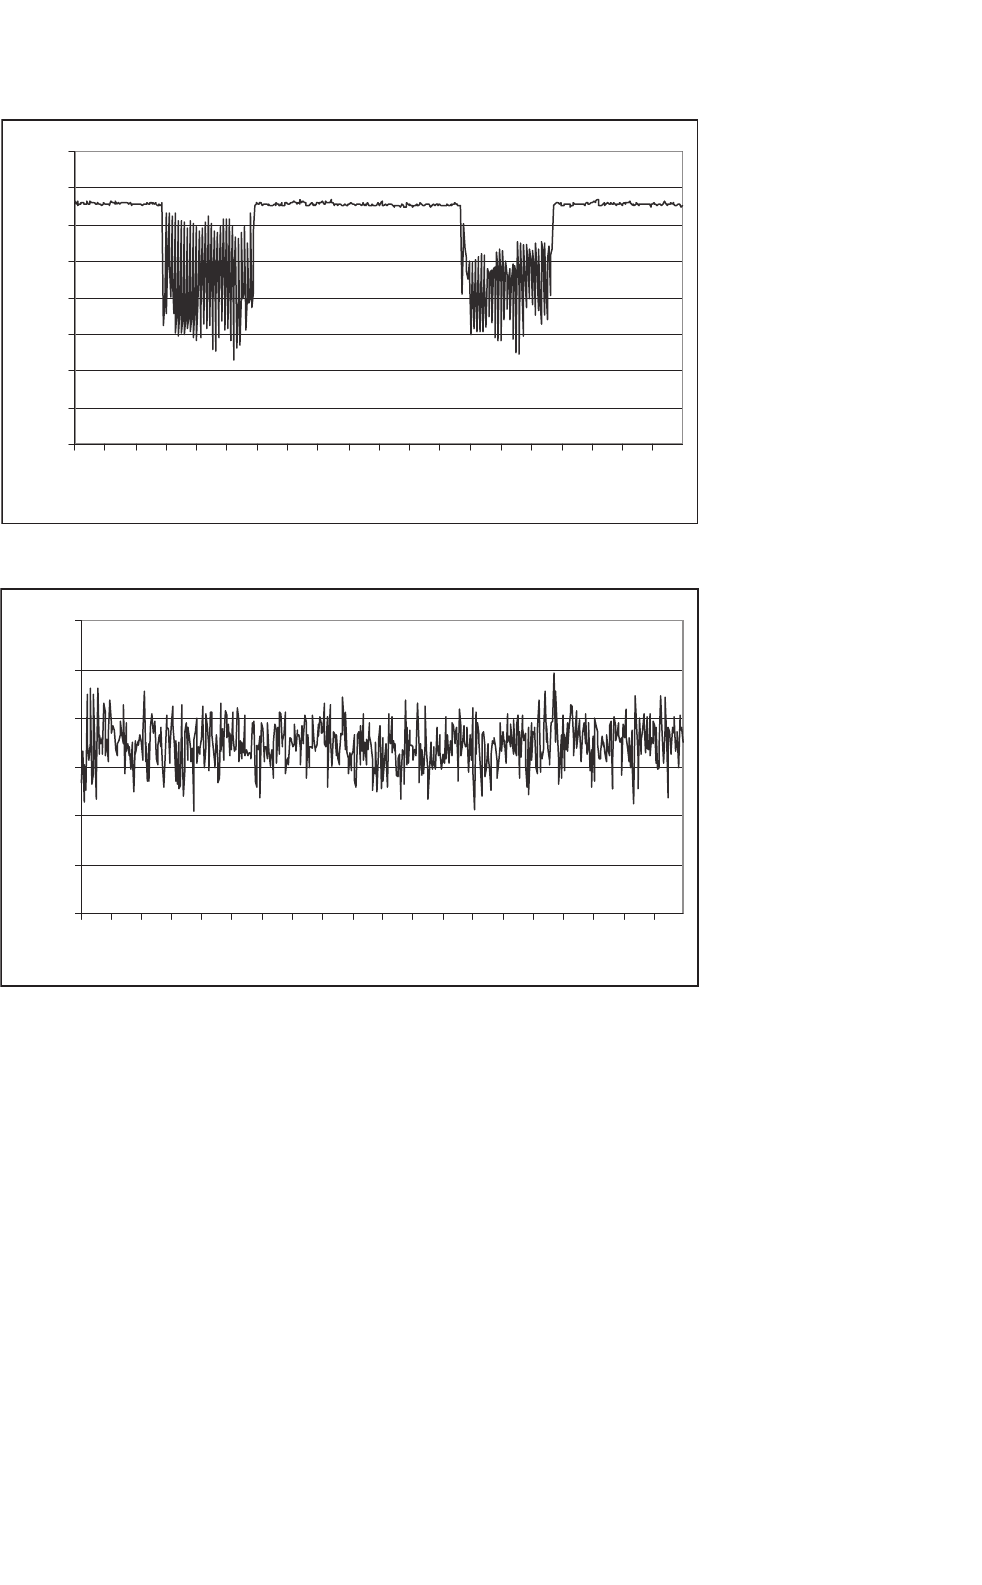
malfunction or damage due to flicker is very rare. Figures 38.8
and 38.9 show plots of single-cycle rms voltage fluctuations
due to large dc welders and arc furnaces, respectively; it is
clear that the magnitude of the fluctuations are well above the
level that could impact equipment. The waveform in Fig. 38.8
probably would generate numerous light-flicker complaints,
whereas the waveform in Fig. 38.9 probably would not. Neither
would disrupt equipment.
Due to the advances in power electronics that have offered
devices with higher power ratings, reactive compensation
systems have been developed to compensate for voltage
fluctuations by adding or removing reactive power from
38 Power Quality 1059
98
99
100
101
102
103
104
105
106
0
0.5
1
1.5
2
2.5
3
3.5
4
4.5
5
5.5
6
6.5
7
7.5
8
8.5
9
9.5
Time (s)
Voltage (%)
FIGURE 38.8 Single-cycle rms voltage fluctuations due to a large dc welder.
95.5
96
96.5
97
97.5
98
98.5
0
0.5
1
1.5
2
2.5
3
3.5
4
4.5
5
5.5
6
6.5
7
7.5
8
8.5
9
9.5
Time (s)
Voltage (%)
FIGURE 38.9 Single-cycle rms voltage fluctuations due to a large dc arc furnace.
the supply circuit. These devices have allowed large flicker-
producing loads like arc furnaces to be served from utility
circuits that, without the compensator, could not serve the
load. However, because the compensators can so directly
impact system voltage, they can create flicker problems if they
are not properly applied and controlled.
38.2.6 Transients
Transients, especially in the voltage supply, can create numer-
ous power quality problems. The major sources of transients
are
1. Lightning,
2. Utility circuit switching and fault clearing,
3. Capacitor switching, and
4. Load switching.
Lightning events can create the most severe overvoltages, but
these transients decay rapidly. A typical lightning transient
has decayed to zero in a few hundred microseconds, but it
can reach a peak magnitude of several hundred percent if not
controlled with surge suppression devices. Other categories of
transients associated with power system switching are much
smaller in magnitude (typically less than 200%), but last in
the order of several hundred milliseconds. Considering the
energy available in a transient, therefore, there is a consider-
able overlap in the range of severity of lightning and switching
transients. It is the available energy that typically determines
1060 S. M. Halpin and A. Card
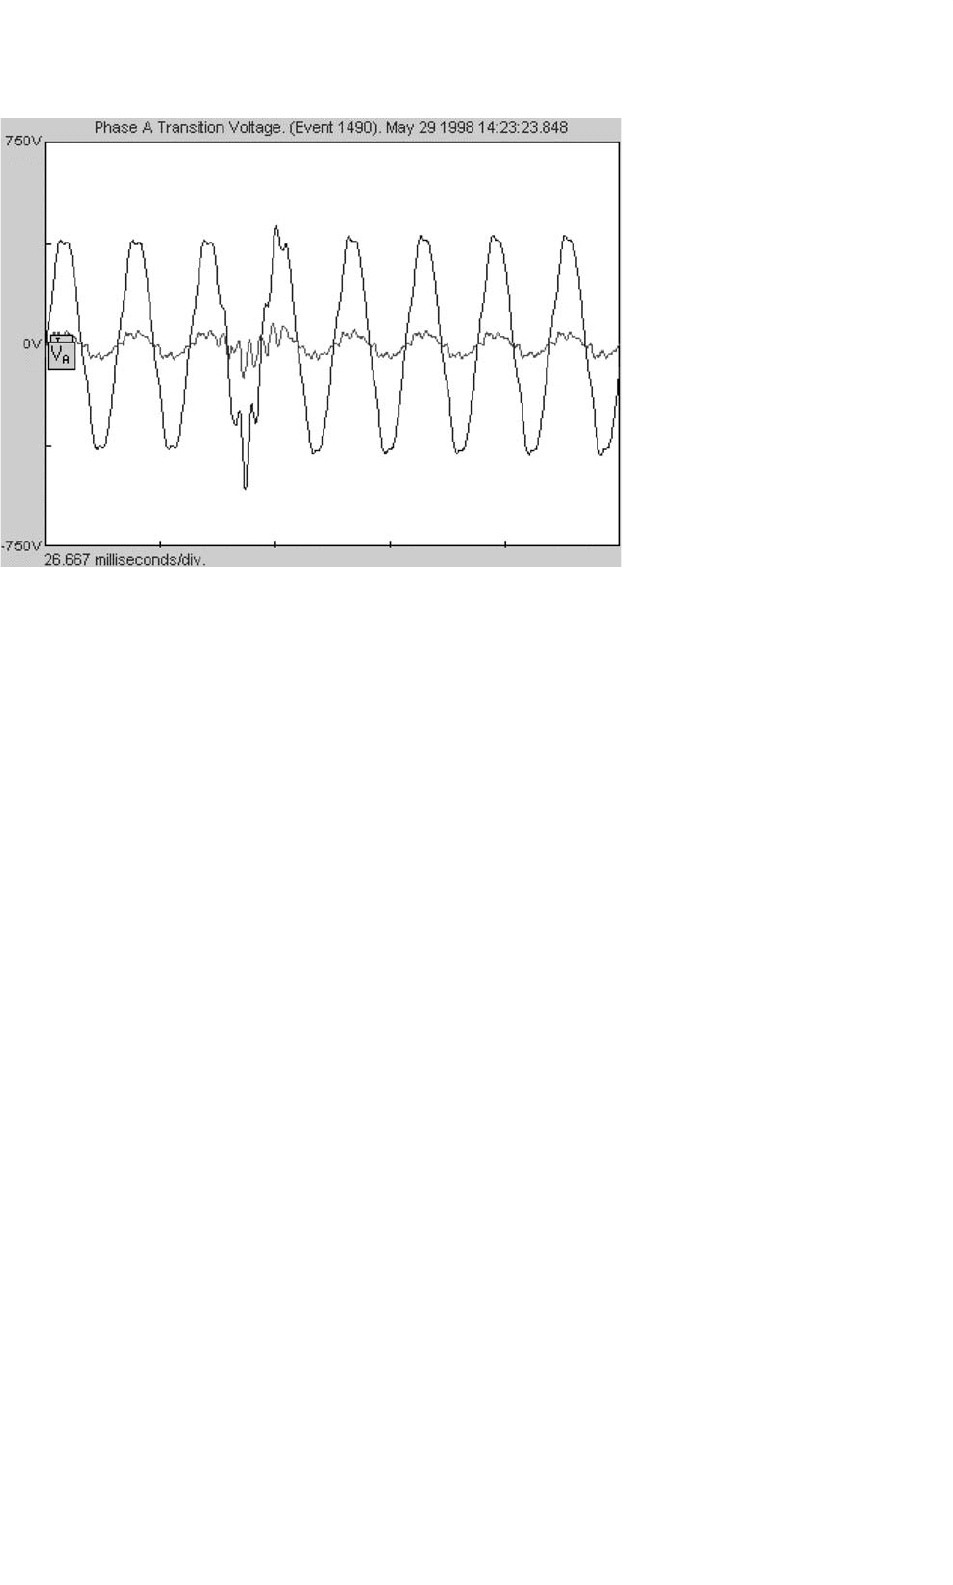
FIGURE 38.10 Capacitor switching transient.
whether or not an equipment will be affected or damaged.
Figure 38.10 shows a capacitor switching transient on a low-
voltage (480 V) circuit. The magnitude and duration of the
event are quite clear.
Transients such as those shown in Fig. 38.10 are gener-
ally sufficient to cause nuisance trips of electronic loads like
adjustable speed drives. For these types of loads, the protec-
tion system settings are usually very tight due to the use of
sensitive switching devices. Overcurrent and overvoltage set-
tings of 120% are not uncommon. For a transient similar to
that shown in Fig. 38.10, there is sufficient overvoltage for very
large currents to flow through any conducting switching device
to the drive’s dc bus. The device’s protection system see these
overcurrents as a fault, and trip the drive. Similarly, the over-
voltage at the terminals can be passed through to the dc bus
and accumulate, where the drive may trip due to overvoltge
on the dc bus.
38.2.7 Monitoring and Measurement
To consider or be able to diagnose power quality related prob-
lems, it is imperative to be able to measure various power
quality parameters. Several different categories of monitoring
and measurement equipment exist for these purposes, with
costs ranging from a few hundred dollars to $10,000–20,000
for fully equipped disturbance analyzer.
The most basic category of power quality measurement tool
is the handheld voltmeter. It is important that the voltmeter
be a true-rms meter, or erroneous readings will be obtained
that incorrectly suggest low or high voltage when harmonics
are present in the signal. It is especially important to have
true rms capability when measuring currents; voltage distor-
tion is not typically severe enough to create large errors in the
readings of non-true rms meters. Virtually all major measure-
ment equipment vendors offer true rms meters, with the costs
starting around $100.
The next step up from the basic voltmeter is a class of instru-
ments that have come to be called “power quality analyzers.”
These instruments are handheld and battery powered. These
instruments can measure and display various power quality
indices, especially those that relate to harmonics like THD,
etc. and can also display the input waveform. Newer models
feature 20 MHz (and higher) bandwidth oscilloscopes, inrush
measurements, time trending, and other useful features. Man-
ufacturers such as Fluke, Dranetz, BMI, and Tektronix offer
these types of instruments for around $2000.
In most power quality investigations, it is not possible to
use handheld equipment to collect sufficient data to solve
the problem. Most power quality problems are intermittent
in nature, so some type of long-term monitoring is usually
required. Various recorders are available that can measure
and record voltage, current, and power over user-defined
time period. Such recorders typically cost in the order of
$3000–10,000. More advanced long-term monitors can record
numerous power quality events and indices, including tran-
sients, harmonics, sags, flicker, etc. These devices, often called
“line disturbance analyzers”, typically cost between $10,000
and $20,000.
It is important to use the right instrument to measure the
phenomenon that is suspected of causing the problem. Some
meters record specific parameters, while others are more flexi-
ble. With this flexibility comes an increased learning curve for

38 Power Quality 1061
the user, so it is important to spend time on them before going
out to monitor, to make sure all aspects and features of the
equipment are understood.
It is equally important to measure in the correct loca-
tion. The best place to measure power quality events is at
the equipment terminals that is experiencing problems. With
experience, an engineer can evaluate the waveforms recorded
at the equipment terminals and correlate them to events and
causes elsewhere in the power system. In general, the farther
away from the equipment location the monitoring takes place,
the more difficult is to diagnose a problem.
38.3 Reactive Power and Harmonic
Compensation
The previous section specifically identified harmonics as a
potential power quality problem. In that discussion, it was
pointed out that non-linear loads such as adjustable speed
drives create harmonic currents, and when these currents flow
through the impedances of the power supply system, har-
monic voltages are produced. While harmonic currents have
secondary (in most cases) negative impacts, it is these har-
monic voltages that can be supplied to other load equipment
(and disrupt operation) that are of primary concern. Having
parallel or series resonant conditions present in the electrical
supply system can quickly exacerbate the problem.
38.3.1 Typical Harmonics Produced
by Equipment
In theory, most harmonic currents follow the “1/n” rule where
n is the harmonic order (180 Hz = 3×60; n = 3). Also in the-
ory, most harmonic currents in three-phase systems are not
integer multiples of three. Finally, in theory, harmonic currents
are not usually even-order integer multiples of the fundamen-
tal. In practice, none of these statements are completely true
and using any of them “exactly” could lead to either over- or
under-conservatism depending on many factors. Consider the
following examples:
1. Switched-mode power supplies, such as found in tele-
visions, personal computers, etc. often produce a third-
harmonic current that is nearly as large (80–90%) as
the fundamental frequency component.
2. Unbalance in voltages supplied to a three-phase con-
verter load will lead to the production of even-order
harmonics and, in some extreme cases, establish a pos-
itive feedback situation leading to stability problems.
3. Arcing loads, particularly in the steel industry, gen-
erate significant harmonics of all orders, including
harmonics that are not integer multiples of the power
frequency.
TABLE 38.2 Typical harmonic spectra of load equipment
Harmonic Switched-mode Fluorescent Six-pulse dc Six-pulse ac
no. power supply lamp drive drive
1 100.0 100.0 100.0 100.0
2 0.7 1.0 4.8 1.1
3 91.9 12.6 1.2 3.9
4 1.0 0.3 1.5 0.5
5 80.2 1.8 33.6 82.8
6 1.3 0.1 0.0 1.7
7 64.8 0.7 1.6 77.5
8 1.4 0.1 1.7 1.2
9 47.7 0.5 0.4 7.6
10 1.0 0.1 0.3 0.7
11 30.8 0.2 8.7 46.3
12 0.8 0.1 0.0 1.0
13 16.0 0.2 1.2 41.2
14 0.4 0.0 1.3 0.2
15 5.0 0.1 0.3 5.7
16 0.1 0.1 0.2 0.3
17 4.0 0.2 4.5 14.2
18 0.3 0.1 0.0 0.4
19 7.2 0.1 1.3 9.7
20 0.4 0.2 1.1 0.4
21 7.7 0.2 0.3 2.3
22 0.4 0.1 0.3 0.5
23 6.2 0.1 2.8 1.5
24 0.2 0.0 0.0 0.5
25 4.0 0.1 1.2 2.5
4. Cycloconverters produce dominant harmonics that are
integer multiples of the power frequency, but they
also produce sideband components at frequencies that
are not integer multiples of the power frequency. In
some control schemes, the amplitudes of the sideband
components can reach damaging levels.
Table 38.2 gives the magnitudes, in percent of fundamen-
tal, of the first 25 (integer) harmonics for a single-phase
switched-mode power supply, a single-phase fluorescent lamp,
a three-phase (six-pulse) dc drive, and a three-phase (six-pulse,
no input choke) ac drive. Together, these load types repre-
sent the range of harmonic sources in power systems. Note
that seemingly minor changes in parameter values and control
methods can have significant impacts on harmonic current
generation; the values given here are on the conservative side
of “typical.”
38.3.2 Resonance
Considering only the harmonic current spectra given in
Table 38.2, it would appear that a large number of harmonic-
related power quality problems are on the verge of appearing.
In reality, most current drawn by many residential, commer-
cial, and industrial customers is of the fundamental frequency;
1062 S. M. Halpin and A. Card
the amplitudes of the individual harmonic currents, in percent
of the total fundamental current, are often much less than
that shown in Table 38.2. For this reason, end-use locations
employing non-linear loads often do not lead directly to signif-
icant voltage distortion problems. A parallel resonance in the
power supply system, however, changes the picture entirely.
Series and parallel resonance exist in any ac power supply
network that contains inductance(s) and capacitance(s). The
following simple (but usable) definitions apply:
1. Series resonance occurs when the impedance to current
flow at a certain frequency (or frequencies) is low.
2. Parallel resonance occurs when the impedance to cur-
rent flow at a certain frequency (or frequencies) is
high.
For a given harmonic-producing load that generates harmon-
ics at frequencies that correspond to parallel resonance in the
supply system, even small currents at the resonant frequencies
can produce excessive voltages at these same frequencies. The
principle of series resonance, however, is usually exploited to
reduce harmonics in power systems by providing intentionally
low impedance paths to ground.
In many cases, end-users will install power factor correction
capacitors in order to minimize reactive power charges by the
supply utility. In most cases, these capacitors are located on
the customer’s low-voltage supply buses and are therefore in
parallel with the service transformer. In most cases where the
power factor correction capacitors are sized to provide a net
power factor (at the service entrance) to 0.85(lag)–1.0, the
parallel resonance occurs somewhere between the fifth and
nineth harmonic. Considering Table 38.2, it is apparent that a
large number of loads produce harmonics at these frequencies,
and the amplitudes can be significant. Even a small increase
in impedance at these frequencies due to resonance can lead
Driving Point Impedance
0
0.5
1
1.5
2
60
180
300
420
540
660
780
900
1020
1140
1260
1380
1500
1620
1740
1860
1980
2100
2220
2340
2460
2580
2700
2820
2940
Frequency (Hz)
Impedance Magnitude
FIGURE 38.11 Driving point impedance.
to unacceptable voltages being produced at these same fre-
quencies. Figure 38.11 shows and example plot of impedance
looking into a utility supply system when a typically-sized
capacitor bank has been installed to improve overall plant
power factor.
From Fig. 38.11, it is clear that 1.0 A at the 9th harmonic
will produce at least 150 times more voltage drop than would
be produced by the same 1.0 A if it were at the fundamen-
tal frequency. A look back at the Table 38.2 shows the clear
potential for problems. Fortunately, the series resonance prin-
ciple can be used to provide a low-impedance path to ground
for the harmonic currents and thus reduce the potential for
problematic voltage distortion.
Since capacitors are required to produce parallel resonance,
it is often a “cheap fix” to slightly modify the capacitor to
include a properly sized series reactor and create filter. This fil-
ter approach, designed based on the series resonance concept,
is usually the most cost-effective means to control harmonic
voltage distortion.
38.3.3 Harmonic Filters
Harmonic filters come in many “shapes and sizes.” In general,
harmonic filters are “shunt” filters because they are connected
in parallel with the power system and provide low impedance
paths to ground for currents at one or more harmonic frequen-
cies. For power applications, shunt filters are almost always
more economical than series filters (like those found in many
communications applications) for the following reasons:
1. Series components must be rated for the full cur-
rent, including the power frequency component. Such
a requirement leads to larger component sizes and
therefore costs.
38 Power Quality 1063
2. Shunt filter components generally must be rated for
only part of the system voltage (usually with respect
to ground). Such requirements lead to smaller compo-
nent sizes and therefore costs.
Shunt filters are designed (or can be purchased) in three
basic categories as follows:
1. Single-tuned filters,
2. Multiple- (usually limited to double) tuned filters, and
3. Damped filters (of first-, second-, or third- order, or
newer “c-type”).
The single- and double-tuned filters are usually used to fil-
ter specific frequencies, while the damped filters are used to
filter a wide range of frequencies. In applications involving
small harmonic producing loads, it is often possible to use
one single-tuned filter (usually tuned near the fifth har-
monic) to eliminate problematic harmonic currents. In large
applications, like those associated with arc furnaces, multiple
tuned filters and a damped filter are often used. Equiva-
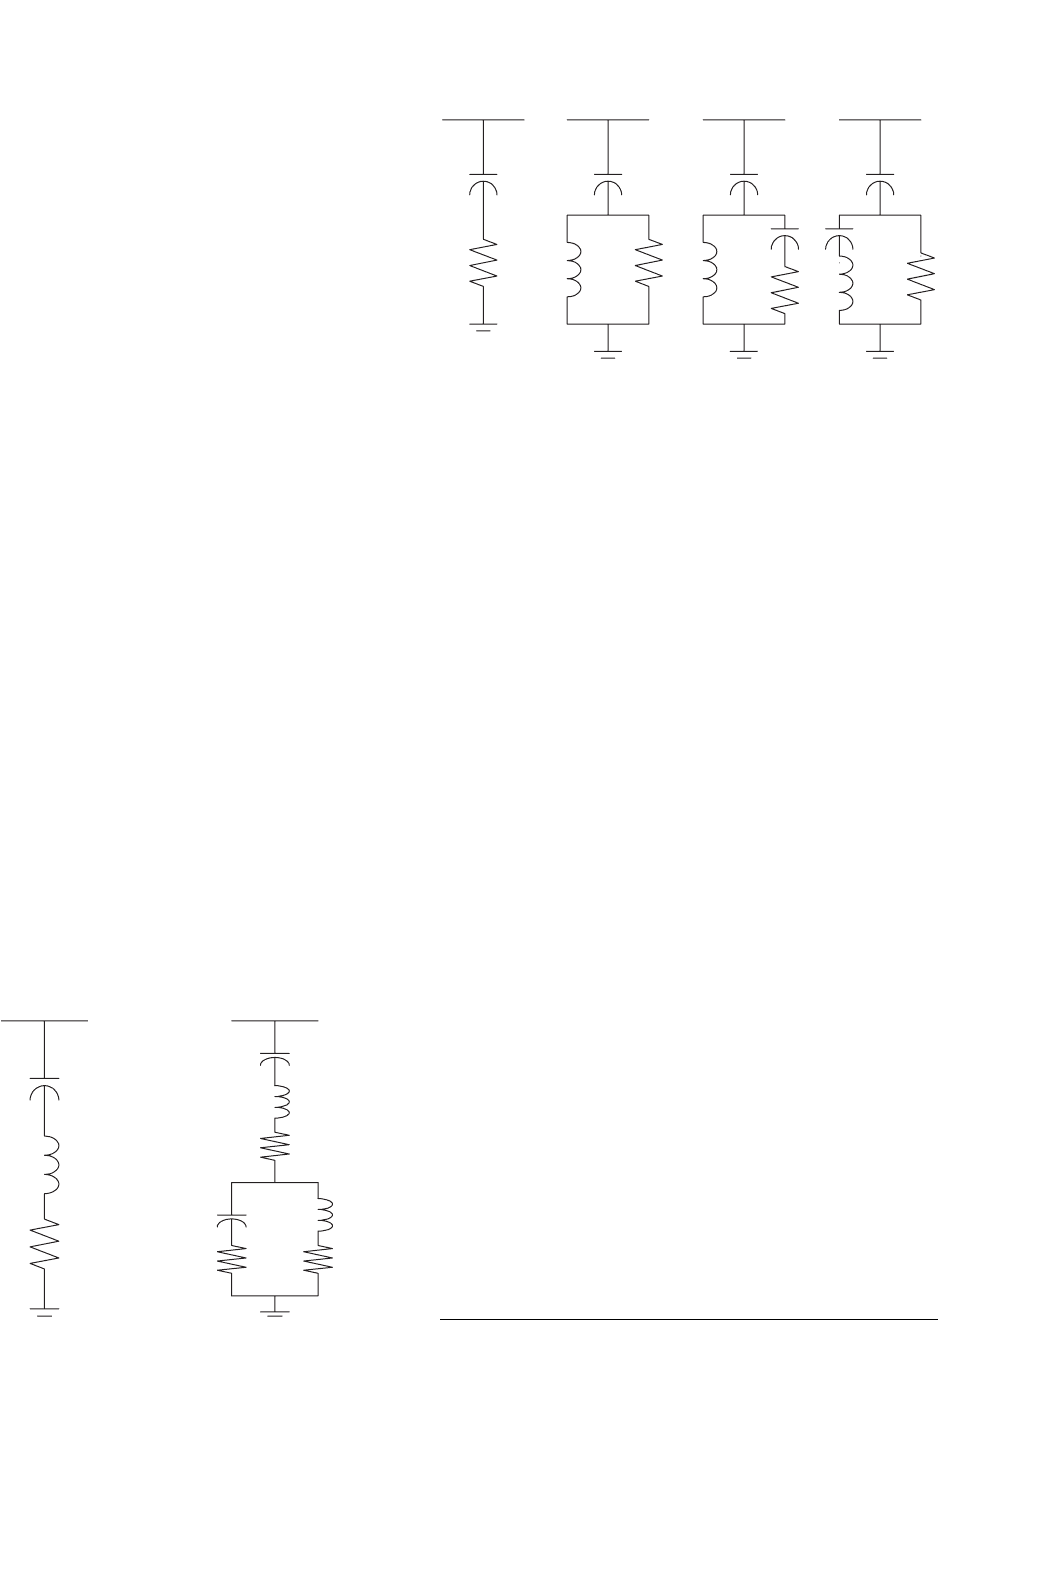
lent circuits for single- and double-tuned filters are shown
in Fig. 38.12. Equivalent circuits for first, second, third, and
“c-type” damped filters are shown in Fig. 38.13.
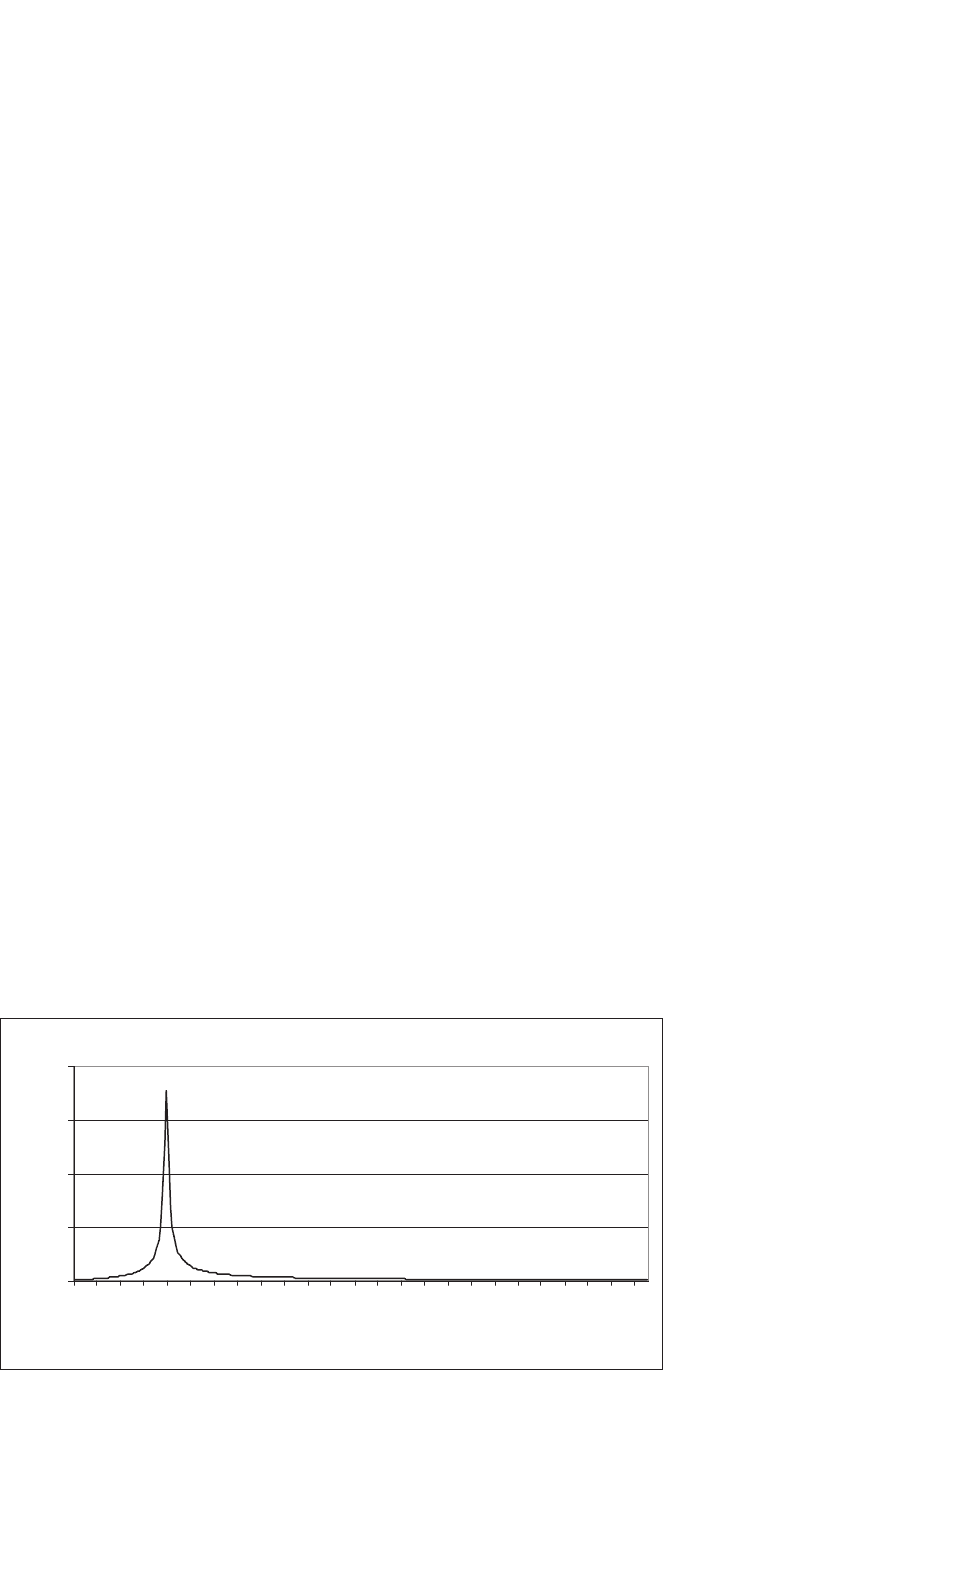
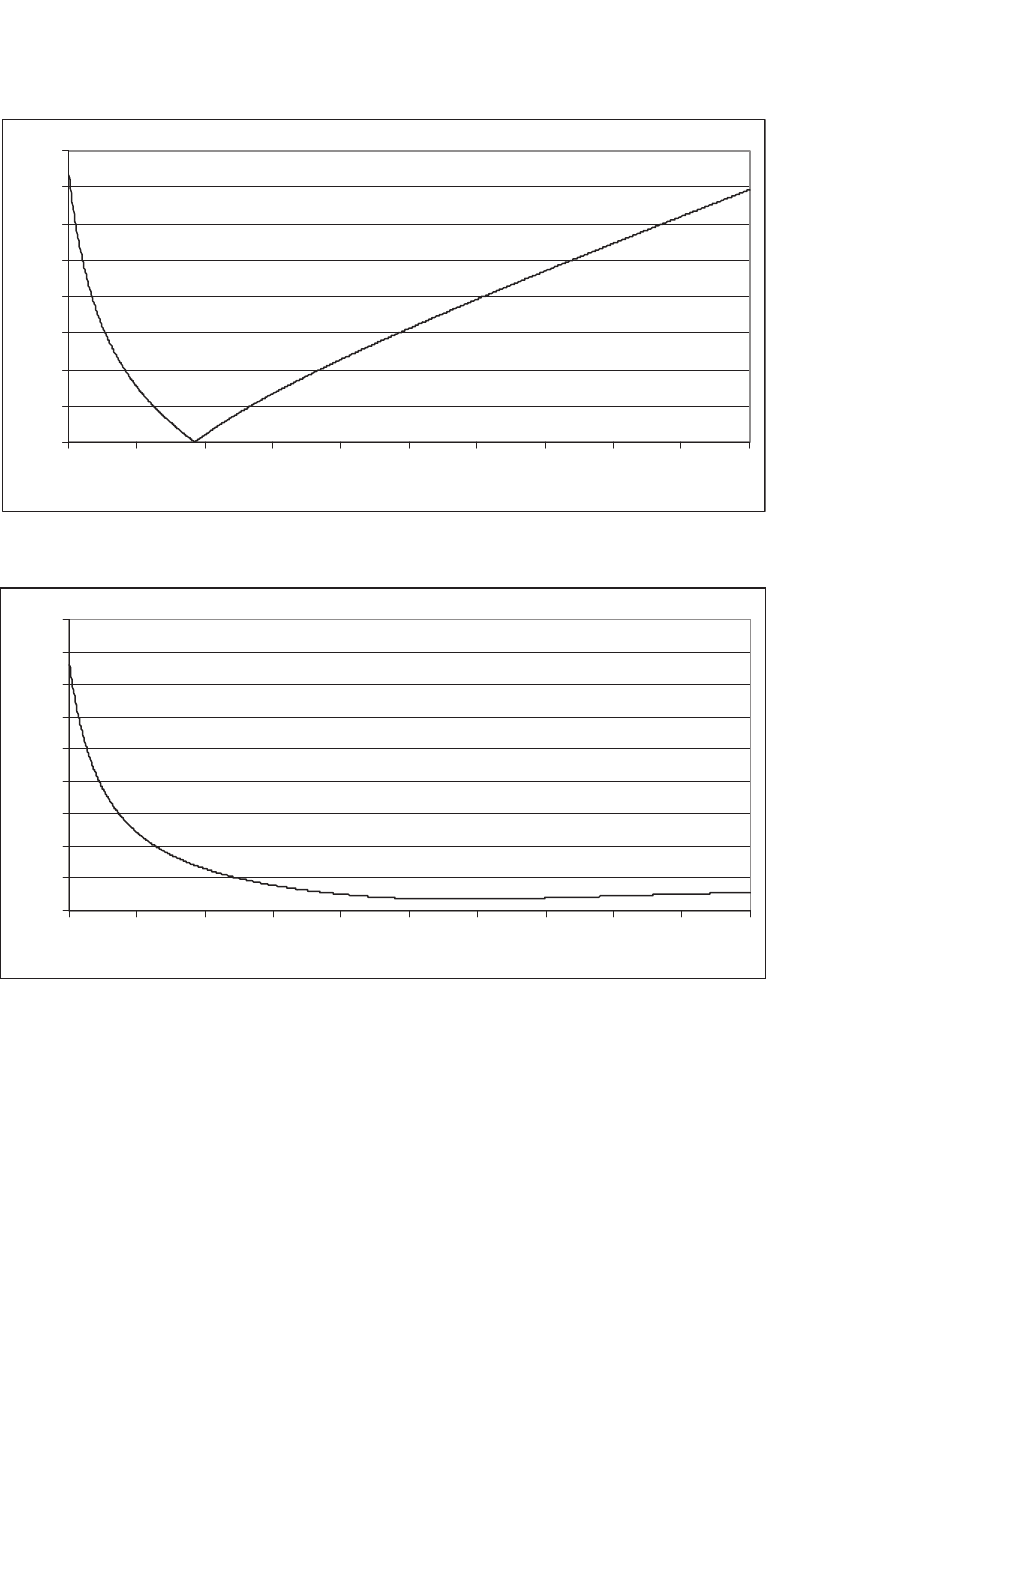
A plot of the impedance as a function of frequency for a
single-tuned filter is shown in Fig. 38.14. The filter is based on
a 480 V, 300 kvar (three-phase) capacitor bank and is tuned
to the 4.7th harmonic with a quality factor, Q, of 150. Note
that the quality factor is a measure of the “sharpness” of the
tuning and is defined as X/R where X is the inductive reactance
for the filter inductor at the (undamped) resonant frequency;
typically 50<Q<150 for tuned filters.
A plot of impedance as a function of frequency for a second-
order damped filter is shown in Fig. 38.15. This filter is based
on a 480 V, 300 kvar capacitor bank and is tuned to the 12th
harmonic. The quality factor is chosen to be 1.5. Note that the
quality factor for damped filters is the inverse of the definition
(a) (b)
FIGURE 38.12 Harmonic filters: (a) single-tuned and (b) double-
tuned.
(a) (b) (c) (d)
FIGURE 38.13 Damped filters: (a) first-order; (b) second-order;
(c) third-order; and (d) C-type.
for tuned filters; Q=R/X where X is the inductive reactance
at the (undamped) resonant frequency. Typically, 0.5<Q<1.5
for damped filters.
In most cases, it is common to tune single-tuned filter banks
to slightly below (typically around 5%) the frequency of the
harmonic to be removed. The reasons for this practice are as
follows:
1. For a low-resistance series resonance filter that is
exactly tuned to a harmonic frequency, the filter bank
will act as a sink to all harmonics (at the tuned
frequency) in the power system, regardless of their
source(s). This action can quickly overload the filter.
2. All electrical components have some non-zero tem-
perature coefficient, and capacitors are the most tem-
perature sensitive component in a tuned filter. Because
most capacitors have a negative temperature coefficient
(capacitance decreases and therefore tuned frequency
increases with temperature), tuning slightly lower than
the desired frequency is desirable.
Damped filters are typically used to control higher-order
harmonics as a group. In general, damped filters are tuned
in between the corresponding pairs of harmonics (11th and
13th, 17th and 19th, etc.) to provide the maximum harmonic
reduction at those frequencies while continuing to serve as a
(not quite as effective) filter bank for frequencies higher than
the tuned frequency. Because damped filters have significantly
higher resistance than single- or double-tuned filters, they are
usually not used to filter harmonics near the power frequency
so that filter losses can be maintained at low values.
38.4 IEEE Standards
The IEEE has produced numerous standards relating to the
various power quality phenomena discussed in Section 38.2.
Of these many standards, the one most appropriate to power
1064 S. M. Halpin and A. Card
0
0.1
0.2
0.3
0.4
0.5
0.6
0.7
0.8
60 180 300 420 540 660 780 900 1020 1140 1260
Frequency (Hz)
Impedance Magnitude (Ω)
FIGURE 38.14 Single-tuned filter frequency response.
0
0.1
0.2
0.3
0.4
0.5
0.6
0.7
0.8
0.9
60 180 300
420
540 660 780 900 1020 1140 1260
Frequency (Hz)
Impedance Magnitude (Ω)
FIGURE 38.15 Second-order damped filter frequency response.
electronic equipment is IEEE Standard 519-1992. This stan-
dard is actually a “recommended practice,” which means that
the information contained within represents a set of “recom-
mendations,” rather than a set of “requirements.” In practice,
this seemingly small difference in wording means that the har-
monic limits prescribed are merely suggested values; they are
not (nor were they ever intended) to be absolute limits that
could not be exceeded.
Harmonic control via IEEE 519-1992 is based on the con-
cept that all parties use and pay for the public power supply
network. Due to the nature of utility company rate structures,
end-users that have a higher demand pay more of the total
infrastructure cost through higher demand charges. In this
light, IEEE 519-1992 allows these larger end-users to produce
a greater percentage of the maximum level of harmonics that
can be absorbed by the supply utility before voltage distortion
problems are encountered. Because the ability for a harmonic
source to produce voltage distortion is directly dependent on
the supply system impedance upon the point where distortion
is to be evaluated, it is necessary to consider both
1. The size of the end-user and
2. The strength (impedance) of the system
at the same time in order to establish meaningful limits for
harmonic emissions. Furthermore, it is necessary to estab-
lish tighter limits in higher voltage supply systems than lower
voltage because the potential for more widespread problems
associated with high-voltage portions of the supply system.
38 Power Quality 1065
Unlike limits set forth in various IEC Standards, IEEE 519-
1992 established the “point of common coupling,” or PCC as
the point at which harmonic limits shall be evaluated. In most
cases (recall that IEEE 519-1992 is a “recommended practice”),
this point will be:
1. In the supply system owned by the utility company,
2. The closest electrical point to the end-user’s premises,
and
3. As in (2), but further restricted to points where other
customers are (or could be in the future) provided with
electric service.
In this context, IEEE 519-1992 harmonic limits are designed
for an entire facility and should not be applied to individual
pieces of equipment without great care.
Because the PCC is used to evaluate harmonic limit com-
pliance, the system strength (impedance) is measured at this
point and is described in terms of available (three-phase)
short-circuit current. Also, the end-user’s maximum average
demand current is evaluated at this point. Maximum demand
is evaluated based on one of the following:
1. The maximum value of the 15 or 30 minute average
demand, usually considering the previous 12 month’s
billing history or
2. The connected kVA or horsepower, perhaps multiplied
by a diversity factor.
The ratio of I
SC
to I
L
, where I
SC
is the available fault cur-
rent and I
L
is the maximum demand current, implements the
founding concept of IEEE 519-1992: larger end-users can cre-
ate more harmonic currents, but the specific level of current
that any end-user may produce is dependent on the strength
of the system at the PCC. Tables 38.3–38.5 show the harmonic
current limits in IEEE 519-1992 for various voltage levels.
In general, it is the responsibility of the end-user to insure
that their net harmonic currents at the PCC do not exceed the
values given in the appropriate table. In some cases, usually
TABLE 38.3 Current distortion limits for general distribution systems,
120 V–69 kV
Maximum harmonic current distortion in percent of I
L
I
SC
/I
L
<11 11 ≤ h < 17 17 ≤ h < 23 23 ≤ h < 35 h ≥ 35 TDD
<20
1
4.0 2.0 1.5 0.6 0.3 5.0
20<50 7.0 3.5 2.5 1.0 0.5 8.0
50<100 10.0 4.5 4.0 1.5 0.7 12.0
100<1000 12.0 5.5 5.0 2.0 1.0 15.0
≥1000 15.0 7.0 6.0 2.5 1.4 20.0
Individual harmonic order h (odd harmonics).
Even harmonics are limited to 25% of the odd harmonic limits above.
Current distortions that result in a dc offset are not allowed.
1
All power generation equipment is limited to these values of current
distortion regardless of the value of I
SC
/I
L
.
TABLE 38.4 Current distortion limits for general subtransmission
systems, 69.001–161 kV
Maximum harmonic current distortion in percent of I
L
I
SC
/I
L
<11 11 ≤ h < 17 17 ≤ h < 23 23 ≤ h < 35 h ≥ 35 TDD
<20
1
2.0 1.0 0.75 0.3 0.15 2.5
20<50 3.5 1.75 1.25 0.5 0.25 4.0
50<100 5.0 2.25 2.0 0.75 0.35 6.0
100<1000 6.0 2.75 2.5 1.0 0.5 7.5
≥1000 7.5 3.5 3.0 1.25 0.7 10.0
Individual harmonic order h (odd harmonics).
Even harmonics are limited to 25% of the odd harmonic limits above.
Current distortions that result in a dc offset are not allowed.
1
All power generation equipment is limited to these values of current
distortion regardless of the value of I
SC
/I
L
.
TABLE 38.5 Current distortion limits for general transmission systems,
>161 kV
Maximum harmonic current distortion in percent of I
L
I
SC
/I
L
<11 11 ≤ h < 17 17 ≤ h < 23 23 ≤ h < 35 h ≥ 35 TDD
<50
1
2.0 1.0 0.75 0.3 0.15 2.5
≥50 3.0 1.5 1.15 0.45 0.22 3.75
Individual harmonic order h (odd harmonics).
Even harmonics are limited to 25% of the odd harmonic limits above.
Current distortions that result in a dc offset are not allowed.
1
All power generation equipment is limited to these values of current
distortion regardless of the value of I
SC
/I
L
.
TABLE 38.6 Voltage distortion limits
Bus voltage at PCC Individual harmonic Total voltage
magnitude (%) distortion (THD in %)
≤69 kV 3.0 5.0
69.001–161 kV 1.5 2.5
>161 kV 1.0 1.5
associated with parallel resonance involving a utility-owned
capacitor bank, it is possible that all customers will be within
the prescribed limits, but voltage distortion problems exist.
In these cases, it is generally the responsibility of the supply
utility to insure that excessive voltage distortion levels are not
present. The harmonic voltage limits that are recommended
for utility companies are given in Table 38.6.
38.5 Conclusions
In this chapter, various power quality phenomena have been
described, with particular focus on the implications on power

1066 S. M. Halpin and A. Card
electronic converters and equipment. While one popular opin-
ion “blames” power electronic equipment for “causing” most
power quality problems, it is quite clear that power electronic
converter systems can play an equally-important role in reduc-
ing the impact of power quality problems. While it is true that
power electronic converters and systems are the major cause of
harmonic-related problems, the application (in general terms)
of IEEE 519-1992 limits for current and voltage harmonics
has led to the reduction, elimination, and prevention of most
harmonics problems. Other power quality phenomena, like
grounding, sags, and voltage flicker, are most often completely
unrelated to power electronic systems. In reality, advances in
power electronic circuits and control algorithms are making
it more possible to control these events and minimize the
financial impacts of the majority of power quality problems.
Further Reading
1. ANSI Std C84.1-1995, Electric Power Systems and Equipment – Voltage
Ratings (60 Hz).
2. IEEE Std 493-1997, IEEE Recommended Practice for the Design of
Reliable Industrial and Commercial Power Systems (IEEE Gold Book),
© IEEE 1998.
3. IEEE Std 142-1991, IEEE Recommended Practice for Grounding of
Industrial and Commercial Power Systems (IEEE Green Book), © IEEE
1992.
4. National Fire Protection Association 70-1999, National Electrical
Code, 1999.
5. IEEE Std 519-1992, IEEE Recommended Practices and Requirements
for Harmonic Control in Electrical Power Systems, © IEEE 1993.
6. IEEE Std 141-1993, IEEE Recommended Practice for Electric Power
Distribution for Industrial Plants (IEEE Red Book), © IEEE 1994.
7. J.L. Gutierrez Iglesias, Chairman UIE Working Group WG2, “Part 5:
Flicker and Voltage Fluctuations,” 1999.
8. International Electrotechnical Commission, IEC Technical Report
61000-4-15, Flickermeter – Functional and Design Specifications, 1997.
9. IEEE Std 1100-1999, IEEE Recommended Practice for Powering and
Grounding Electronic Equipment (IEEE Emerald Book), © IEEE
1999.
10. IEEE Std 1159-1995, IEEE Recommended Practice for Monitoring
Electric Power Quality, © IEEE 1995.
11. E.W. Kimbark, Direct Current Transmission, Volume I. © John Wiley
& Sons, 1948.

39
Active Filters
Luis Morán
Electrical Engineering Dept.,
Universidad de Concepción
Concepción, Chile
Juan Dixon
Electrical Engineering Dept.,
Universidad Católica de Chile
Santiago, Chile
39.1 Introduction ........................................................................................ 1067
39.2 Types of Active Power Filters .................................................................. 1068
39.3 Shunt Active Power Filters...................................................................... 1069
39.3.1 Power Circuit Topologies • 39.3.2 Control Scheme • 39.3.3 Power Circuit Design
• 39.3.4 Technical Specifications
39.4 Series Active Power Filters ...................................................................... 1085
39.4.1 Power Circuit Structure • 39.4.2 Principles of Operation • 39.4.3 Power Circuit Design
• 39.4.4 Control Issues • 39.4.5 Control Circuit Implementation • 39.4.6 Experimental
Results
39.5 Hybrid Active Power Filters .................................................................... 1094
39.5.1 Principles of Operation • 39.5.2 The Hybrid Filter Compensation Performance
• 39.5.3 Experimental Results
Further Reading ................................................................................... 1101
39.1 Introduction
The growing number of power electronics-based equipment
has produced an important impact on the quality of electric
power supply. Both high power industrial loads and domestic
loads cause harmonics in the network voltages. At the same
time, much of the equipment causing the disturbances is quite
sensitive to deviations from the ideal sinusoidal line voltage.
Therefore, power quality problems may originate in the system
or may be caused by the consumer itself. Moreover, in the
last years the growing concern related to power quality comes
from:
• Consumers that are becoming increasingly aware of the
power quality issues and being more informed about the
consequences of harmonics, interruptions, sags, switch-
ing transients, etc. Motivated by deregulation, they are
challenging the energy suppliers to improve the quality
of the power delivered.
• The proliferation of load equipment with microprocessor-
based controllers and power electronic devices which are
sensitive to many types of power quality disturbances.
• Emphasis on increasing overall process productivity,
which has led to the installation of high-efficiency equip-
ment, such as adjustable speed drives and power factor
correction equipment. This in turn has resulted in an
increase in harmonics injected into the power system,
causing concern about their impact on the system
behavior.
For an increasing number of applications, conventional
equipment is proving insufficient for mitigation of power qual-
ity problems. Harmonic distortion has traditionally been dealt
with the use of passive LC filters. However, the application of
passive filters for harmonic reduction may result in parallel
resonances with the network impedance, over compensation
of reactive power at fundamental frequency, and poor flexibil-
ity for dynamic compensation of different frequency harmonic
components.
The increased severity of power quality in power networks
has attracted the attention of power engineers to develop
dynamic and adjustable solutions to the power quality prob-
lems. Such equipment, generally known as active filters, are
also called active power line conditioners, and are able to
compensate current and voltage harmonics, reactive power,
regulate terminal voltage, suppress flicker, and to improve
voltage balance in three-phase systems. The advantage of active
filtering is that it automatically adapts to changes in the net-
work and load fluctuations. They can compensate for several
harmonic orders, and are not affected by major changes in net-
work characteristics, eliminating the risk of resonance between
the filter and network impedance. Another plus is that they
take up very little space compared with traditional passive
compensators.
Copyright © 2007, 2001, Elsevier Inc.
All rights reserved.
1067