Morris & Fan. Reservoir Sedimentation Handbook
Подождите немного. Документ загружается.

MODELING OF SEDIMENT TRANSPORT AND DEPOSITION IN RESERVOIRS 11.19
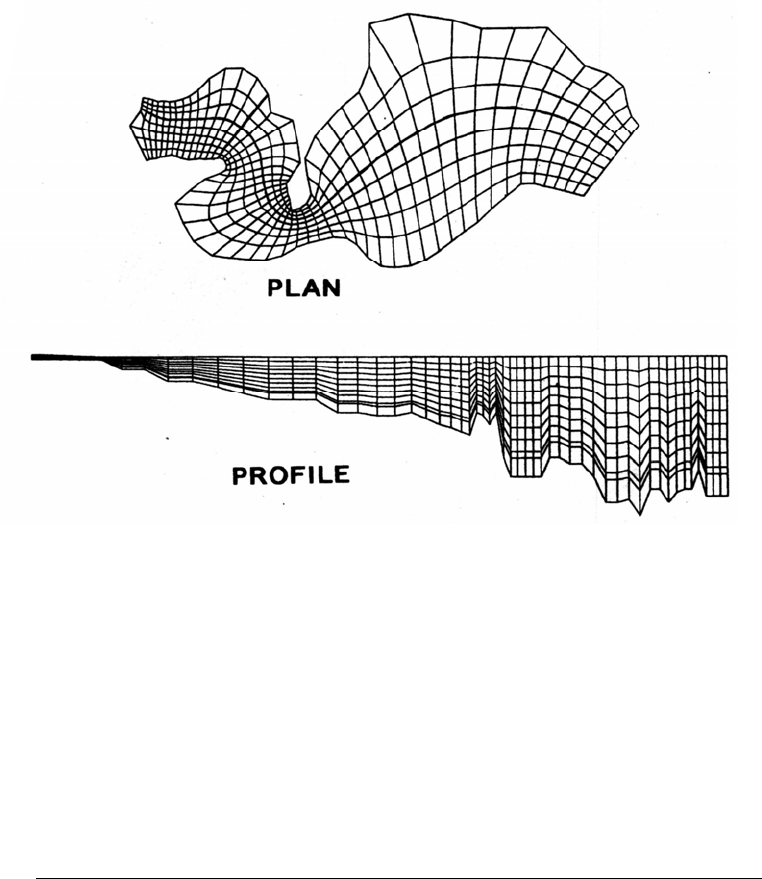
FIGURE 11.9 Example of a geometric mesh used in a three-dimensional model of Angostur
a
Reservoir, Costa Rica (courtesy of N. OIsen, SINTEF, Trondheim, Norway).
m
ents in physical models. Particle animation is provided to aid flow visualization.
Application of this model to the analysis of sediment accumulation at two
hydropower reservoirs in Costa Rica has been reported by Olsen et al. (1994). Flow
fields simulated by this model are illustrated in Fig. 11.10. The model, which runs under
the OS/2 operating system, is available at no cost the developer, Nils Olsen at the
Norwegian Institute of Technology, and the program and documentation can be
downloaded from the Internet. It may be located by conducting a search for SSIIM
13.ZIP or SSIIM using an Internet search tool.
11.7 PHYSICAL MODELING
A physical model is a scaled physical representation of the prototype system which uses a
fluid and sediment to simulate prototype behavior. Water is almost always used as a fluid,
although in some instances air models have been used for analysis of problems such as
groyne locations for river training. Model sediment may consist of natural grains or
artificial material such as plastics or walnut shells. Basic concepts of physical
modeling and scaling are summarized by French (1985) and Borg (1993). A
physical model used to analyze reservoir flushing is shown in Fig. 11.11.
Physical models can generally be classified into four categories: (1)
undistorted fixed-bed model in which both vertical and horizontal scales are equal, (2)
distorted fixed-bed model with a larger vertical than horizontal scale, (3) undistorted
movable-bed model, and (4) distorted movable-bed model. Physical models
MODELING OF SEDIMENT TRANSPORT AND DEPOSITION IN RESERVOIRS 11.20
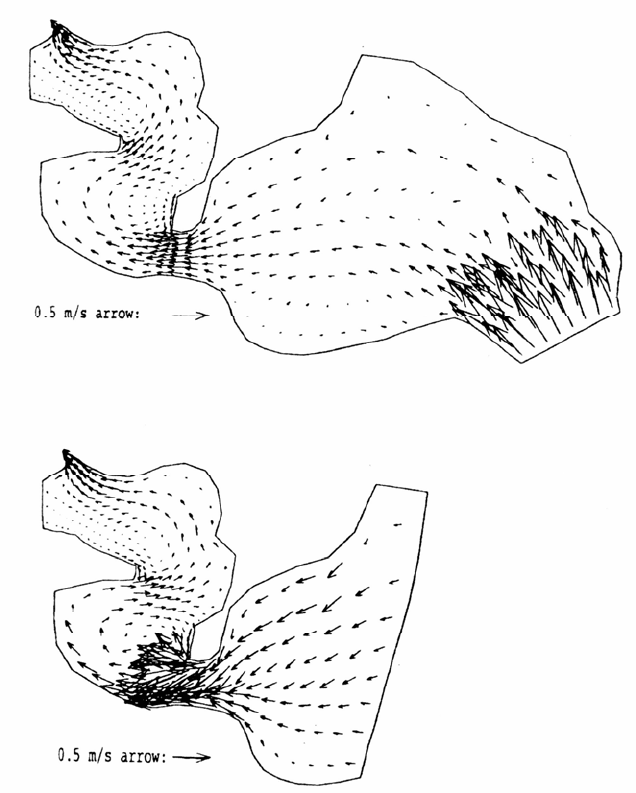
FIGURE 11.10 Simulation of change in flow velocities due to sediment accumulation in the proposed
Angostura reservoir in Costa Rica. Top: Initial condition. Bottom: condition after 6.8 years of
sedimentation. (Olsen et al., 1994).
must be both geometrically and dynamically similar to the prototype system and
should maintain the proper relationship between the forces influencing water and
sediment movement: gravity, fluid friction, viscosity, surface tension, and sediment
cohesion. However, a geometric scale model does not produce true dynamic
similarity because the ratios between these forces are not preserved when physical
dimensions are scaled. Thus, model scales are selected to preserve the scale ratios
of the most important forces, while allowing some deviation in less important
parameters. In a distorted model, the vertical scale is exaggerated to produce
adequate flow depths. Distortion is required in hydraulic models when the
physical size of the prototype system is such that large model scales must be used
(e.g., the 1:2000 scale model of the Mississippi River). Without vertical distor-
tion flow depths would become too small to measure satisfactorily, and the shallow flow
may be laminar and also affected by surface tension. In models using a scale factor on the
order of 1:50, problems due to scaling of forces are minimized because gravity is the
MODELING OF SEDIMENT TRANSPORT AND DEPOSITION IN RESERVOIRS 11.21
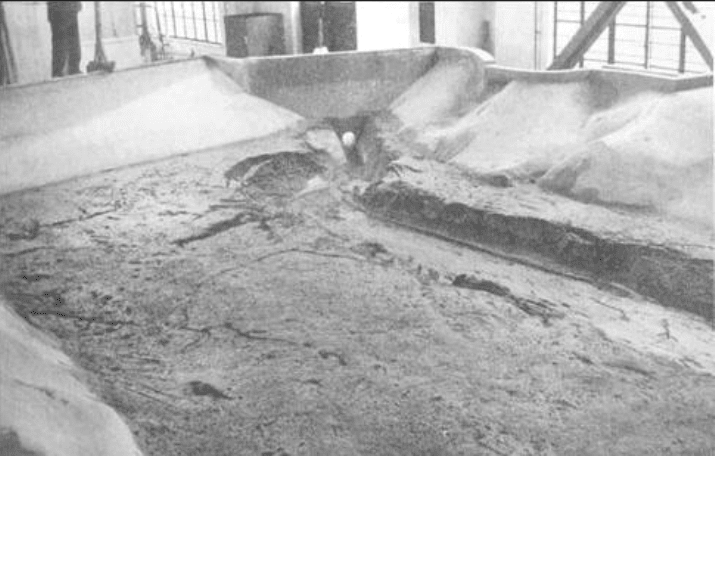
FIGURE 11.11 Physical model at 1:50 scale used to simulate the formation of a flushing channel
sing an 8m diameter low-level outlet at the Changma Dam on Shule River in the Gobi Desert.
odel constructed by the Northwest Hydrotechnical Science Research Institute under contract to
anzu Provincial Government, China (G. Morris)
u
M
G
prim
ary force influencing open-channel hydraulics in both the prototype system and at the
model scale; out-of-scale forces such as fluid friction and surface tension do not introduce
significant error.
The design and operation of movable bed models is much more complex than fixed-
boundary hydraulic models. Boundary roughness in a movable bed model may be influ-
enced by bed forms as well as grain size, the model must simulate the motion of sediment
as well as water, and fine sediment cohesion cannot be scaled properly. The need for
vertical distortion occurs frequently in movable-bed models, since the slopes and
velocities characteristic of an undistorted hydraulic model are often too small to move any
of the model materials used to simulate stream sediment. Exaggeration of the vertical
scale produces greater flow depths and higher tractive forces.
11.7.1 Applicability of Physical Models
Physical models are well suited for analyzing problems involving complex geometry,
river morphology, or flow curvature which result in sediment concentration profiles and
deposit pattern varying in both the transverse and longitudinal directions. Problems of this
type involve the design of sluice gates and low-level outlets for sediment flushing, flow
training structures, scour and deposition patterns in the vicinity of structures, and
sedimentation in navigation channels and locks. Turbidity currents may also be simu-
lated.
As an advantage, physical modeling has traditionally been more visual and intuitive
than mathematical modeling, since the physical scale model provides the direct and
immediate representation of flow features and sediment patterns. Processes may be
visually documented with a video camera. A visit to a hydraulic laboratory to view a

MODELING OF SEDIMENT TRANSPORT AND DEPOSITION IN RESERVOIRS 11.22
physical model is impressive, and the physical results can be understood in an intuitive
manner by non-modelers.
11.7.2 Disadvantages of Physical Models
Key disadvantages of physical models include high cost, long time periods required to
run extended simulations, and immobility. A physical model is constructed at a single
laboratory and cannot be transported or easily reproduced, and it cannot be stored for
a long period since it occupies laboratory space needed for other studies. Contracts for
physical modeling work typically include a clause specifying the period after work is
completed that the model will be maintained in operable condition, in case a review
indicates the need for further modeling activities. Physical models are not capable of
accurately scaling cohesive sediment behavior. When a question can be adequately
addressed by either a mathematical model or a physical model, it is generally less
costly to use mathematical modeling. Physical modeling tends to focus on the analysis
of situations where the flow fields are too complex for mathematical modeling, for
analysis of bed morphology, or where it is important to have an intuitive physical
representation of the system.
11.8 COMBINING NUMERICAL AND PHYSICAL
MODELS
Reservoir problems frequently require the application of both physical and numerical
models. Numerical modeling is used to simulate sediment movement along the long
impounded reach and to simulate scour and armoring in the reach below the dam.
Physical modeling is used to simulate the details of the complex flow field and sediment
movement in the vicinity of the structure. The numerical model can be used to simulate
the amount and grain size of sediment delivered into the vicinity of the dam. The
physical model routes the inflowing sediment through the structure, analyzing
patterns of deposition and scour. The conjunctive use of both physical and
numerical models is illustrated in the Feather River case study.
11.9 EXAMPLES OF PHYSICAL MODEL SCALING AND
OPERATION
A physical modeling study on California's Feather River is described in Chap. 22. The
Feather River study involved the modification of an existing small structure for which
there was a well-documented calibration event, and required the analysis of bed material
load only. This section presents an example of a complex physical modeling study
for the Gezhouba Project on China's Yangtze River involving the simultaneous
analysis of bed load, suspended load, and density currents, for a wide range of sediment
diameters, for the design of new structure on a major river. The physical modeling
work was reported by Dou (1977), Li and Jin (1981), Tang and Lin (1987), and Tang
(1990). The physical model and prototype system are compared in Fig. 11.12.
The Gezhouba Project is a multipurpose dam on China's Yangtze River, 47 m high,
impounding a 1580-Mm
3
reservoir. Mean annual runoff is 542,900 Mm
3
, and the average
annual sediment load includes 520×10
6
tons of suspended load, 6×10
6
tons of sand-size
MODELING OF SEDIMENT TRANSPORT AND DEPOSITION IN RESERVOIRS 11.23
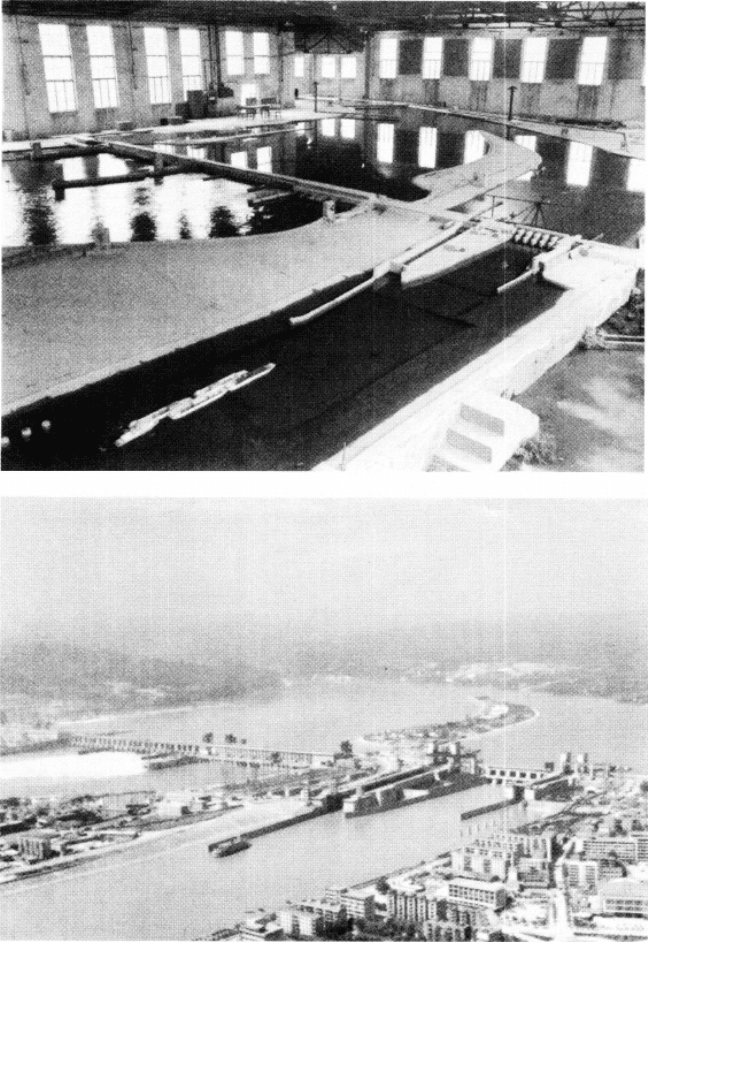
FIGURE 11.12 Physical model (top) and aerial view of completed project (bottom) at
Gezhouba Dam, Yangtze River, China (courtesy Yangtze River Academy of Science).
MODELING OF SEDIMENT TRANSPORT AND DEPOSITION IN RESERVOIRS 11.24
bed load, and 700,000 tons of gravel bed load. The median diameter of suspended
sediment is 0.034 mm, and the gravel portion of the bed load has a median diameter of
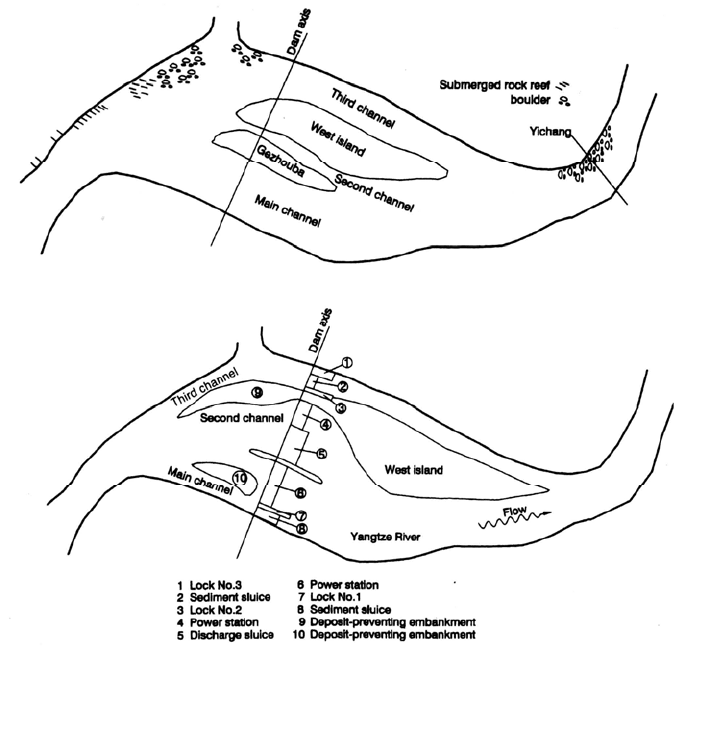
about 24 mm. The dam is situated 2.8 km downstream of the Nanjinguan Gorge, below the
famous Three Gorges reach. At this point the main current direction turns almost 90° to the
right, the river width increases from 300 m at the Nanjinguan Gorge to 2200 m near the dam
axis, and the river form transitions from a single narrow channel to three channels with a wide
cross section (Fig. 11.13). Given the large flood discharge and limitations imposed by
navigation requirements, the main sluice structure was located in the middle channel and
Gezhouba Island was partially excavated to improve the approaches to the flood sluices.
Power plant intakes and navigation locks were placed on either side of the sluices.
11.9.1 Problem Identification
Three main sediment management problems needed to be solved for this project. First,
it was necessary to determine the general layout of hydraulic structures along the dam
Figure 11.13 configuration of preproject Yangtze River in the vicinity of the Gezhuboa Da
m
site (top). Layout of the Gezhouboa Project as constructed (bottom)

MODELING OF SEDIMENT TRANSPORT AND DEPOSITION IN RESERVOIRS 11.25
axis: flood sluices, sediment sluices, power intakes, and navigation locks. Second, there
were sedimentation issues to be addressed at the navigation locks and their upstream
and downstream approach channels, including the mechanics of sediment deposition in
blind channels and desiltation measures. Third, it was necessary to determine details of
the layout approach of sediment sluices beneath the power intakes, which would pass
the coarser fraction of the sediment load and decrease the amount of sediment passing
through the hydro turbines.
11.9.2 Model Type and Scales
The physical model simulated a 16-km river reach and was designed as a movable bed
model which was supplied both suspended and bed material at the upstream boundary.
Given the available laboratory space and water supply, a distorted model was selected
with a horizontal scale ratio of 1:200 and a vertical scale of 1:100. Prototype flow con-
ditions were very complex and included the transport of a wide range of particle sizes:
bed load, suspended load, and density currents were to be simulated simultaneously in a
single model. Not all similarity conditions could be satisfied simultaneously, so the
main scale parameters were satisfied while some deviation was allowed on secondary
scales. The scale ratios used are listed in Table 11.3.
TABLE 11.3 Computed Scale Ratios
Parameter Symbol Scale ratio
Geometric
parameters
Length
Water depth
L
r
h
r
200
100
Flow parameters Velocity
Roughness
Discharge
v
r
r
Q
r
10
1.52
200,000
Suspended load Settling velocity
Sediment diameter
Critical velocity
Concentration
Dry Specific weight
Time scale
w
r
d
r
(v
0
)
r
s
r
(
0
)
r
(t
s
)
r
5
1.1
10
0.46
2.25
98.3 (computed)
96 (adopted)
Density current Velocity
Time of deposition
(v
0
)
r
(t
s
)
r
10
98.3
Bed load (sand) Sediment diameter
Critical velocity
Sediment trasport
rate
Dry specific weight
Time scale
d
r
(v
0
)
r
(q
bs
)
r
(
0
)
r
(t
bs
)
r
1.25
10
459
2.25
98.3 (computed)
96 (adopted)
Bed load (gravel) Diameter
Critical Velocity
Sediment trasport
rate
Dry specific weight
Time scale
d
r
(v
0
)
r
(q
bg
)
r
(
0
)
r
(t
bs
)
r
12.5
10
320
1.89
118 (computed)
96 (adopted)
MODELING OF SEDIMENT TRANSPORT AND DEPOSITION IN RESERVOIRS 11.26
11.9.3 Establish the Initial Boundary Conditions and Scale Sediment
To select an appropriate model sediment, flume tests were made on the initiation of
motion of many artificial sediments before selecting bakelite (plastic) powder with a spe-
cific weight of 1.4 t/m
3
. The bakelite powder had a wide range of grain sizes, from 0.01 to
10 mm, making it possible to simulate the full range of sediment found in the prototype
system, from suspended load to gravels. The d
50
for the model bed load was about 0.14
mm with a Manning roughness of 0.016, and a velocity for initiation of motion of about 6
to 7 cm/s. Field measurement and computations indicated that the critical velocity for ini-
tiation of bed load motion in the prototype was 0.6 m/s, which is about 10 times the critical
velocity for the model, satisfying the corresponding scaling criteria.
11.9.4 Model Construction
The model was constructed as an accurate scale replica of the prototype. The physical
model was 80 m long, equivalent to 16 km in the prototype system. The simulated bed
load of sand and gravel was introduced at the upstream end of the model, and a recircu-
lation system was used for the suspended load. During tests the concentration profiles
and grain size distribution of suspended sediment were measured in the model, and
inflow and outflow concentrations were measured at 15-min intervals. Sediment feed
was adjusted as required to maintain the proper sediment inflow conditions.
11.9.5 Calibration
Model scales and roughness were calibrated by measuring vertical velocity distribution
and water levels. Patterns of flow, sediment deposition, and erosion in the model were
calibrated against conditions observed in the field in 1971, and conditions with coffer-
dams across the left and right channels in 1972. Water levels were calibrated for dis-
charges varying from 5300 to 33,500 m
3
/s, and extra roughness was added in some
areas to make the water surface profile in the model better match the prototype. The
velocity distribution in both the prototype and the model were measured to check that the
vertical mean velocities across cross sections and vertical velocity distributions were
similar. Variations in transverse and vertical suspended sediment concentrations were
also measured and compared. When discharges exceeded 20,000 m
3
/s, turbidity
currents were observed in the model.
Gravels are not transported through the Nanjinguan Gorge for discharges less than
20,000 m
3
/s, and at higher flows they are transported primarily along the right-hand
channel. Gravels equivalent to a prototype grain diameter of 100 mm could be trans-
ported throughout the entire length of the model.
Similarity of topography and the grain size distribution of sediment deposits between
the prototype and the model must be achieved by adjusting the sediment inflow rate and
grain size distribution to match the suspended sediment concentration, bed load
transport, grain size distribution, outflow sediment characteristics, and sediment
transport time scale observed in the prototype. Model scale ratios were adjusted by trial
and error until the topographic features and grain size distribution of deposits in the
prototype system were reproduced satisfactorily by the model. Topographic calibration is
the most complex and difficult problem in model tests. Calibration periods consisted
of a 3 month flood season and an entire year. Model results were compared to
prototype topographic surveys which indicated both the configuration and volume of
the deposits. There were 31 model runs for the purpose of topographic calibration, of
which 29 were preparatory model runs and two were formal test runs. The 29

MODELING OF SEDIMENT TRANSPORT AND DEPOSITION IN RESERVOIRS 11.27
preparatory runs were made to adjust (1) the roughness, load, and size distribution of the
inflowing sediment, and (2) the time scale, by observing the effect on deposit patterns.
The last two formal test runs were conducted under identical operating conditions to
examine the degree of similarity and the stability of model behavior. Tests showed
that the total prototype deposit volume was simulated adequately by the model.
Test 1 Test 2 Prototype
3-month deposit, Mm
3
2.82 2.71 2.9
1-year deposit, Mm
3
2.77 2.83 2.55
There are two time scales in the model, one for the flow of water and another for sed-
iment, the latter being used for model operation. On the basis of the results of
topographic calibration, a model time scale of 96 was adopted (1 day of model
operation equivalent to 96 days in the prototype system). The topographic distribution of
deposits in the model reasonably approximated the prototype behavior except in the
reaches immediately upstream of the cofferdam. From this work, it was concluded
that the model could be used to predict flow patterns and sediment features after
construction of the dam.
11.9.6 Predictive Simulation
Proposed project conditions were simulated by adding a scaled model of the hydraulic
structures that reproduced topographic and structural details and the roughness of wetted
surfaces. The flow patterns and sediment regimes caused by alternative structural
arrangements were tested extensively in hundreds of test runs performed from 1974 to
1980. Problems analyzed included: general layout of hydraulic structures, flow regime
for navigation and realignment of the navigational channels, scour and deposition in
navigational channels, location and quantity of sediment erosion and deposition, and the
grain size and concentration of sediment entering the hydropower plant.
11.9.7 Design Recommendations
On the basis of model testing, the navigation approach channels and locks were designed
to incorporate guide dikes to improve flow conditions and to reduce sediment load
entering the approach channel. Sediment sluices were set adjacent to the navigation
locks to flush accumulated sediment twice annually: once during the flood season and
once at the end of the flood season. Residual sediment deposits remaining in dead zones
after flushing are removed by dredging. The flood sluices were designed to pass
floodborne sediment, and modeling indicated that about 95 percent of the total gravel load
would be discharged in this manner. Sediment release through flood sluices reduces the
sediment load on the navigation and power systems, and the coarse sediment load
entering the turbines was reduced by placing bottom outlets immediately beneath the
power intakes.
11.9.8 Validation
For validation, the model is operated to simulate an event which affects the prototype
system, but which is different from the calibrated conditions, to ensure that the model
accurately simulates prototype response. The first phase of dam construction was com-

MODELING OF SEDIMENT TRANSPORT AND DEPOSITION IN RESERVOIRS 11.28
pleted in the winter of 1980 and a major flood during the autumn of 1981 caused large
changes to the river bed upstream and downstream of the dam. Model validation tests
were made using 1981 field data for the inflow hydrograph and bed topography. Tests
showed that the amount of sedimentation, the spatial and grain size distribution of
the deposits, and outflow concentration, were in satisfactory agreement with prototype
data.
11.10 CLOSURE
Modeling is an essential process for understanding and managing the behavior of a flu-
vial system. Mathematical modeling can be very helpful, even when calibration data are
extremely sparse, by providing additional insight into the probable behavior of the
system and by focusing investigations within the context of a formal analytical
framework. Sensitivity analysis can help identify critical issues. However, it should
always be recalled that formal modeling supplements, but does not replace, conceptual
modeling and engineering judgment. Site visits, prior experience, review of case
studies, and a geomorphic evaluation and identification of significant historical events
and trends are all essential components of modeling studies