Middleton G.V. (Ed.) Encyclopedia of Sediments and Sedimentary Rocks
Подождите немного. Документ загружается.

PEAT
515
conductivity, and be devoid of aerobic microfauna and
bacteria. A lower layer or catotelm will develop with
characteristics quite distinct from the acrotelm layer on the
surface (Ingram, 1978). Decay processes are generally fast
immediately following death of the plant and slow down
considerably as the peat enters and continues to reside in the
catotelm. The acrotelm is the primary peat-forming layer
where decay processes predominate compared to the catotelm.
Decay continues in the catotelm but at rates several orders of
magnitude less than in the acrotelm. Peat that makes it into the
catotelm is preserved for several hundreds and thousands of
years following death of the plants.
Waterlogging, therefore, is the key ingredient leading to peat
accumulation. Because the diffusion of oxygen is many orders
of magnitude slower in water than in air, the low oxygen
regime brought about by waterlogging, leads to accumulation.
If waterlogging is interrupted in any one year, no peat will
make it into the catotelm and no net accumulation will occur.
If dry conditions persist over several years, it is possible that
catotelm peat may become re-exposed to oxygen, and the
peatland will degrade.
Peat landforms with acrotelm and catotelm layers, and
hence, actively forming and accumulating peat are referred to
as mires. Such two-layered mires are diplotelmic (Ingram,
1978).
The term peatland originates from the early writings
where peatland was used to describe any land area covered by
peat (Gorham, 1953). It is also probably a shortened version
for "peat landform" in geomorphology that refers to the biotic
landforms formed of peat. In North America mire is generally
not recognized, and instead, peatlatid is used in the broadest
sense to denote any peat landform irrespective of whether it is
diplotelmic or not and whether it is actively forming and
accumulating peat or not. In Europe and Russia, there is a
tendency to differentiate actively peat-accumulating mires
from the more generic peatland term, which applies to all
peatiands regardless of actively peat-accumulating or not.
The term haplotelmic is used when only the catotelm
remains (Ingram, 1978). Erosion or human alteration are the
primary forces responsible for eliminating the acrotelm.
Whether natural aging of the peat-accumulating system can
also contribute to disappearance of the acrotelm is less clear,
such as polygon peatiands in Arctic Canada (Vardy and
Warner, 2002).
A maximum depth for peatiands is unbounded. Average
depth globally has been estimated to be
1.3-1.4
m (Lappalainen,
1996) and a maximum of
15
m is rarely exceeded (Clymo, 1983).
At the other end of the spectrum, it has been customary to
take an arbitrary minimum depth of 30, 40, or 50cm. In
diplotelmic systems, the catotelm is the thicker being several
meters compared to the thinner acrotelm, which usually is not
much more than 0.5-0.75 m.
Attributes of peat
It is possible to define peat in two ways. The first, and most
common, is to define peat as a substance derived from
peatiands and/or mires that is composed of the partially
decomposed remains of plants with over 65 percent organic
matter (dry weight basis) and less than 20-35 percent
inorganic content (Clymo, 1983; Heathwaite etal. 1993). It is
also possible to define peat in its intact or natural state (i.e., in
the mire or peat land) as 88-97 percent water, 2-10 percent
dry matter and 1 percent to 7 percent gas (Heathwaite etal..
1993).
Botanical composition and state of decomposition
are generally agreed upon as the two most important
characteristics.
Botanical composition
It is the plant communities that will dictate the litter source for
the formation of the peat under them. This has led to first-
order classifications that differentiate peat into four
broad categories; moss, herbaeeous, wood and detrital or
hwnifiedpeat. Moss is often subdivided into Sphagnutn (i.e.,
Sphagnaceae—the peat mosses) and brown mosses (i.e.,
Amblystegiaceae) because both groups are common peat
formers. Sphagnum is the single most important moss genus.
Few other moss groups, except for members of the Poly-
trichaceae are important peat-formers, for example, in the
southern hemisphere (Clymo, 1983). Identification ofthe moss
remains to family and genus is often possible in the field with a
hand lens, and where preservation is good, it is possible to
identify to species level with the aid of a microscope (e.g.,
Janssens, 1983). The same is true for flower and seed parts,
leaves, stems and roots of sedge (i.e., Cyperaceae), grass (i.e.,
Poaceae) and rush (i.e., Juncaceae) remains, which are
probably, the most important groups comprising herbaceous
peats.
It is easy to differentiate, Carex, Eriophorum, Phrag-
mites, Cladium, Juncus peats, and in the case of the Andes in
South America, for example, Oxychloe peats (Earle et al.,
2003).
Woody peats are common in forested and shrub-dominated
peatiands. Wood, if there were trees or tall and dwarf shrubs,
is commonly encountered in peat. Much of it is identifiable
depending upon the state of preservation. Stumps, logs or
large branches can be sectioned and identified using standard
wood identification techniques. Seeds, nuts, samaras, strobili,
cones,
leaves, needles, buds and bud scales, and bark can also
be identified, almost certainly to family, often to genus and
even species.
The last major category refers to peat where the plant
remains are so disarticulated (i.e., detrital peat) or decomposed
(i.e.,
humified peat) that the bulk of the plant is no longer
recognizable and identifiable. Where macroscopic remains are
no longer recognizable, it is possible to use paleoecological
techniques such as pollen and spores analyzes to infer plant
origins of the peat. Other plant groups including lichens, such
as Siphula or Cladina communities in western Canada, and
algae may leave distinctive thin horizons in moss or herbac-
eous-rich peats, but not usually in accumulations of any
significance.
State of decomposition
This character, usually called the state of humifieation, is
partly assessed by the extent to which plant structure is visible,
and partly by color. Field assessment is usually made using the
H scale (Von Post and Granlund, 1926). The scale is a
subjective description by a numerical scale of 1-10 based on
the color of the water squeezed in the hand. Numerous other
more sophisticated techniques to assess density of color of
water or chemical extractants also exists (Tolonen and
Saarenmaa, 1979), but comparisons of techniques show
reasonable agreement, so the simplest H scale technique, is
the one most often used.
516
PETROPHYSICS OF SAND AND SANDSTONE
Other characteristics
Other important characteristics that can be measured to
further characterize peats are inorganic matter content,
inorganic solutes (i.e., calcium, potassium), cation exchange
capacity, microorganism activity, bulk density (dry matter
mass/volume), water content, gas content, water-retaining
capacity, proportion of fibre (i.e., as size elass), structure, heat
of combustion, color, and age (Clymo, 1983).
Occurrence and distribution of peatlands
Peatlands develop where geological stability and physiography
allow water to collect on the land surface long enough in a
growing season to support peat-forming plant commutiities. A
positive or balanced hydroperiod is, therefore, required in
order to maintain waterlogging and to sustain the peat-
forming plants and peatland.
Peatlands are cosmopolitan in distribution. About 95
percent of the worlds peatlands occur in North America, Asia
and Europe (Lappalainen, 1996). Canada has the largest area
of peatlands in the world with 1.1 x 10^km^ (Tarnocai etal.,
2000).
Most of the peat in the world lies in the Boreal and
Temperate Biomes of the northern hemisphere where geolo-
gical history, cool and moist climate and productive
plant communities have given rise to widespread peatland
formation. These are regions where water is especially
abundant, waterlogging is widespread, thus favoring peat-
forming plants and peatlands.
Barry G. Warner
Bibliography
Clymo, R.S., 1983. Peat. In Gore, A.J.P. (ed.). Mires: Swamp. Bog. Fen
and
Moor.
General
Studies. Elsevier Science, pp. 159-224.
Clymo, R.S., 1984. The limits to peat bog growth. Philosophical
Transactions
of the Royal Society of London, Series B, 303: 605-654.
Earle, L.R., Warner, B.G., and Aravena, R.,
2003.
Rapid development
of an unusual peat-accumulating ecosystem in the Chilean
Altiplano. Quaternary Research (In press).
Fuehsman, C.H., 1980. Peat: Industrial Chemistry and Technology.
Academic Press.
Gorham, E., 1953. Some early ideas concerning the nature, origin and
development of peat lands. Journalof Ecology, 41: 257-274.
Heathwaite, A.L., Gottlich, K., Burmeister, E.G., Kaule, G., and
Grospietsch, Th., 1993. Mires: definitions and form. In
A.L. Heathwaite (ed.). Mires: Process, Exploitation and Conserva-
tion.
J. Wiley and Sons, pp. 1-75.
Ingram, H.A.P., 1978. Soil layers in mires: function and terminology.
Journal of Soil Science, 29: 224-227.
Janssens, J.A., 1983. A quantitative method for stratigraphical analysis
of bryophytes in Holocene peat. Journal of Ecology, 71: 189-196.
Lappalainen, E., 1996. General review on world peatland and peat
resources. In Lappalainen, E. (ed.). Global Peat Resources.
Geological Survey of Finland, pp. 53-56.
Overbeck, F., 1975. Botanisch-Geologische Moorkunde. Neumunster:
Waehholtz.
Tarnocai, C, Kettles, I.M., and Lacelle, B., 2000. Peatlands of Canada.
Geological Survey of Canada, Open File Report 3834.
Tolonen, K., and Saarenmaa, L., 1979. The relationship of bulk
density to three different measures of the degree of peat
humifieation. Proceedings. International Symposium On Classifica-
tion of Peat and Peatlands. Hyytiala, Finland: International Peat
Society, pp. 227-238.
Vardy, S.R., and Warner, B.G., 2002. Holocene ecosystem variability
of polygon fens in central Nunavut, Canada. Canadian Journal of
Earth Sciences.
Von Bulow, K., 1929. Ailgemeine Moorgeologie. Berlin: Verlag von
Gebriider Borntraeger.
Von Post, L., and Granlund, E., 1926. Sodre Sveriges torvtillgangar I.
Sveriges
Geologische
Undersolgelse, C335:
1-127.
Cross-references
Humic Substances in Sediments
Kerogen
Maturation, Organic
PETROPHYSICS OF SAND AND SANDSTONE
Introduction
Porosity in sand is the only component that forms during the
sedimentation process. During most of its existence porosity
does not represent a simple void but the presence of a fluid or
gas.
Many of the physical properties of sand and sandstone
(hereafter referred to as "sandstone") are functions of the
details of the porous part of sandstone. Porosity differs from
other eonstituents of sandstone in that it forms a physieally
continuous three-dimensional web-like complex. The intimate
properties of this complex strongly affect such properties as
permeability (Ehrlich et al., 1991b) and fracture toughness
(Ferm etal., 1990).
Models for porous microstructure prior to
image analysis
For most of the 20th Century sandstone porosity was the
domain of physicists and engineers. They deduced structure
consistent with physical measurements, especially permeabil-
ity. Darcy's permeability carries with it no intrinsic informa-
tion concerning the microstructure. Darcy's Law relates flow
(caused by a differential between input and outlet pressure) in
a cylinder containing a porous medium to the geometry of the
cylinder. Taking the geometry into account, the rate of flow
through each cylinder is proportional to the difference between
input and output pressures. However the constant of
proportionality (commonly called the "permeability") varies
from sample to sample. Permeability thus involves the nature
of the porous medium. However an infinite number of
significantly different porous microstructures can yield the
same value of permeability. Permeability would reach a
maximum if the cylinder were simply an empty tube. Hence
one way to form a geometric model of the microstructure is to
assume a homogeneous (or "homogeneously heterogeneous")
medium where the micro flow paths are longer than the length
of the sample cylinder; that the flow "sees" a greater length
than the length of the sample cylinder. This added length was
postulated to be due to the tortuous flow paths through the
medium. Although the concept of "tortuosity" was very
effectively demolished by Scheidegger, (1974) on theoretical
grounds, and by Ehrlich etal. (1991b) on empirical (quanti-
tative petrographic) grounds, the concept of tortuosity is very
popular with probabilistic modelers (Dullien, 1979). As
discussed below, the permeability (holding grain size constant)
is due to the presence of hyper efficient flow paths along
packing flaws.
PETROPHYSICS OF SAND AND SANDSTONE
517
Pores and pore throats
The porosity complex consists of two major parts: pores and
pore throats (Berg, 1975; Dullien, 1979). Pores account for all
of the volume of porosity and tend to occupy the interstices
between grains thus providing a cuspate shape bearing concave
facets each representing the boundary between a pore and an
adjacent sand grain. Adjacent pores communicate at the cusps,
the cross sectional area of minimum volume of a plane cutting
through a cusp is termed a "pore throat" (Scheidegger, 1974).
Pore throats, then, are the bottlenecks that affect transmissiv-
ity of fluids, pressures, diffusion, and other transport proper-
ties.
Pore throats are important mediators of the rate of
diagenesis (Prince and Ehrlich, 2000) and are extremely
important in hydrocarbon reservoirs. Pores, on the other
hand, represent the capacity of the sandstone but are seldom
important in fluid transport.
Analysis of the porous microstructure
A functional description of sandstone porosity should produce
output that consistent with subjecdve porosity classification
but also quantitadve and precise in order to describe physical
properties that are continuous variables. This calls for the
application of digital data acquisition and an image processing
capability. Such capabilities only became commonly available
after 1975, so the preexisting subjective classification (inter-
granular pore, intra-granular pores and moldic pores) was
really most valuable in tracking diagenetic processes than
relating thin section data to physical response.
Imaging
Commonly sandstones are studied by imaging a planar section
via a light microscope, a scanning electron microscope or an
electron luminescenee apparatus. The plane of section interacts
with the three-dimensional sample by (given simple assump-
tions) such that the ratio of the total area of each constituent
to the others approximates the volume of the ratios of the
components.
Pore types and throat sizes
Information concerning the size and shape of grains or pores is
hazy in that the plane of section can penetrate a grain
anywhere between the "equator" and the "pole" such that a
wide size range of two-dimensional representatives represents
each grain size class. Pore throats are seldom encountered by
the plane of section as shown by the abundance of "isolated"
intergranular pores in most sandstones, (the pore throat lying
above or below the plane of section). Even when throats are
encountered, their true size is impossible for estimate from
section. Accordingly additional ways to observe sandstone
must be used to supplement two-dimensional images. These
include permeameters, mercury injection apparatus, and
measurement of electrical properties of saturated media (Etris
et al., 1989; Ehrlich et al., I991a,b). By building a model
consistent with all of these, we can deduce the values of the
critical parameters that control the porous complex.
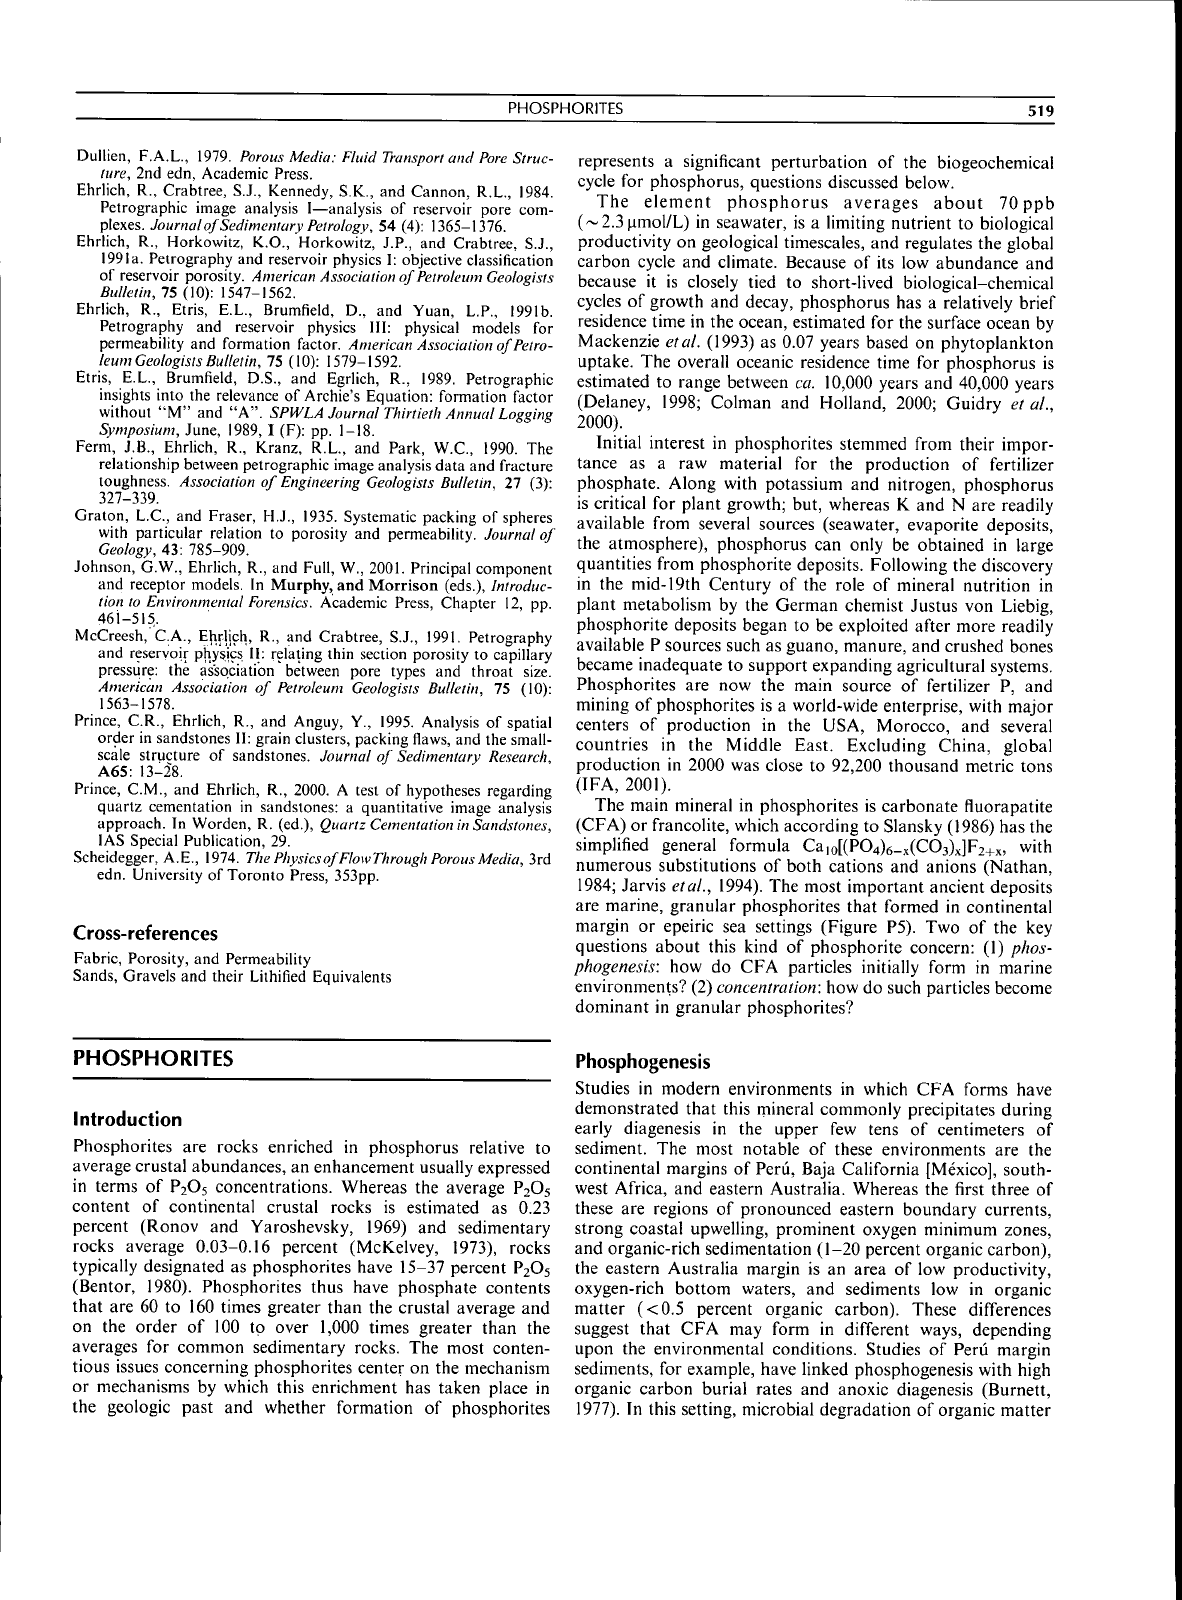
Petrographic image analysis
"Petrographic Image Analysis" ("PIA") (Ehrlich etal., 1984,
1991a,b) is a generic term associated with the move from
subjective totally visual microscopic analysis to acquisition
and processing of digital imagery. Areas containing the entire
plane of section can be imaged and the collection of image may
form a seamless mosaic before the porous complex is analyzed.
Having stated that only throats direct influence on transport
properties, one might infer that analysis of pores in section
would be fruitless. For instance the relationship between
porosity and permeability is commonly very weak. However it
can be demonstrated that there is a strong correlation between
pore type and throat size (McCreesh etal., 1991b). For this to
occur and be relevant to transport properties, some types of
pores must form condnuous networks that are relatively
efficient with respect to transport. Quantitative determination
of pore types can only be aecomplished by deducing the three
dimensional sizes and shapes of pores from their two
dimensional seetions. We define the porosity objects exposed
in section
as
porels
(Porosity
Elements) (Ehrlich etal., 1991a). A
porel is defined as a patch of porosity that is internally
continuous with all of its parts. In a loose packed sand for
instance, the porosity may represent a lacelike filigree in
section and so the image might contain only two or three really
extensive porels. As porosity declines as a consequence of
diagenesis, porels systematically evolve into small isolated
patches of porosity when viewed in section. One form of PIA
involves the use of a variant of a common image analysis
algorithm termed "erosion/diladon differencing" (Ehrlich
elal., 1991a) that produces porosity size and shape spectra
that can be analyzed by a spectral unmixing algorithm,
Polytopic Vector Analysis, an offshoot of factor analysis,
(Johnson etal., 2001) into an objective classification of pore
types,
including their sizes, shape, and volumetric proportions.
This provides a link to earlier subjective pore type classifica-
tions as well as to physics. The output of this procedure can be
related to the physical measurements on order to construct a
plausible three-dimensional model of the porosity consistent
with all methods of measurement.
Mercury injection—determination of throat size
Mercury injection porosimetry is the prime physical test,
followed by permeability (Ehrlich etal., 1991b) and electrical
conducdvity / resistivity (Etris etal., 1989). Mercury injection
involves placing a sample (commonly a core plug about 2 cm in
diameter) into a sealed pressure vessel connected to a supply of
mercury. Mercury is a strongly nonwetting phase and will not
imbibe into the sample spontaneously. Pressure is progres-
sively increased until mercury is forced into the sample. At the
lowest pressure of injecdon only a fraction of the porosity is
invade. The relationship between injected volume and pressure
is recorded. The volume of porosity invaded in a pressure
increment represents the amount of porosity that can be
accessed by pore throats of a given size range through the
Laplace equation (Scheidegger, 1974; Dullien, 1979). Thus
mercury porosimetry earries strong throat size information
and poor pore type information, the inverse of imaging in that
regard. At a high enough pressure, almost all porosity is filled
except for isolated inclusions within grains. The injection data
can be precisely related to the pore type information obtained
by image analysis via multiple regression with care taken that
the imagery is taken from a section at the end of a sample
cylinder before injection. The results consistently show a
strong relationship between pore type and throat size
(McCreesh etal., 1991). For this to occur pores of like type
518
PETROPHYSICS OF SAND AND SANDSTONE
must be mutually connected into circuits characterized by a
common size range.
Relationship between microstrucure and physics
The results of this combination of image analysis and mercury
injection data are sufficient to successfully estimate perme-
ability and electrical properties such as conductivity of the
sample when saturated with fluids.
Microcircuits and packing flaws
The concept of hyper efficient microcircuits (those associated
with the largest throats) dominating transport was directly
verified by another image analytical procedure involving
analysis of the Fourier transform of the binary image
(porosity 1.0, matrix 0.0) (Prince etal., 1995). Filtering the
transform produces images where the circuits are prominently
displayed. The Fourier transform is exactly equivalent to an
X-ray diffraction pattern and so the numerical tools used in
the analysis are much the same. Both the optical transform
of sandstones and the X-ray transforms of crystals, share
common characteristics in tfiat in neither are the particle/
atoms perfectly arrayed. Instead packing flaws separate closely
packed domains. Graton and Fraser (1935) demonstrated via a
series of experiments with monolayers of equal size spheres the
nature of the flaws and their inevitability just about the same
dme as crystal chemists were using bead packs to illustrate
packing flaws in ionic crystals. Unfortunately the work of
Graton and Fraser has largely been ignored due to its prolixity
and length.
Origin of packing flaws: the Graton and Fraser model
According to Graton and Fraser (1935) the packing flaws are a
consequence of sedimentadon. A depositional episode com-
monly occurs as the sedimentation of a collection of suspended
grains that accumulate in a layer that is many grains thick
under the influence of gravity. Closest packing is the
arrangement of lowest potential energy and so nearby grains
tend to cluster in this fashion. Such clusters form sponta-
neously throughout the sedimenting mass but there is no
proeess that will force the clusters into a common orientadon.
As the accreting closely packed clusters grow, the eventually
interfere with one another producing bounding compromise
zone (packing flaws) characterized by large pores connected by
large throats—the permeability circuits. In theory and
observadon, once generated, packing flaws propagate without
limit, ending only when intersecting another set of flaws. This
provides the continuity that ensures agreement between two-
dimensional images and the volumetrically based physical
measurements such as mercury injection porosimetry.
Graton and Fraser (1935) also came up with the basis of a
natural history of packing flaws. As mentioned above, sand is
commonly deposited episodically producing a sand accumula-
tion consisting of a large number of sand on sand beds. The
trivial unconformities defined by bed boundaries represents a
sand water interface of reladvely long duration resuldng in a
sort of annealing (densification) of the sand exposed to the
moving water. The impulse of the next episode of sedimenta-
tion results in a major oriented mismatch between that
interface and the newly deposited sand. Thus packing flaws
are more densely spaced just above bedding planes. Outcrop
observation verifies that many outcrops "weep" from a small
interval (few cm thick) from the base of an overlying bed. As
discussed below, this effect is also observed in pardally oil-
saturated core, where the dark oil decorates the bases of beds
and may be absent in the middle and upper parts of a bed.
Multiphase flow
The porous microstructure is critically important in the case of
multiphase flow such as oil and water. In this case two
mutually immiscible fluids are competing for the pore space.
Commonly but not always water is a "wetting" phase and so
can spontaneously imbibe into the sandstone via capillary
forces (Berg, 1975). Oil is commonly a "nonwetting" phase
and must be forced into the sandstone by pressure just as
mercury (another extremely nonwetting phase) is forced into a
sandstone sample. Thus water will tend to segregate and be
held in parts of microporosity containing small throats and the
nonwetdng phase will initially be forced into the porous
circuits connected by the largest throats. The wetting phase
will also coat all mineral surfaces and so be somewhat of a thin
barrier between the oil and the pore walls. "Relative
permeability" tests measure the degree of mobility of either
phase as a function of saturation. Such are in agreement with
the microstructural model described above (Prince and
Ehrlich, 2000). The nonwetting phase is loosely held in pores
with large throats (packing flaws) and the wetting phase is
tightly held in pore complexes connected by small throats.
Presumably water completely fills the pores of sandstone
before migration of petroleum. The buoyant force of the oil
column provides the pressure needed for to displace this initial
water with oil. The longer the oil column, the greater the
pressure gradient from the oil water content to the seal (Berg,
1975).
Thus oil near the top of a reservoir displaces more water
than rock near the oil water contact. However changes in grain
size (which also affects throat sizes) as well as disordered zones
near bed boundaries will ensure various values of water
saturation for a given height above the oil water contact.
Summary and conclusions
The petrography of sandstones and other porous media can
best be determined by a combination of image analysis and
physical measurement. The two dimensional information
taken from plane of thin section can be turned into a three
dimensional microstructural complex by convolving that data
with physical properdes that arise from the three dimensional
volume. The common availability of high quality relatively
inexpensive digital image capability along with a wealth of
image processing algorithms allow such analysis to be under-
taken at almost any level. The nuances gained have shown
their worth in the petroleum industry and also as a way to
quantify the nature and extent of diagenesis. This field is still
very young and many opportunities exist for new findings. A
caveat is that the practitioner must have intermediate-level
competence in muldvariate analysis.
Robert Ehrlich
Bibliography
Berg, R.R., 1975. Capillary pressures in stratigraphic traps. American
As.sociation
of Petroleum
Geologists
Bulletin, 59
(6):
939-956.
PHOSPHORITES
519
Dullien, F.A.L., 1979. Porous Media: Fhdd Transport and
Pore
Struc-
ture, 2nd edn, Academie Press.
Ehrlieh, R., Crabtree, S.J., Kennedy, S.K., and Cannon, R.L., 1984.
Petrographic image analysis I—analysis of reservoir pore com-
plexes. Journal of Sedimentary Petrology, 54 (4): 1365-1376.
Ehrlich, R., Horkowitz, K.O., Horkowitz, J.P., and Crabtree, S.J.,
1991a. Petrography and reservoir physies 1: objective elassification
of reservoir porosity. American Association of Petroleum Geologists
Bulletin, 75 (10): 1547-1562.
Ehrlich, R., Etris, E.L., Brumfield, D., and Yuan, L.P., 1991b.
Petrography and reservoir physies III: physical models for
permeability and formation factor. American Association of
Petro-
leum Geologists Bulletin, 75 (10): 1579-1592.
Etris,
E.L., Brumfield, D.S., and Egrlich, R., 1989. Petrographic
insights into the relevance of Archie's Equation: formation factor
without "M" and "A". SPWLA Journal Thirtieth Annual Logging
Symposium, June, 1989, I (F): pp. 1-18.
Ferm, J.B., Ehrlich, R., Kranz, R.L., and Park, W.C., 1990. The
relationship between petrographie image analysis data and fracture
toughness. Association of Engineering Geologists Bulletin, 27 (3):
327-339.
Graton, L.C., and Fraser, H.J., 1935. Systematic packing of spheres
with particular relation to porosity and permeability. Journal of
Geology, 43: 785-909.
Johnson, G.W., Ehrlich, R., and Full, W., 2001. Prineipal component
and receptor models. In Murphy, and Morrison (eds.). Introduc-
tion to Environmental
Eorensics.
Academic Press, Chapter 12 pp
46i-51fi.
MeCreesh, C.A., Ehrlich, R., and Crabtree, S.J., 1991. Petrography
and reservoir physics II: relating thin section porosity to capillary
pressure: the association between pore types and throat size.
American Association of Petroleum Geologists Bulletin, 75 (10)-
1563-1578.
Prince, C.R., Ehrlich, R., and Anguy, Y., 1995. Analysis of spatial
order in sandstones II: grain clusters, packing flaws, and the small-
scale structure of sandstones. Journal of Sedimentary Research,
A65:
13-2^8.
Prince, CM., and Ehriich, R., 2000. A test of hypotheses regarding
quartz cementation in sandstones: a quantitative image analysis
approach. In Worden, R. (ed.). Quartz Cementation in Sandstones,
IAS Special Publication, 29.
Seheidegger, A.E., 1974. The Physics of FlowThrough
Porous
Media, 3rd
edn. University of Toronto Press, 353pp.
Cross-references
Fabric, Porosity, and Permeability
Sands, Gravels and their Lithifled Equivalents
PHOSPHORITES
Introduction
Phosphorites are rocks enriched in phosphorus relative to
average erustal abundances, an enhancement usually expressed
in terms of P2O5 concentrations. Whereas the average P2O5
content of condnental crustal rocks is esdmated as 0.23
percent (Ronov and Yaroshevsky, 1969) and sedimentary
rocks average 0.03-0.16 percent (McKelvey, 1973), rocks
typically designated as phosphorites have 15-37 percent P2O5
(Bentor, 1980). Phosphorites thus have phosphate contents
that are 60 to 160 times greater than the crustal average and
on the order of 100 to over 1,000 times greater than the
averages for common sedimentary rocks. The most conten-
tious issues concerning phosphorites center on the mechanism
or mechanisms by which this enrichment has taken place in
the geologic past and whether formation of phosphorites
represents a significant perturbation of the biogeochemical
cycle for phosphorus, questions discussed below.
The element phosphorus averages about 70 ppb
(~ 2.3 umol/L) in seawater, is a limiting nutrient to biological
productivity on geological dmescales, and regulates the global
carbon cycle and climate. Because of its low abundance and
because it is closely tied to short-lived biological-chemical
cycles of growth and decay, phosphorus has a relatively brief
residence time in the ocean, estimated for the surface ocean by
Mackenzie etal. (1993) as 0.07 years based on phytoplankton
uptake. The overall oceanic residence time for phosphorus is
estimated to range between ca. 10,000 years and 40,000 years
(Delaney, 1998; Colman and Holland, 2000; Guidry et al.,
2000).
Initial interest in phosphorites stemmed from their impor-
tance as a raw material for the production of fertilizer
phosphate. Along with potassium and nitrogen, phosphorus
is critical for plant growth; but, whereas K and N are readily
available from several sources (seawater, evaporite deposits,
the atmosphere), phosphorus can only be obtained in large
quantities from phosphorite deposits. Following the discovery
in the mid-19th Century of the role of mineral nutrition in
plant metabolism by the German chemist Justus von Liebig,
phosphorite deposits began to be exploited after more readily
available P sources such as guano, manure, and crushed bones
became inadequate to support expanding agricultural systems.
Phosphorites are now the main source of fertilizer P, and
mining of phosphorites is a world-wide enterprise, with major
eenters of production in the USA, Morocco, and several
countries in the Middle East. Excluding China, global
production in 2000 was close to 92,200 thousand metric tons
(IFA, 2001).
The main mineral in phosphorites is carbonate fluorapatite
(CFA) or francolite, which according to Slansky (1986) has the
simplified general formula Caio[(P04)6_x(C03)JF2+x, with
numerous substitutions of both cations and anions (Nathan,
1984;
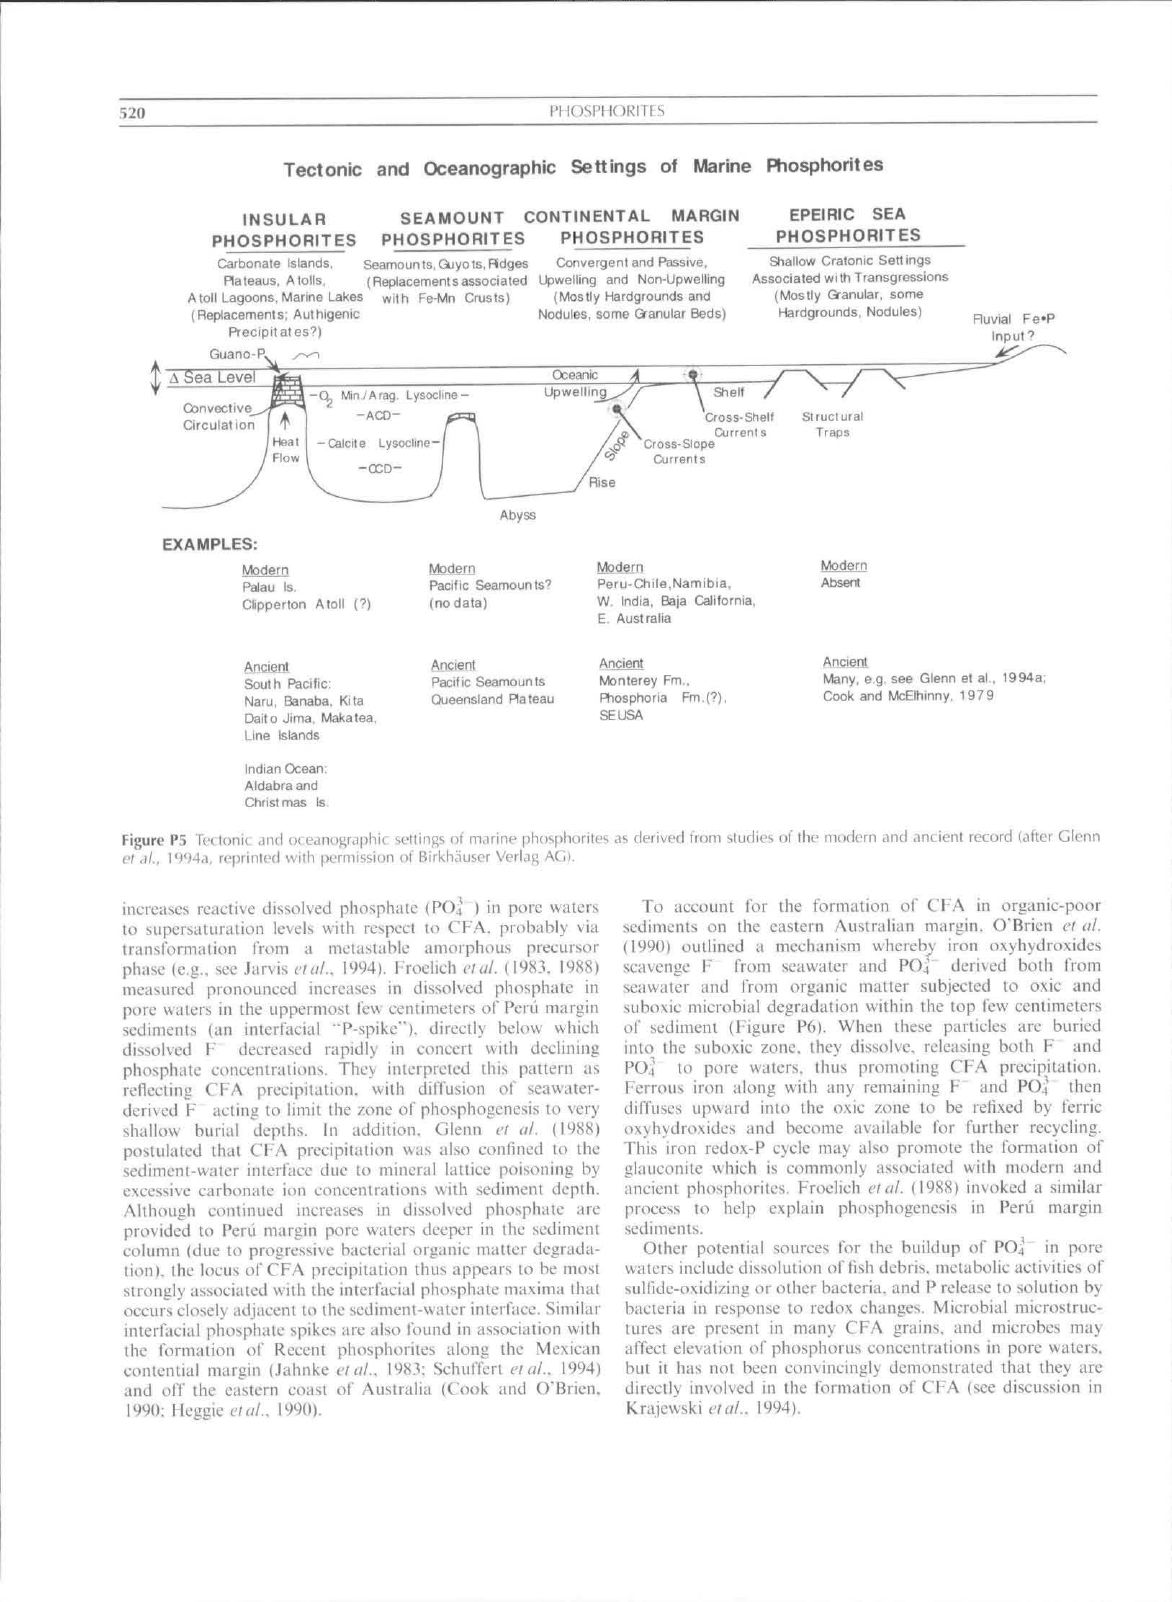
Jarvis etal., 1994). The most important ancient deposits
are marine, granular phosphorites that formed in continental
margin or epeiric sea settings (Figure P5). Two of the key
questions about this kind of phosphorite concern: (1) phos-
phogenesis: how do CFA particles initially form in marine
environments? (2) concentration: how do such particles become
dominant in granular phosphorites?
Phosphogenesis
Studies in modern environments in which CFA forms have
demonstrated that this rnineral commonly precipitates during
early diagenesis in the upper few tens of centimeters of
sediment. The most notable of these environments are the
continental margins of Peru, Baja California [Mexico], south-
west Africa, and eastern Australia. Whereas the first three of
these are regions of pronounced eastern boundary currents,
strong coastal upwelling, prominent oxygen minimum zones,
and organic-rich sedimentation (1-20 percent organic carbon),
the eastern Australia margin is an area of low productivity,
oxygen-rich bottom waters, and sediments low in organic
matter (<0.5 percent organic carbon). These differences
suggest that CFA may form in different ways, depending
upon the environmental conditions. Studies of Peru margin
sediments, for example, have linked phosphogenesis with high
organic carbon burial rates and anoxie diagenesis (Burnett,
1977).
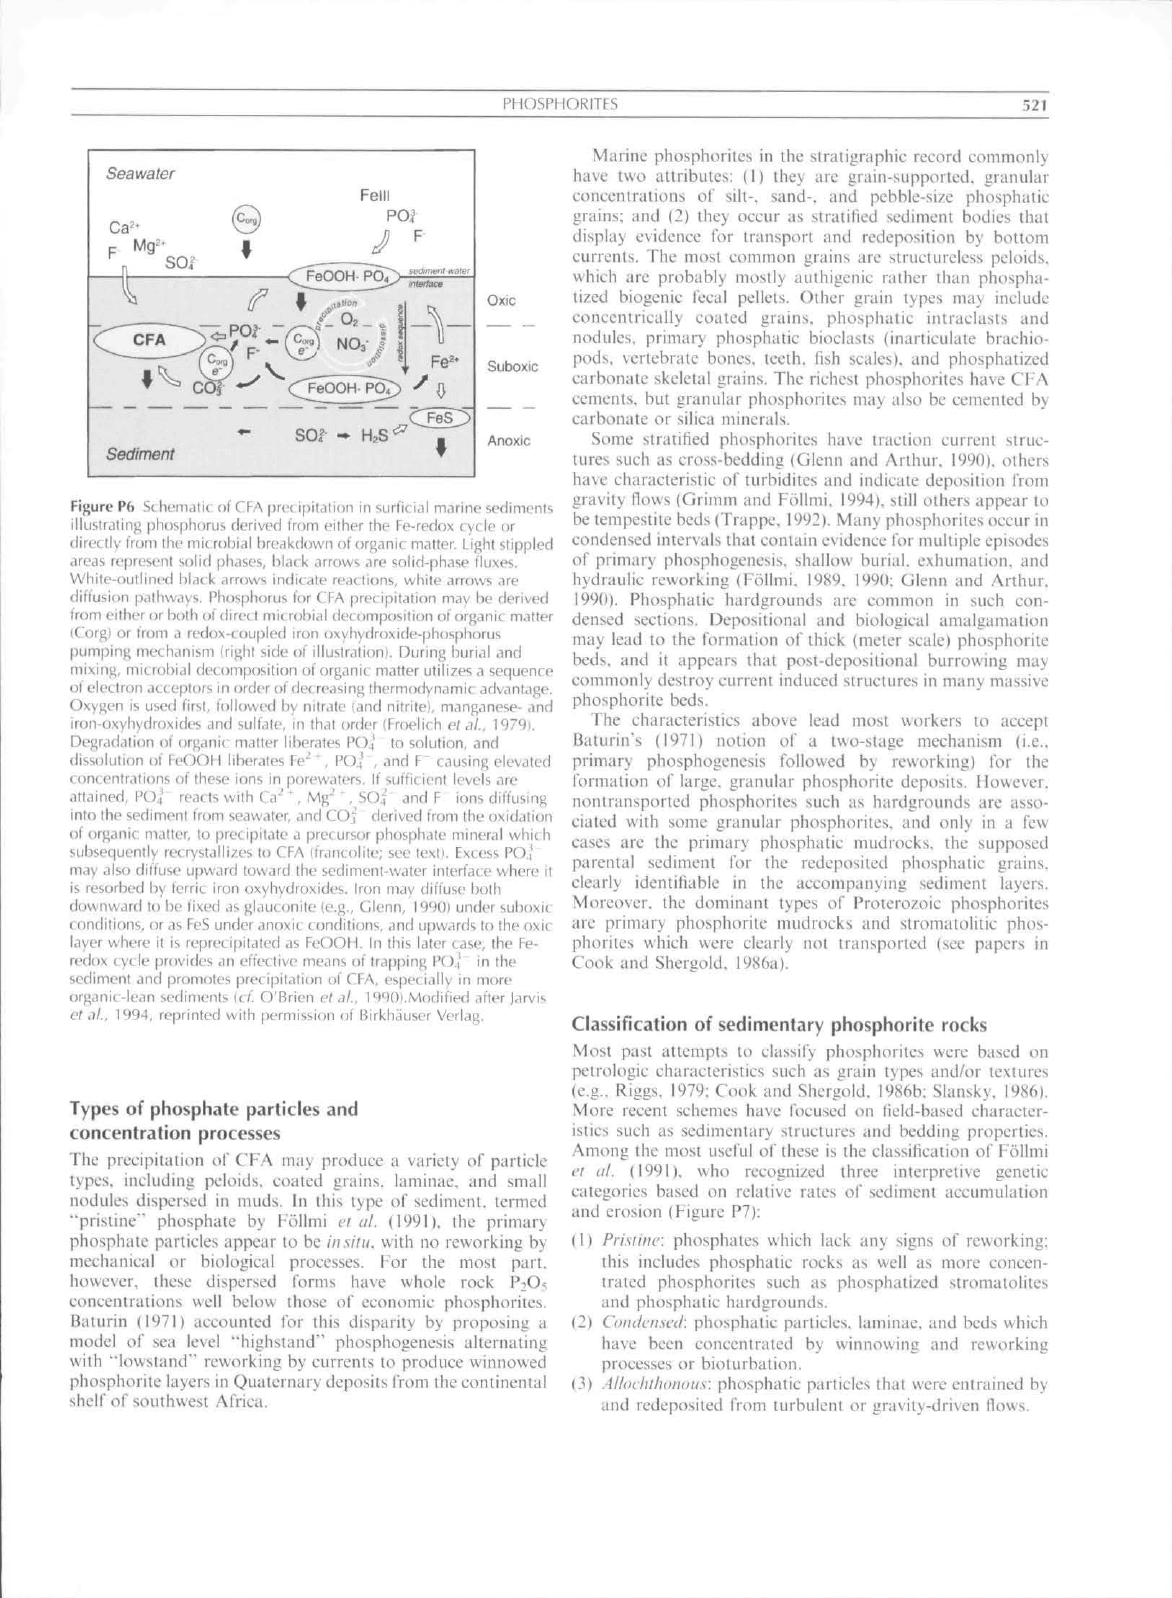
In this setting, microbial degradation of organic matter
520
PHOSPHORITES
Tectonic
and
Oceanographic Settings
of
Marine Phosphorites
INSULAR
PHOSPHORITES
SEAMOUNT CONTINENTAL MARGIN
PHOSPHORITES PHOSPHORITES
Carbonate Islands, Seamounts.Qjyots,Pldges Convergent and Passive,
Rateaus, Atolls, (Replacementsassociated Upwelling
and
Non-Upwelling
Atoll Lagoons, Marine Lakes with Fe-Mn Crusts) (Mostly Hardgrounds
and
(Repiacemenls; Authigenic Nodules, some Granular Beds)
Precipitates?)
Guano-P.
EPEIRIC
SEA
PHOSPHORITES
Shallow Cratonic Settings
Associated with Transgressions
(Mostly Granular, some
Hardgrounds, Nodules)
Ruvial
Fe-P
Input?
Oceanic
-CL Min./Arag, Lysocline-
-ACD-
Upwelling Shell
Cross-Shelf
Currents
Cross-Slope
Currents
Structural
Traps
Rise
Abyss
EXAMPLES:
Modern
Palau
Is.
Oipperton Atoll
(?)
Ancieni
South Pacific:
Naru,
Banaba, Kita
Daito Jima, Makatea,
Line Islands
Indian Ocean:
Aldabraand
yofilern
Pacific Seamounts''
(no data)
Ancient
Pacific Seamounts
Queensland Plateau
Modern
Peru-Chile,Namibia,
W, India, Baja California,
E Australia
Ancient
Monterey
Fm.,
Ftiosphoria Fm.(?),
SEUSA
Modern
Absent
Ancient
Many, e.g. see Glenn
et
al., 1994a
Cook
and
McElhinny,
1979
Figure P5 Teclonit: .^ncl occLinographic settings
of
marine phosphorites as derived frnm studies
of ihc
modern .ind ancient record (after Cienn
et«)/.,
1994a. reprinted with permission
ot
Birl<h<iuser Veriag AGl.
increases reactive dissoived phosphiite (PO4
) in
pore waters
to supersaturation levels with respect
to CFA.
probably
via
transformation from
a
metastable amorphous precursor
phase (e.g..
see
Jarvis
elaf.
1994). FrocHch elaf (19S3.
1988)
measured pronounced increases
in
dissolved phosphate
in
pore waters
in the
uppermost
few
centimeters
of
Perii margin
sediments
(an
interfacial '"P-spike*"), directly below which
dissolved
F
decreased rapidly
in
concert with declining
phosphate eoticentrations. They interpreted this pattern
as
reflecting
CFA
precipilation. with diffusion
of
seawater-
derived
F
acting
to
limit
the /one of
phosphogenesis
to
very
shallow burial depths.
In
addition, Glenn
et af
(1988)
postulated that
CFA
precipitation
was
also confined
to the
sediment-water interface
due to
mineral lattice poisoning
by
excessive carbonate
ion
concentrations with sediment depth.
Although continued increases
in
dissolved phosphate
are
provided
to
Perii margin pore waters deeper
in the
seditnent
column
(due to
progressive bacterial organic matter degrada-
tion),
the
locus
of
CFA precipitation thus appears
to be
mosl
strongly associated with the interfaeial phosphate maxima that
occurs closely adjacent
to
the seditnent-watcr interlace. Similar
interfaeial phosphate spikes
arc
also found
in
association with
the formation
of
Recent phosphorites along
the
Mexican
contential margin (Jahnke
etaf.
1983; Schuffert
elaf. 1994)
and
olT the
eastern coast
of
Australia (Cook
and
O'Brien,
1990:
HeggiciVi//,. 1990).
To account
for the
fortnation
of CFA in
organic-poor
sediments
on the
eastern Australian margin. O'Brien
et af
(1990) outlined
a
mechanism whereby iron oxyhydroxides
seavenge
F
from seawater
and PO4
derived both from
seawaler
and
from organie matter subjected
to
oxic
and
suboxic microbiai degradation within
the top few
centimeters
of sediment (Figure
P6).
When these particles
are
buried
into
the
suboxic zone, they dissolve, releasing both
F and
PO4
to
pore waters, thus promoting
CFA
precipitation.
Ferrous iron along with
any
retnaining
F and POJ
Ihen
diffuses upward into
the
oxic zone
to be
refixed
by
ferric
oxyhydroxides
and
become available
for
further recycling.
This iron redox-P cycle tnay also promote
the
formation
of
glauconite which
is
commonly associated with modern
and
ancient phosphorites. Froeiich etaf (1988) invoked
a
similar
process
to
help explain phosphogenesis
in
Perii margin
sediments.
Other potential sources
for the
buildup
of
PO.;"
in
pore
waters include dissolution offish debris, metabolic activities
of
suifidc-oxidizing
or
other bacteria,
and P
release
to
solution
by
bacteria
in
response
to
redox ehanges. Microbiai microstruc-
Uires
are
present
in
many
CFA
grains,
and
tnicrobcs
may
affect elevation
of
phosphorus concentrations
in
pore waters,
but
it has not
been convincingly demonstrated that they
are
directly involved
in the
formation
of
CFA
(see
discussion
in
Krajcwski
etaf.
1994),
PHC;)SPHORITFS
521
Seawater
SOI-
-*•
HS
Sediment
Oxic
Suboxic
Anoxic
Figure Pfa St hfm.itu nt
(.
\-A
prctifjiLiliun in surlit iai marine sediments
illuslrjiing phtisphorus derived trom either the Fe-redox cycle or
directly from the microbial breakdown ot Organic matter. Light stippled
areas represent solid phases, bLick arrows are solid-phase fluxes.
White-outlined black arrows indicate reactions, white arrows are
diffusion pathways. Phosphorus for CFA precipitation may be derived
from either or both of direct microbial decomposition of organic matter
iCorgl or from a redox-coupled iron oxyhy(froxide-|jh()sphorus
pumping mechanism Irighl side (if illustrationi. During burial and
mixing,
microbial cJecomposition of organic matter utilises a sequence
of electron acceptors in order of decreasing thermodynamic advantage.
Oxygen is used first, followed by nitrate (and nitrite}, manganese- and
iron-oxyhydroxides and sulfate, in thai order (Froelich t'! JL,
H79I.
Degradation of organic matter liberates PO.,' (o solution, and
dissolution of TeOOH liberates Fe"^ ' , PO4 , and F" causing elevated
concentr-itions of these ions in porewaters. If sufficient levels are
attained,
POi reacts with Ca' ', Mg-' ' , SOjf and F ions diffusing
into the sediment from seawater, and COj derived from the oxidation
of organic matter, lo precipitate a precursor phosphate mineral which
subsequently recrystalli^es to CFA (francolite; see text). Fxcess PO.i
may also diffuse upward toward the sediment-water interface where it
is resorbed by ferric iron oxyhydroxides. iron m.iy diffuse both
downward to be fixed as glaueonite
(e.g.,
C^lenn, 19901 under suboxic
conditions, or as FeS under anoxic conditions, and upwards to the oxic
layer where it is reprecipilated as FeOOH. In this later case, ihe Fe-
redox cycle provides an effective means of trapping POJ" in the
sediment and promotes precipitation of CFA. especially in more
org.mic-lean sediments ici. O'Brien et dl.. 1990).Mo{Jifiefl after Jarvis
ef
.1/.,
1994, reprinted with permission of Birkhausec Verlag.
Types of phosphate particles and
concentration processes
The precipitation o\' CFA may produce a variety of particle
types,
including peioids. coated grains, laminae, and small
nodules dispersed in muds. In this type of seditnent. termed
"pristine"' phosphate by I-ollmi elal. (1991), the primary
phosphate particles appear to be
In
situ, with no reworking by
niechaiiical or biological processes. For the most part,
howe\cr, these dispersed forms h:i\e whole rock P^O^
concLMitraiions well below those of economic phosphorites.
Baturin (1971) accounted for this disparity by proposing a
tnodel of sea level "highstand" phosphogenesis altcrnuting
with "lowstand" reworking by eurrents to produee winnowed
phosphorite layers in Quaternary deposits from ihc continental
shelf of southwest Africa.
Marine phosphorites in the stratigraphic record commonly
have two attributes: (I) they are grain-supported, granular
concent rat i Otis of silt-, sand-, and pcbblc-size phosphatie
grains; and (2) they occur as stratified sediment bodies that
display evidence for tratisport atid redeposition by bottom
currents. The most common grains are structureless peioids.
which are probahly mostly authigenic rather than phospha-
tized biogenic fecal pellets. Other grain types may include
concentrieally coated grains, phosphatie intraclasts and
tiodules, primary phosphatie bioelasts (inarticulate brachio-
pods.
vertebrate boties, teeth, fish scales), atid phosphatized
carbonate skeletal grains. The richest phosphorites have CFA
cements, but granular phosphorites may also be cemented by
carbonate or silica tninerals.
Sotne stratified phosphorites have traction current struc-
tures such as cross-bedding (Glenn and Arthur. 1990). others
have characteristic of turbidites and indicate deposition from
gravity flows (Gritnm and Follmi. 1994), siiil others appear to
be tempestite beds (Trappe. 1992). Many phosphorites occur in
condensed intervals that eontain evidence for multiple episodes
of primary phosphogenesis. shallow burial, exhumation, and
hydraulic reworking (FoHmi. 1989, 1990: Glenn and Arthur.
1990).
Phosphatie hardgrounds are cotntnon in such con-
densed sections. Depositional and biological amalgamation
may lead to the formation of thick (tneter scale) phosphorite
beds,
and it appears that post-depositional burrowing may
commonly destroy current induced structures in many massive
phosphorite beds.
The characteristics above lead most workers to accept
Baturin's (1971) notion of a two-stage tnechani.sm (i.e.,
primary phosphogenesis followed by reworking) for the
formation of targe, granular phosphorite deposits. However,
nontransported phosphorites such as hardgrounds are asso-
ciated with some granular phosphorites, and only in a lew
cases are the primary phosphatie tnudrocks, the supposed
parental sediment for the redeposited phosphatie grains,
clearly identifiable in the aeeompanying seditnent layers.
Moreover, the dotninant types of Proterozoic phosphorites
are primary phosphorite tnudrocks and strotnatolitic phos-
phorites which were clearly not transported (see papers in
Cook and Shergold, 19f:i6a)"
Classification of sedimentary phosphorite rocks
Most past attempts to classify phosphorites were based on
petrologic characteristies sueh as grain types and/or textures
(e.g.. Riggs. 1979: Cook and Shergold. 1986b: Slansky. 1986).
More recent schemes have focused on field-based character-
istics such as sedimentary structures and bedding properties.
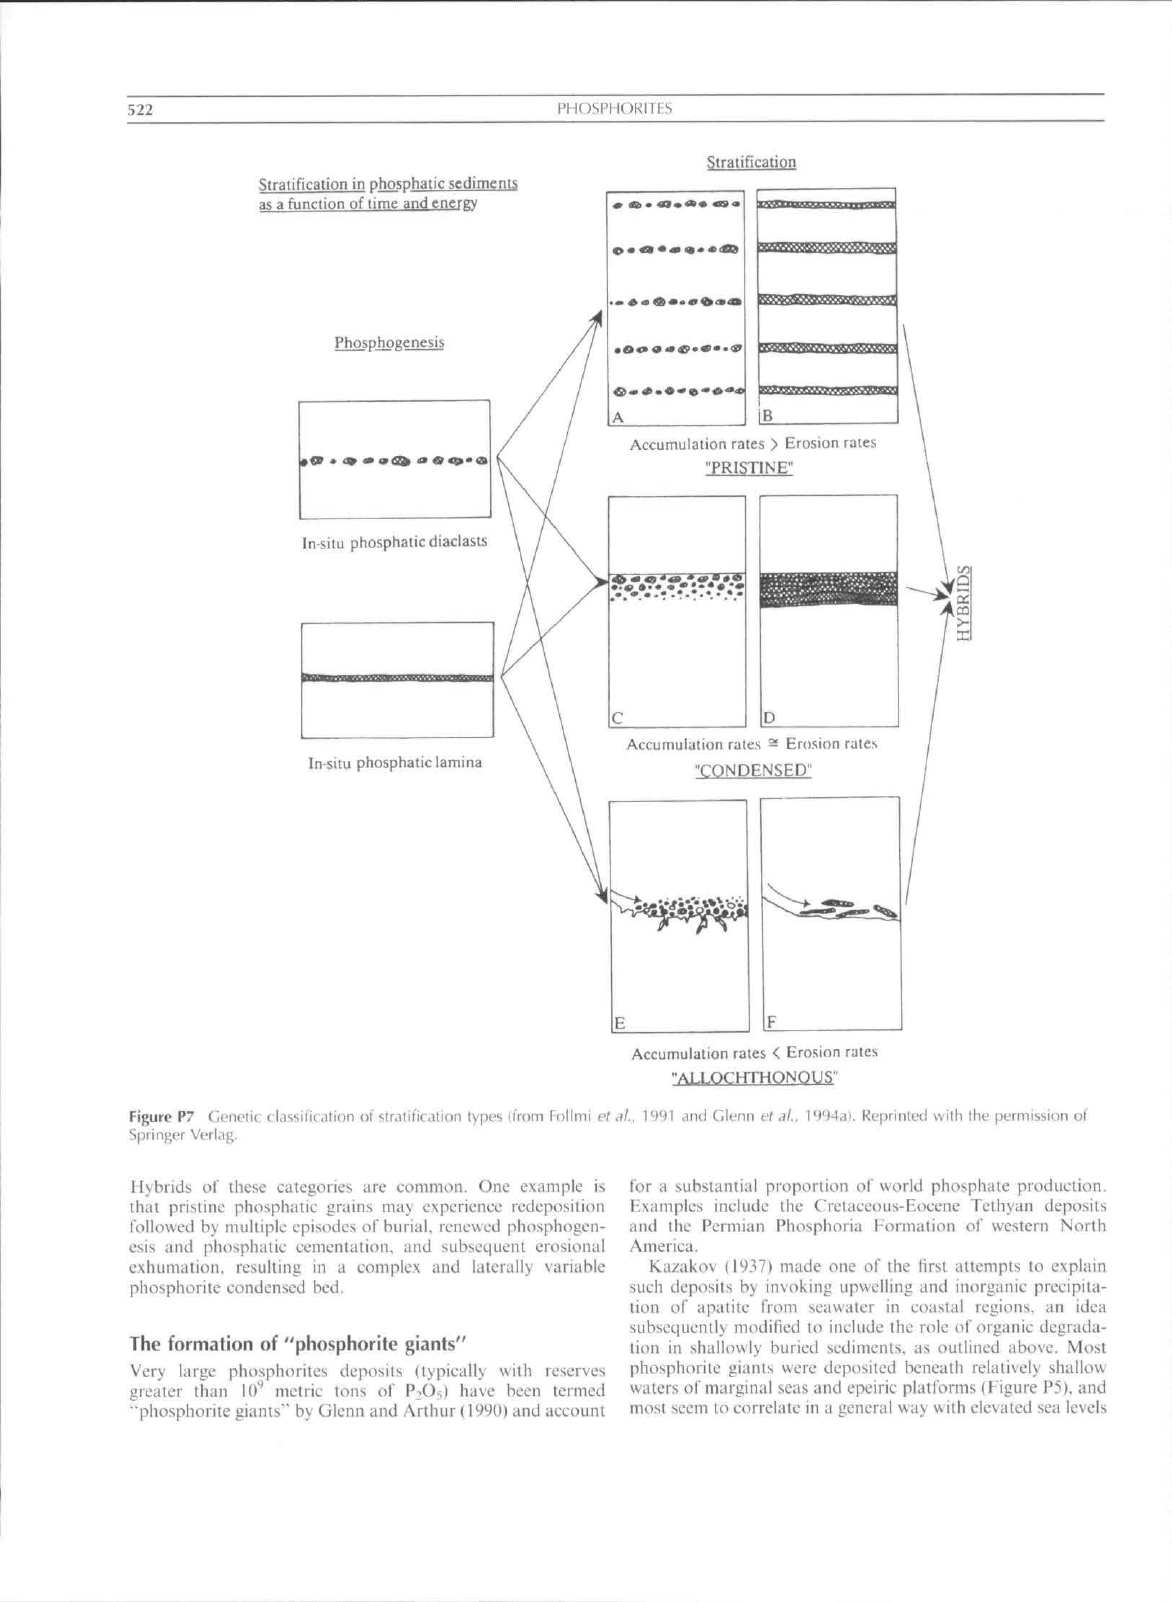
Among the most useful of these is the classifieation of Follmi
L'l
al. (1991). who recognized three interpretive genetic
categories based on relative rates of seditnent accumulation
and erosion (Figure P7):
1I) Prislinc: phosphates which lack any signs of reworking;
this includes phosphatie rocks as well as more concen-
trated phosphorites sueh as phosphati/ed stromatolites
and phosphalic hardgrounds.
(2) Coiulciiscd: phosphaiic particles, laminae, and beds which
have been concentrated by winnowing and reworking
processes or bioturbation.
(3)
.4Uochtlumou.s:
phosphatie particles that were entrained by
and redeposited from turbulent or gravity-driven flows.
522
PHOSPMORITFS
Stratification
Stratification in phosphatie sediments
as a function of time and energy
Phospjipgenesis
Insitu phosphatiediaciasts
Accumulation rates > Erosion rates
"PRISTINE"
c
D
In situ phosphatie lamina
Accumulation rales - Erosion rates
"CONDENSED''
Figure P7 Genetic classification o! stratification types (from Follmi ct
Springer Verlag.
Accumulation rales < Erosion rates
"ALLQCHTHONOUS"
.. 1991 and Glenn et ,il.. l<)94di. Reprinted with the permission of
Hybrids oi" these categories are common. One example is
that pristine phosphatie grains may experience redeposition
followed by multiple episodes of burial, renewed phosphogen-
esis and phosphatie cetnentation. and subsequent erosional
exhumation, resulting in a complex and laterally variable
phosphorite condensed bed.
The formation of "phosphorite giants"
Very large phosph{iriLes deposits (typically with reserves
greater than 10'* metric tons of P:>Oi) have been termed
"phosphorite giants'" by Glenn and Arthur (1990) and account
Ibr a substantial proportion of world phosphate production.
Examples include the Cretaceous-Eoeene Tcthyan deposits
and the Permian Phosphoria Formation oi" western North
America.
Kazakov (1937) made one of the first attetiipts to explain
such deposits by invoking upweliing and inorganic precipita-
tion o\' apatile from seawater in coastal regions, an idea
subsequently modified to include the role of organie degrada-
tion in shallowly buried sediments, as outlined above. Most
phosphorite giants were deposited beneath relatively shallow
waters of marginal seas and epeiric platfortns (Figure P5), and
most seem to correlate in a general way with elevated sea levels
PHOSPHORITES
and. more specifically, with marine transgressions. The
interrelated faetors involved may include (Glenn el al..
1994a): (1) highstands of sea level increase the potential
surface area f"or phosphorite accumulation on shelves and in
eontinental interiors: (2) highstands may also increase the
potential for upwelling inlo shelf seas: (3) seditnent starvation
and phosphogenesis may be i"avored during transgressions by
the trapping of diluting silieiclastie sediment in proxitnal parts
ofdepositional systems; (4) wave-indueed and other cross-shelf
currents may develop along flooded margins and platfortns,
thus aiding in winnowing, reworking, and concentration of
pristine CFA partieles. In addition to transgressive phases,
relative i"alls in sea level would lower wave base and may aid in
reworking and concentrating sueh particles, in the manner
proposed by Baturin (1971). The majority of phosphorite
uiaiits are o\' the condensed or allochthonous variety (Follmi
claf,
1991).
The abundanee of modern phosphorites in upwelling
regions has led many workers to postulate similar settings
for ancient phosphorites. Sheldon (1980), for example,
subdivided large phosphorites into those associated with
equatorial upwelling (e.g.. the Cretaceous Tethyan deposits)
and those associated with mid-latitude boundary currents and
trade-wind upwelling (e.g.. the Phosphoria Forniation). How-
e\er, the efficiency ol"sustained upwelling within large, shallow
epeiric seas far frotn the open ocean, the setting for many
phosphorite giants including the Tethyan deposits, has been
questioned. Alternative models include the delivery of fluvial-
borne P derived from intensively weathered eontinental
regions to epeiric platforms (Glenn and Arthur. 1990).
Episodicity of phosphorite giants and
the glohal phosphorus cycle
The distribution o\' phosphorite giants in the Phanerozoic is
episodic, with peaks in abundance in the Early Cambrian.
Ordovician. Pennian, Eate Cretaceous Eocene, and Miocene
(Cook and MeElhinny, 1979), This has been variously
explained as the consequence of favorable positions of
continental margins
yi.\(ivi.\
upwelling /ones, equable climates,
global cooling, widespread atioxia in the oceans, paleolatitude.
and other conditions. However, as noted by Glenn ct al.
(i994a). none oi' these mechanisms provides eomprehensive
explanations for all phosphorite giants, eaeh of whieh has its
own particularities.
A related question is whether phosphorite giants reeord
accelerated P withdrawal from the oeean into eontinental
tnargin and epicontinental sediments, or whether they repre-
sent a combination of unusual and localized geological
circutnstances unrelated to global controls. Sheldon (1980).
for example, postulated that the episodicify of marine
phosphorite deposition resulted from variations in global
deep-ocean circulation. A lumiber of recent studies, however,
suggest that several phosphorite giants required a net P
withdrawal rate eotnparable to that observed in modern Peril
margin sediments (t;/.' Filippelli and Delaney, 1992: Glenn elal.,
1994b: Cotnplon cial.. 2000). Thus, if phosphorite giants of
the past do indeed record episodic accelerated P withdrawal,
the present day must be included among these episodes.
The global phosphorus eycle is eomplex and poorly under-
stood. Phosphorus input to the ocean is mainly from rivers.
secondarily from eolian phosphorus particle transport. Major
oceanic sinks include organic matter, (ine-crained disseminated
authigenic CFA in deti"ital-rich continental margin sediments,
and adsorption on iron oxides formed at mid-ocean ridges and
in non-upwelling continental margin sediments (Delaney.
1998).
Due to variations in sedimentation rates, phosphorus
accumulation rates are several orders of magnitude higher in
upwelling-phosphogenic and detrital continental margin set-
tings than in open ocean sediments (Filippelli, 1997). Present
consensus holds that past variations in the phosphorus cycle
were responses to ehanges in rates of chemical weathering, sea-
level fluetuations. spreading rates of mid-ocean ridges, glacia-
tion. and oceanie circulation. Compton elal. (2000) postulated
that phosphorite giants mosf likely formed during episodes of
marine transgression that coincided with increased chemical
weathering rates and decreases in production of iron oxides at
mid-ocean ridges and. for the last 25 million years, convincing
showed that major phosphorite accumulations occurred in
near-synehronicity uith proposed periods of episodic uplift of
the Himalayan-Tibetan Plateau. Elevated sea levels shii"t
primary biological productivity to enlarged shallow water
settings where organic phosphorus is released in sediments to
form CFA. Subsequent sea level fluetuations make such
sediments susceptible to reworking, generating phosphorites.
Viewed in this manner, phosphorites may be a proxy for times
in which phosphorus input to the oceans was greater than the
sinks provided by organic carbon and iron-oxide burial.
Phosphorites, condensed sections and
sequence stratigraphy
Condensed sections or sequences represent extremely slow net
seditnentation over long periods of time. Sueh intervals have
been long recognized as characterized by the f"ollowing
features: (1) enrichment o!" well preserved fossils and fossil
fragments; (2) I'aiuial mixing, fossils from different paleonto-
logieal zones within a single bed: and (3) widespread
distribution of sediments with negligible thieknesses. In
addition, it has beeome increasingly recognized that intervals
of stratigraphie condensation are also frequently marked by
the oeeurretice of authigenie minerals, including phosphorites
and glauconites. With the advent of "sequence stratigraphy.'"
condensed seelions have taken on neu significance as an
integral component in the stratigraphie architecture ol'
sequences controlled by fluctuations in relative sea level.
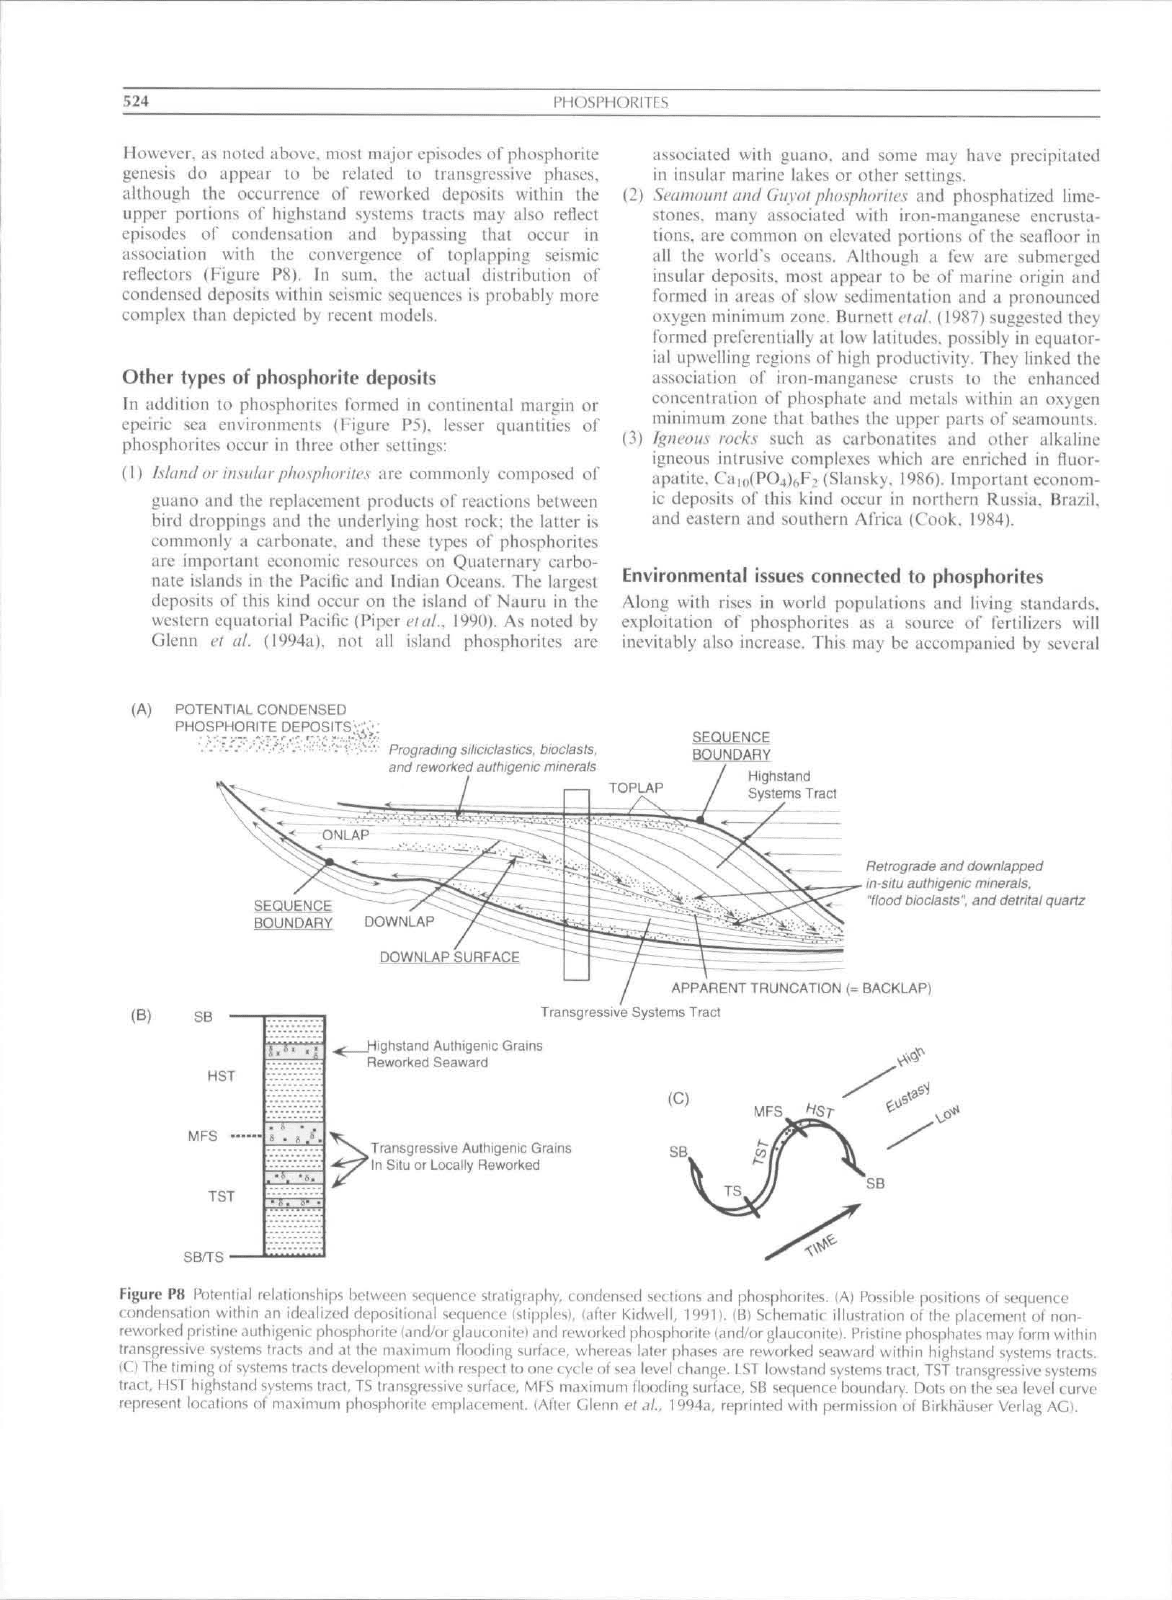
Loutit elal. (1988) and their colleagues define condensed
sections in light of sequence stratigraphy as thin marine units
of pelagic to hemipelagic seditnents thai: (I) are characterized
by very low seditnentation rates that are areally most extensive
at the titne of maximum transgression and coincident with the
surface of maximum flooding; (2) are associated with apparent
marine hiatuses; and (3) oeeur as omission surfaces or marine
hardgrounds. They result from sediment star\'ation during
times of maximum rales of sea level rise. These occur along the
break separating transgressive and highstand systems tracts
(Figure P8). Assuming that seistnic reflectors reflect time-lines,
sequence eondensalion may. hypothetically. also occur any-
where that reflectors converge such as. for example, along
surfaces of onlap. baekstepping, downlap and toplap (Kidwell.
1991:
Figure P8). In addition, while phosphorites may be
generally associated with transgressive phases ol' second and
third orders changes of sea level (5 50 and 0.5 5 Ma,
respectively), tnueh reworking of these may occur during
intervening higher orders of sea level change (forth, fifth, and
sixth orde7: (i^l 0.5. O.Oi-O.i. and <0.01Ma. respectively).
524 PHOSPHORITFS
However,
its
noted above, tiiost major episodes
of
phosphorite
genesis
do
appear
to be
related
lo
U'ansgressive phases,
although
the
occurrence
of
reworked deposits wilhin
the
upper portions
of
highsland systems tracts
may
also rellect
episodes
of
condensation
and
bypassing that occur
in
association with
the
convergence
of
loplapping seisrnic
reflectors (Figure
P8), In sum, the
actual distribution
of
condensed deposits within seismic sequences
is
probably more
complex than depicted
by
recent models.
Olher types of phosphorite deposits
In addition
to
phosphorites formed
in
continental margin
or
epeiric
sea
environments (Figure
P5).
lesser qttantities
of
phosphorites occur
in
three other settings:
(1) Island or insular
ptw.sphoriles
are
commonly composed
of
guano
and the
replacement products
of
reactions between
bird droppings
and the
underlying host rock;
the
latter
is
commonly
a
carbonate,
and
these types
of
phosphorites
are important economic resources
on
Qtiaternary carbo-
nate islands
in the
Pacilic
and
Indian Oceans,
The
largest
deposits
of
this kind occur
on the
island ol" Nauru
in the
western equatorial Pacific (Piper etal.. 1990),
As
noted
by
Glenn
et at.
(1994a),
not all
island phosphorites
are
associated with guano,
and
some
may
have precipitated
in insular marine lakes
or
other settings.
(2) Seamouni
and
Gttyot
pho.sphoriie.s
and
phosphatized lime-
stones, many associated with iron-manganese encrusta-
tions,
are
common
on
elevated portions
of
the seafloor
in
all
the
world's oeeans. Although
a few are
submerged
insular deposits, most appear
to be of
marine origin
and
formed
in
areas
of
slow seditnenlation
and a
pronounced
oxygen minimutn zone, Burnett etal. (1987) suggested they
formed preferentially
at low
latitudes, possibly
in
equator-
ial upwelling regions
of
high productivity. They linked
the
assoeiation
of
iron-manganese crusts
to the
enhanced
concentration
of
phosphate
and
metals wilhin
an
oxygen
minitrtutn zone that bathes
the
upper parts
of
seamounts,
(3) Igneous rock.s such
as
carbonatites
and
other alkaline
igneous intrusive complexes which
are
enriched
in
fluor-
apatite. Caiii(PO4)f,F2 (Slansky. 1986). Itnportant. econom-
ic deposits
of
this kind occur
in
northern Russia, Brazil.
and eastern
and
southern Africa (Cook. 1984).
Environmental issues connected
to
phosphorites
Along with rises
in
world populations
and
living standards,
exploitation
of
phosphorites
as a
source
of
fertilizers will
inevitably also increase. This
may be
accompanied
by
several
(A) POTENTtAL CONDENSED
PHOSPHORITE
:^:'-••;,V.V,'.- Prograding siliciclastics, bioclasts.
and reworked authigenic minerats
SEQUENCE
BOUNDARY
Highsland
Systems Tract
SEQUENCE
BOUNDARY DOWNLAP
Retrograde
and
downtapped
in-situ authigenic minerats,
"flood bioclasts",
and
detrital quartz
DOWNLAP SURFACE
(B)
SB
HST
MFS
TST
SB^S
APPARENT TRUNCATION
(=
BACKLAP)
Transgressive Systems Tract
^ Highstand Authigenic Grams
Reworked Seaward
Transgressive Authigenic Grains
In Situ
or
Locally Reworked
Figure
P8
Potential relationships between sequence slratigrdphy, c:ondensed sections
and
phosphorites.
(A)
Possible positions
of
sequence
condensation within
an
ide.ilized depositional sequence (stipples), (after Kidwell, 19'M).
(Bl
Schemalic illustration
of the
pUicenienI
of non-
reworked prisline duthigenit phosphorite {and/or glauconitel
and
reworked phosphorite (and/or glautonilei. Pristine phosphates
may
form within
transgressive syslems tracts
and at the
maximum flooding surface, whereas later phases
are
reworked seaward within highstand systems tracts,
IC) The timing
of
systems tracts development with respect
to one
cycle
of
sea level change,
LST
iowstand systems tract,
TST
transgressive systems
tract,
HST
highstand systems
tracl,
TS
transgressive surface,
MFS
maximum flooding surface,
SB
sequence boundary. Dots
on the
sea level curve
represent locations
of
maximum phosphorite emplacement, {After Glenn
ef
<?/„ 1994a, reprinted with p<-rmission
of
Birkhauser Verlag
AG},