Jacques I. Mathematics for Economics and Business
Подождите немного. Документ загружается.

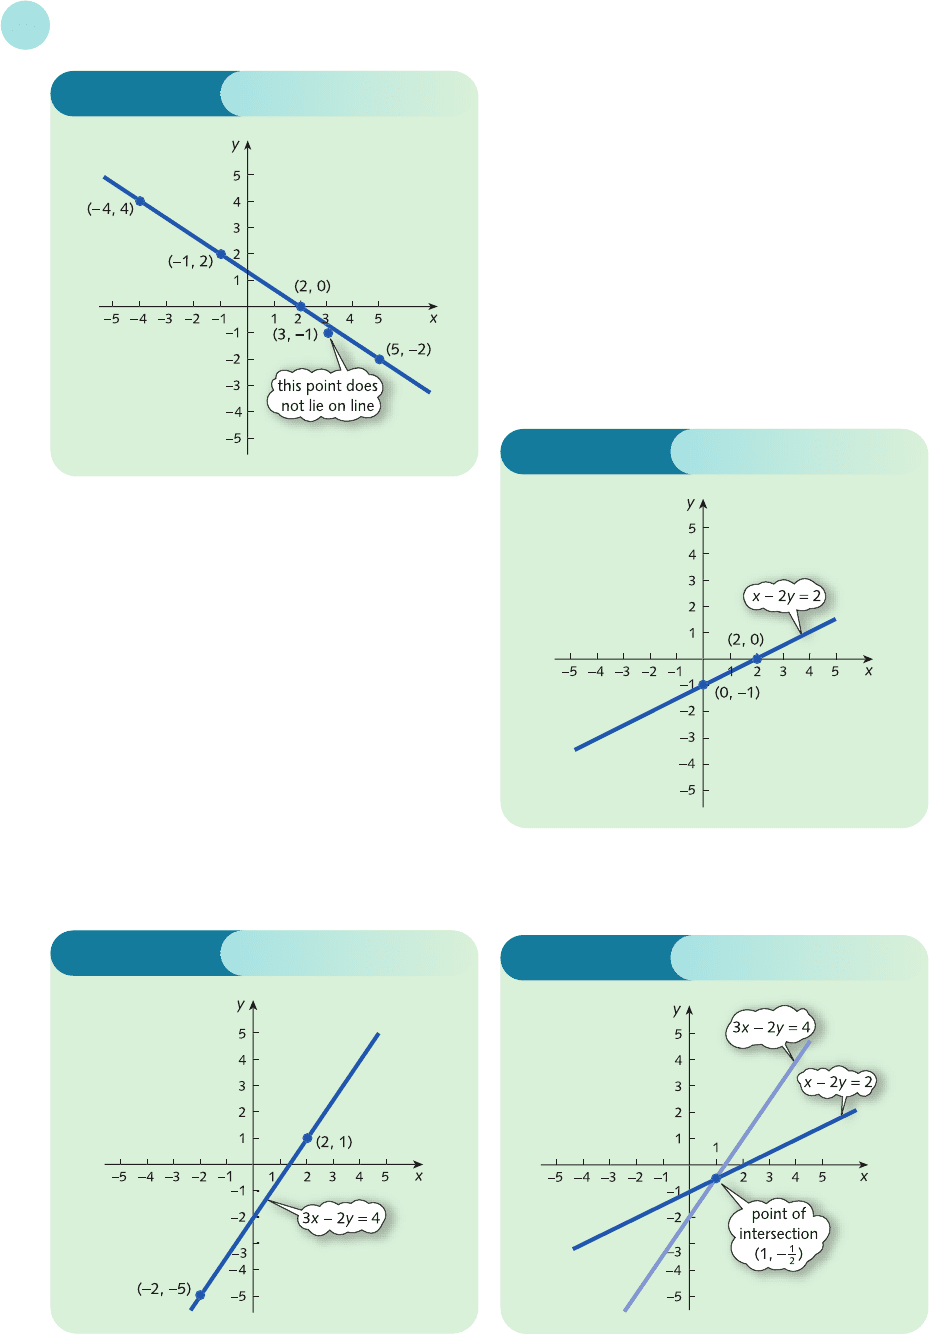
The graph shows that (3, −1) does not lie on the line.
This can be verified algebraically:
2(3) + 3(−1) = 6 − 3 = 3 ≠ 4
5 3x − 2y = 4
3(2) − 2y = 4 (substitute x =−2)
6 − 2y = 4
−2y =−2 (subtract 6 from both sides)
y = 1 (divide both sides by −2)
Hence (2, 1) lies on the line.
3x − 2y = 4
3(−2) − 2y = 4
−6 − 2y = 4 (substitute x = 2)
−2y = 10 (add 6 to both sides)
y =−5 (divide both sides by −2)
Hence (−2, −5) lies on the line.
The line is sketched in Figure S1.3.
6 x − 2y = 2
0 −
2y = 2 (substitute x = 0)
−2y = 2
y =−1 (divide both sides by −2)
Hence (0, −1) lies on the line.
x − 2y = 2
x − 2(0) = 2 (substitute y = 0)
x − 0 = 2
x = 2
Hence (2, 0) lies on the line.
The graph is sketched in Figure S1.4.
Solutions to Problems
600
7 From Figure S1.5 the point of intersection is (1, −
1
/2).
Figure S1.4
Figure S1.5
Figure S1.3
Figure S1.2
MFE_Z02.qxd 16/12/2005 10:51 Page 600
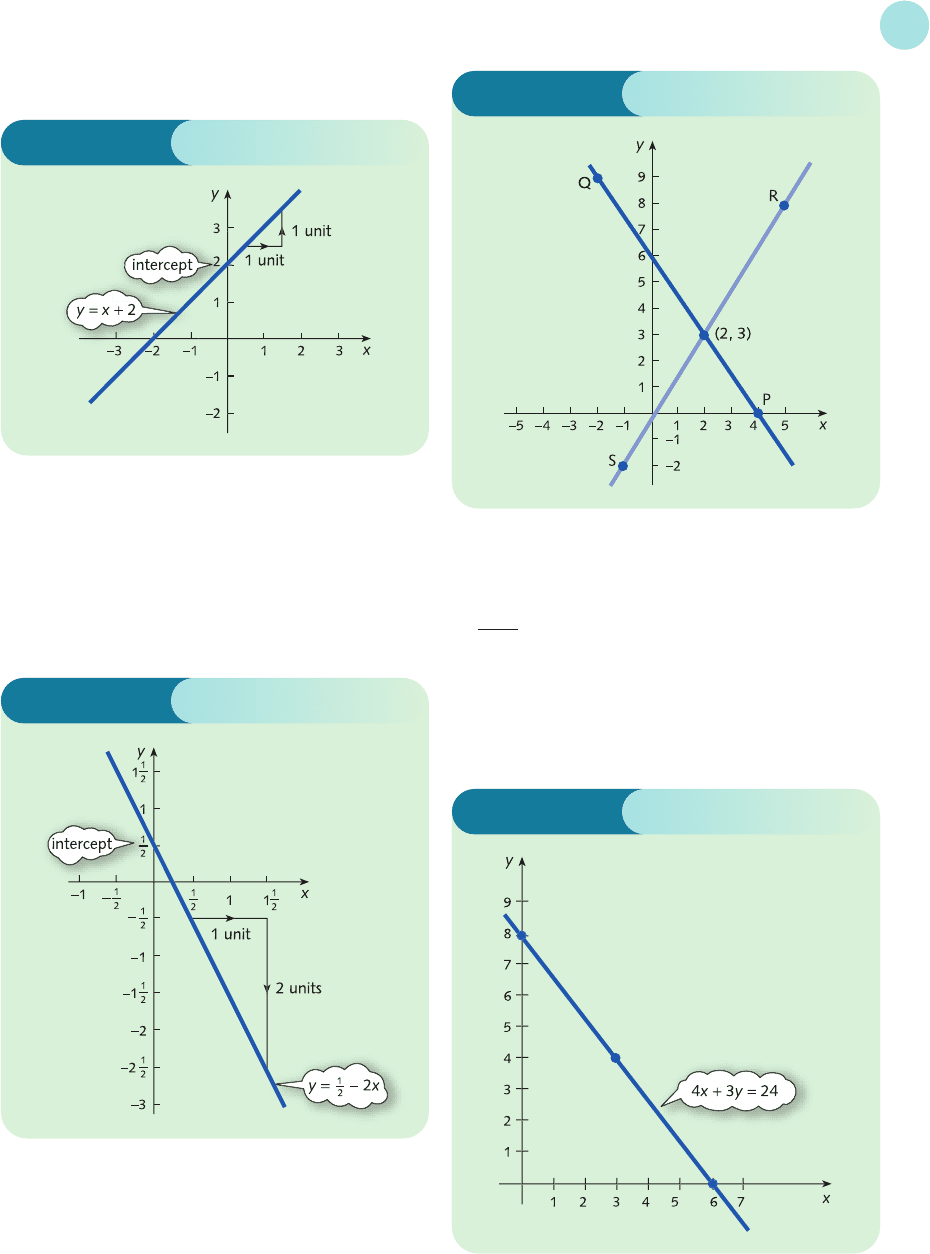
(b) 4x + 2y = 1
2y = 1 − 4x (subtract 4x from both sides)
y =
1
/2 − 2x (divide both sides by 2)
so a =−2, b =
1
/
2. The graph is sketched in
Figure S1.7.
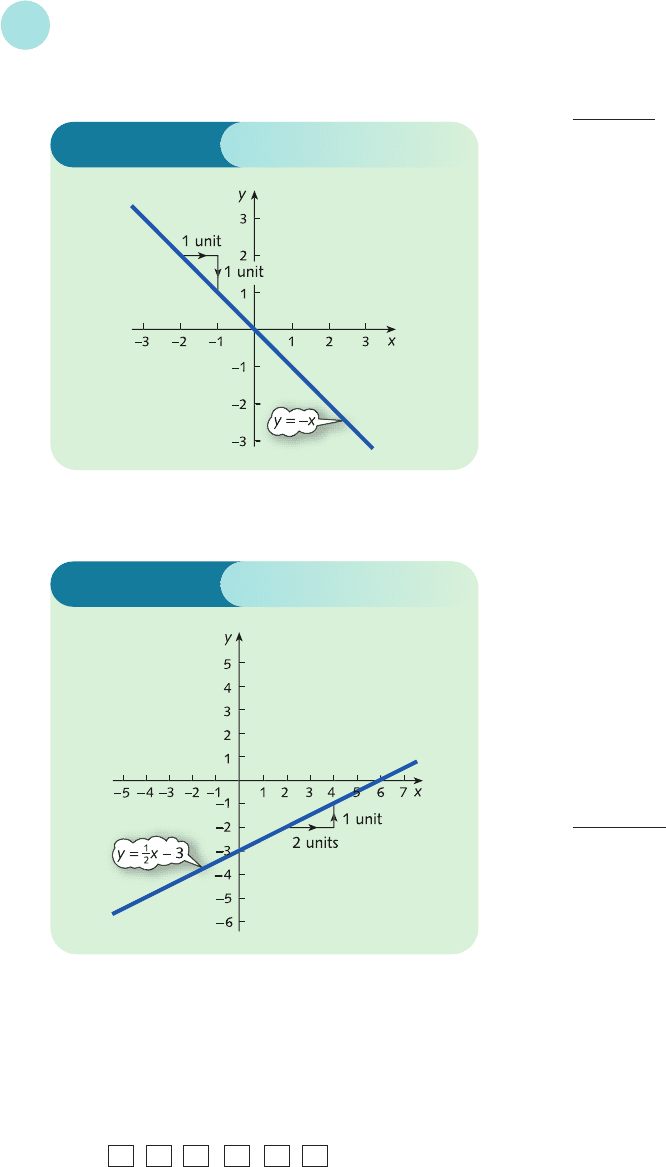
12 (a) 0.5; (b) 4; (c) −4;
(d) −0.5; (e) 0; (f) 9.
13 xy
08
60
34
The graph is sketched in Figure S1.9.
Solutions to Problems
601
Figure S1.6
Figure S1.7
Figure S1.8
Figure S1.9
8 (a) a = 1, b = 2. The graph is sketched in Figure S1.6.
9 From Figure S1.8 the point of intersection is (2, 3).
10 (a) −20; (b) 3; (c) −4; (d) 1;
(e) −1; (f) −3; (g) 11; (h) 0;
(i) 18.
11 (a) 1; (b) 5; (c) −6;
(d) −6; (e) −30; (f) 44.
14 (a) (−2, −2); (b) (2, 1
1
/2); (c) (1
1
/2, 1);
(d) (10, −9).
MFE_Z02.qxd 16/12/2005 10:51 Page 601
(b) The graph is sketched in Figure S1.11.
3x − 2y = 4
x − 2y = 2 −
2x = 2
Step 2
The equation 2x = 2 has solution x = 2/2 = 1.
Step 3
If this is substituted into the first equation then
3(1) − 2y = 4
3 − 2y = 4
−2y = 1 (subtract 3 from both sides)
y =−
1
/2 (divide both sides by −2)
Step 4
As a check the second equation gives
x − 2y = 1 − 2(−
1
/2)
= 1 − (−1) = 2 ✓
Hence the solution is x = 1, y =−
1
/
2.
If you decide to eliminate x then the
corresponding steps are as follows:
Step 1
Triple the second equation and subtract from the
first:
3x − 2y = 4
3x − 6y = 6 −
4y =−2
Step 2
The equation 4y =−2 has solution y =−2/4 =−
1
/2.
Step 3
If this is substituted into the first equation then
3x − 2(−
1
/2) = 4
3x + 1 = 4
3x = 3
(subtract 1 from both sides)
x = 1
(divide both sides by 3)
(b) Step 1
It is immaterial which variable is eliminated.
To eliminate x multiply the first equation by 5,
multiply the second by 3 and add:
Solutions to Problems
602
16 (a) 16.
(b) Presented with the calculation, −4
2
, your calculator
uses BIDMAS, so squares first to get 16 and then
subtracts from zero to give a final answer, −16.
To obtain the correct answer you need to use
brackets:
(
± 4
)
x
2
=
Section 1.2
1 (a) Step 1
It is probably easiest to eliminate y. This can be
done by subtracting the second equation from
the first:
15 (a) The graph is sketched in Figure S1.10.
Figure S1.10
Figure S1.11
MFE_Z02.qxd 16/12/2005 10:51 Page 602

15x + 25y = 95
−15x + 6y =−33 +
31y = 62
Step 2
The equation 31y = 62 has solution y = 62/31 = 2.
Step 3
If this is substituted into the first equation then
3x + 5(2) = 19
3x + 10 = 19
3x = 9
(subtract 10 from both sides)
x = 3
(divide both sides by 3)
Step 4
As a check the second equation gives
−5x + 2y =−5(3) + 2(2)
=−15 + 4 =−11 ✓
Hence the solution is x = 3, y = 2.
2 (a) Step 1
To eliminate x multiply the first equation by 4,
multiply the second equation by 3 and add:
12x − 24y =−8
−12x + 24y =−3 +
0y =−11
Step 2
This is impossible, so there are no solutions.
(b) Step 1
To eliminate x multiply the first equation by 2 and
add to the second:
−10x + 2y = 8
10x − 2y =−8 +
0y = 0
Step 2
This is true for any value of y, so there are infinitely
many solutions.
3 Step 1
To eliminate x from the second equation multiply
equation (2) by 2 and subtract from equation (1):
2x + 2y − 5z =−5
2x − 2y + 2z = 6 −
4y − 7z =−11 (4)
To eliminate x from the third equation multiply
equation (1) by 3, multiply equation (3) by 2 and add:
6x + 6y − 15z =−15
−6x + 2y + 4z =−4 +
8y − 11z =−19 (5)
The new system is
2x + 2y − 5z =−5 (1)
4y − 7z =−11 (4)
8y − 11z =−19 (5)
Step 2
To eliminate y from the third equation multiply
equation (4) by 2 and subtract equation (5):
8y − 14z =−22
8y − 11z =−19
−3z =−3 (6)
The new system is
2x + 2y − 5z =−5 (1)
4y − 7z =−11 (4)
−3z =−3 (6)
Step 3
Equation (6) gives
z =−3/−3 = 1. If this is substituted
into equation (4) then
4y − 7(1) =−11
4y − 7 =−11
4y =−4 (add 7 to both sides)
y =−1 (divide both sides by 4)
Finally, substituting y =−1 and z = 1 into equation (1)
produces
2x + 2(−1) − 5(1) =−5
2x − 7 =−5
2x = 2
(add 7 to both sides)
x = 1
(divide both sides by 2)
Step 4
As a check the original equations (1), (2) and (3) give
2(1) + 2(−1) − 5(1) =−5 ✓
1 − (−1) + 1 = 3 ✓
−3(1) + (−1) + 2(1) =−2 ✓
Hence the solution is x = 1, y =−1, z
= 1.
Solutions to Problems
603
MFE_Z02.qxd 16/12/2005 10:51 Page 603
(a) Infinitely many. (b) No solution.
6 (a) Infinitely many. (b) No solution.
7 (a) x = 3, y =−2, z =−1;
(b) x =−1, y = 3, z = 4.
8 (a) No solution.
(b) Infinitely many solutions.
Section 1.3
1 (a) 0; (b) 48; (c) 16; (d) 25; (e) 1; (f ) 17.
The function g reverses the effect of f and takes you
back to where you started. For example, if 25 is put
into the function f, the outgoing number is 0; and
when 0 is put into g, the original number, 25, is
produced. We describe this by saying that g is the
inverse of f (and vice versa).
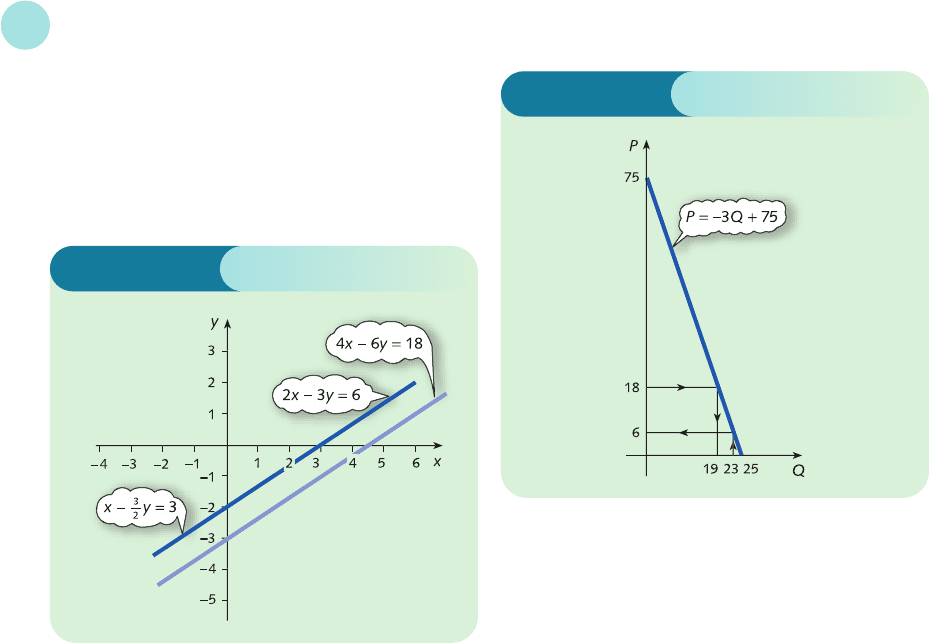
2 The demand curve that passes through (0, 75) and
(25, 0) is sketched in Figure S1.13. From this diagram
we see that
(a) P = 6 when Q = 23
(b) Q = 19 when P = 18
Alternatively, using algebra:
(a) Substituting Q = 23 gives
P =−3(23) + 75 = 6
(b) Substituting P = 18 gives 18 =−3Q + 75 with
solution Q = 19
3 (a) In equilibrium, Q
S
= Q
D
= Q, so
P =−4Q + 120
P =
1
/3Q + 29
Hence
−4Q + 120 =
1
/3Q + 29
(since both sides equal P)
−4
1
/
3
Q + 120 = 29
(subtract
1
/3Q from both sides)
−4
1
/3Q =−91
(subtract 120 from both sides)
Q = 21
(divide both sides by −4
1
/3)
Substituting this value into either the demand or
supply equations gives P = 36.
(b) After the imposition of a $13 tax the supply
equation becomes
P − 13 =
1
/3Q
S
+ 29
P =
1
/3Q
S
+ 42
(add 13 to both sides)
The demand equation remains unchanged, so, in
equilibrium,
P =−4Q + 120
P =
1
/3Q + 42
Hence
−4Q + 120 =
1
/3Q + 42
Solutions to Problems
604
Figure S1.12
Figure S1.13
4 (a) x =−2, y =−2;
(b) x = 2, y = 3/2;
(c) x = 3/2, y = 1;
(d) x = 10, y =−9.
5 The lines are sketched in Figure S1.12.
MFE_Z02.qxd 16/12/2005 10:51 Page 604
This equation can now be solved as before to get
Q = 18 and the corresponding price is P = 48. The
equilibrium price rises from $36 to $48, so the
consumer pays an additional $12. The remaining
$1 of the tax is paid by the firm.
4 For good 1, Q
D
1
= Q
S
1
= Q
1
in equilibrium, so the
demand and supply equations become
Q
1
= 40 − 5P
1
− P
2
Q
1
=−3 + 4P
1
Hence
40 − 5P
1
− P
2
=−3 + 4P
1
(since both sides equal Q
1
)
40 − 9P
1
− P
2
=−3
(subtract 4P
1
from both sides)
−9P
1
− P
2
=−43
(subtract 40 from both sides)
For good 2, Q
D
2
= Q
S
2
= Q
2
in equilibrium, so the
demand and supply equations become
Q
2
= 50 − 2P
1
− 4P
2
Q
2
=−7 + 3P
2
Hence
50 − 2P
1
− 4P
2
=−7 + 3P
2
(since both sides equal Q
2
)
50 − 2P
1
− 7P
2
=−7
(subtract 3P
2
from both sides)
−2P
1
− 7P
2
=−57
(subtract 50 from both sides)
The equilibrium prices therefore satisfy the
simultaneous equations
−9P
1
− P
2
=−43 (1)
−2P
1
− 7P
2
=−57 (2)
Step 1
Multiply equation (1) by 2 and (2) by 9 and subtract
to get
61P
2
= 427 (3)
Step 2
Divide both sides of equation (3) by 61 to get P
2
= 7.
Step 3
Substitute P
2
into equation (1) to get P
1
= 4.
If these equilibrium prices are substituted into either
the demand or the supply equations then Q
1
= 13 and
Q
2
= 14.
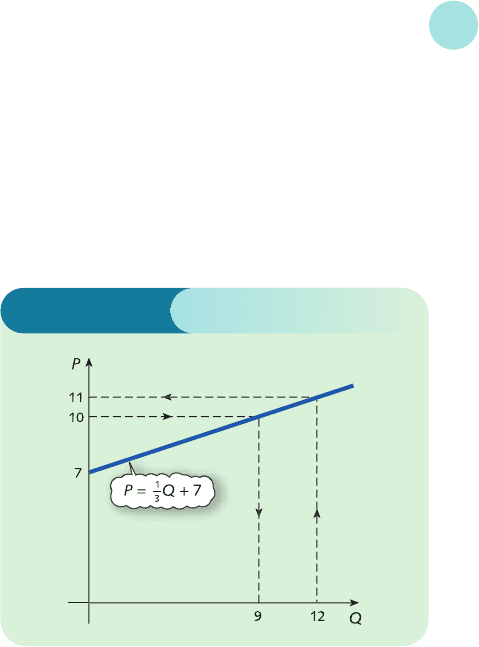
(a) 11; (b) 9;
(c) 0; once the price falls below 7 the firm does not
plan to produce any goods.
7 (a) As P
S
rises, consumers are likely to switch to the
good under consideration, so demand for this
good also rises: that is, the graph shifts to the
right.
(b) As P
C
rises, demand for the bundle of goods as a
whole is likely to fall, so the graph shifts to the left.
(c) Assuming that advertising promotes the good and
is successful, demand rises and the graph shifts
to the right. For some goods, such as drugs,
advertising campaigns are intended to discourage
consumption, so the graph shifts to the left.
8 (a) Demand is 173. Additional advertising expenditure
is 12.
(b) Superior.
9 (a) 53;
(b) Substitutable; a rise in P
A
leads to an increase in Q;
(c) 6.
10 (1) P = 30, Q = 10.
(2) New supply equation is 0.85P = 2Q
S
+ 10; P = 33.6,
Q = 9.28.
11 (a) 17, 9; (b) $324.
Solutions to Problems
605
The goods are complementary because the
coefficient of P
2
in the demand equation for good 1 is
negative, and likewise for the coefficient of P
1
in the
demand equation for good 2.
5 (a) 21; (b) 45; (c) 15; (d) 2; (e) 10;
(f) 0; inverse.
6 The supply curve is sketched in Figure S1.14.
Figure S1.14
MFE_Z02.qxd 16/12/2005 10:51 Page 605

12 P
1
= 40, P
2
= 10; Q
1
= 30, Q
2
= 55.
13 P
1
= 20, P
2
= 5, P
3
= 8; Q
1
= 13, Q
2
= 16, Q
3
= 11.
14 0 and 30.
15 Superior; graph of (b) lies above that of (a).
Substitutable; graph of (c) lies below that of (a).
16 $180, $200,
1
/3
.
(a)
1
/2 (b)
3
/5 (c)
2
/3
; fraction is .
When k = 6, the fraction is
3
/4
so the consumer pays $45.
[In general if the supply and demand equations are
P =−aQ
D
+ b
P = cQ
S
+ d
the fraction of tax paid by the consumer is
.]
Section 1.4
1 (a) 12 > 9 (true); (b) 12 > 6 (true);
(c) 3 > 0 (true); (d) same as (c);
(e) 2 > 1 (true); (f) −24 >−12 (false);
(g) −6 >−3 (false); (h) −2 >−1 (false);
(i) −4 >−7 (true).
2 (a) 2x < 3x + 7
−x < 7 (subtract 3x from both sides)
x >−7 (divide both sides by −1 changing sense
because −1 < 0)
(b) 21x − 19 ≥ 4x + 15
17x − 19 ≥ 15
(subtract 4x from both sides)
17x ≥ 34
(add 19 to both sides)
x ≥ 2
(divide both sides by 17, leaving inequality
unchanged because 17 > 0)
3 (1) (a) 8;
(b) −12; (c) 14;
(d) 4; (e) 56;
(f) 1. In part (f) the innermost pair of brackets is
evaluated first.
(2) All scientific calculators have a bracket facility.
There are two keys typically denoted by
(
and
)
for ‘opening’ and ‘closing’ brackets. It is usually
possible to have several levels (that is, brackets
within brackets) so part (f ) should cause no
additional problem. Possible key sequences are
as follows.
a
a + d
k
k + 2
(a)
(
1 − 3
)
+ 1 0 = .
Notice that when
)
is pressed your
calculator automatically evaluates the
expression inside the brackets and displays
the intermediate result.
(b) 1 −
(
3 + 1 0
)
= .
(c) 2 ×
(
3 + 4
)
= . Note that it is
essential to press the × key explicitly on most
calculators.
(d) 8 − 7 + 3 = .
(e)
(
1 5 − 8
)
×
(
2 + 6
)
= .
(f)
( (
2 − 3
)
+ 7
)
÷ 6
)
.
Notice the effect of pressing the three
)
keys.
There is no need to press the = key at the
end since the expression terminates with
)
.
4 (a) 5z − 2z
2
(b) 6x − 6y + 3y − 6x =−3y
(c) x − y + z − x
2
− x + y = z − x
2
5 (a) x
2
− 2x + 3x − 6 = x
2
+ x − 6
(b) x
2
− xy + yx − y
2
= x
2
− y
2
(c) x
2
+ xy + yx + y
2
= x
2
+ 2xy + y
2
(d) 5x
2
− 5xy + 5x + 2yx − 2y
2
+ 2y
= 5x
2
− 3xy + 5x − 2y
2
+ 2y
6 (a) (x + 8) (x − 8);
(b) (2x + 9) (2x − 9).
7 (1) (a) ×= =
(b) 7 ×=
(c) ÷=× =
(d) ÷ 16 =× =
(2) Most scientific calculators have a fractions facility
typically labelled a
b
/c . To enter a number such
as
3
/4 you press 3 a
b
/c 4 . Try this for yourself.
The display should read something like 3 4. To
enter a number such as 3
5
/8 you press 3 a
b
/c
5 a
b
/c 8 which then displays 3 5 8.
Possible key sequences for part (1) are
(a) 1 a
b
/c 2 × 3 a
b
/c 4 =
(b) 7 × 1 a
b
/c 14=
(c) 2 a
b
/c 3 ÷ 8 a
b
/c 9 =
(d) 8 a
b
/c 9 ÷ 16=
ll
l
1
18
1
16
2
8
9
8
9
3
4
9
3
8
4
2
3
8
9
2
3
1
2
1
14
2
3
8
1 × 3
2 × 4
3
4
1
2
Solutions to Problems
606
MFE_Z02.qxd 16/12/2005 10:51 Page 606

8 (1) (a) −=
(b) +=+=
(c) −=−=
(2) The key sequences are
(a) 3 a
b
/c 7 − 1 a
b
/c 7 =
(b) 1 a
b
/c 3 + 2 a
b
/c 5 =
(c) 7 a
b
/c 18− 1 a
b
/c 4 =
9 (a) ×=
(b) ÷= ×=
(c) +==
(d) −
=−
==
10 (a) 4x + 5 = 5x − 7
5 = x − 7 (subtract 4x from both sides)
12 = x (add 7 to both sides)
(b) 3(3 − 2x) + 2(x − 1) = 10
9 − 6x + 2x − 2 = 10
(multiply out brackets)
7 − 4x = 10
(collect like terms)
−4x = 3
(subtract 7 from both sides)
x =−
(divide both sides by −4)
(c) = 5
4 = 5(x − 1) (multiply both sides by x − 1)
4 = 5x − 5 (multiply out brackets)
9 = 5x (add 5 to both sides)
= x (divide both sides by 5)
9
5
4
x − 1
3
4
x + 3
(x + 1)(x + 2)
(2x + 4) − (x + 1)
(x + 1)(x + 2)
(1)(x + 1)
(x + 1)(x + 2)
2(x + 2)
(x + 1)(x + 2)
1
x + 2
2
x + 1
5
x + 1
4 + 1
x + 1
1
x + 1
4
x + 1
x(x + 1)
x + 10
x + 1
x
x
x
2
x + 10
x
x + 1
x
2
x + 10
5
x + 2
x − 1
x + 2
5
x − 1
5
36
9
36
14
36
1
4
7
18
11
15
6
15
5
15
2
5
1
3
2
7
1
7
3
7
(d) =
3(x − 1) = 5x (cross-multiplication)
3x − 3 = 5x (multiply out brackets)
−3 = 2x (subtract 3x from both sides)
−=x (divide both sides by 2)
11 (a), (d), (e), (f).
12 (a) x > 1; (b) x ≤ 3; (c) x ≤−3; (d) x > 2.
13 (a) 9; (b) 21; no.
14 (a) 43.96; (b) 1.13; (c) 10.34; (d) 0.17;
(e) 27.38; (f) 3.72; (g) 62.70; (h) 2.39.
15 (a) 6x + 2y; (b) 11x
2
− 3x − 3;
(c) 14xy + 2x; (d) 6xyz + 2xy; (e) 10a − 2b;
(f) 17x + 22y; (g) 11 − 3p; (h) x −
1
/4.
16 (a) 7x − 7y; (b) 5xz − 2yz;
(c) −5y + 4z − 2x; (d) x
2
− 7x + 10;
(e) x
2
− xy + 7x; (f) x
3
+ 3x
2
+ 2x;
(g) x
2
− xy − 1 + y.
Note: in part (f ), x
3
is an abbreviation for xxx.
17 (1) (a) (x + 2) (x − 2); (b) (x + y) (x − y);
(c) (3x + 10y) (3x − 10y); (d) (ab + 5) (ab − 5).
(2) (a) 112 600 000; (b) 1.799 99;
(c) 283 400; (d) 246 913 577.
18 (a) ; (b) ; (c) ; (d) ;
(e) ; (f) ; (g) ; (h) ;
(i) 6 (j) (k) (l) 4.
19 (a) x + 6
(b) or equivalently 1 +
(c)
(d)
(e)
(f)
(g)
(h)
x + 3
x(x + 1)
x
2
+ x − 2
x + 1
3x + 5
x
2
7x + 3
x(x + 1)
5x + 2
6
5
xy
1
x
x + 1
x
7
9
7
10
34
5
141
35
11
9
8
13
5
48
3
2
1
10
5
7
3
2
5
x − 1
3
x
Solutions to Problems
607
MFE_Z02.qxd 16/12/2005 10:51 Page 607
20 (a) − ; (b) 1; (c) − ; (d) 8;
(e) ; (f) ; (g) − ; (h) 8;
(i) 9; (j) ; (k) 7; (l) −9;
(m) 1; (n) −5; (o) 3; (p) 5.
Section 1.5
1 (a) Q = 4 (subtract 13 from both sides)
Q = 8 (multiply both sides by 2)
(b) Q = P − 13 (subtract 13 from both sides)
Q = 2(P − 13) (multiply both sides by 2)
Q = 2P − 26 (multiply out brackets)
(c) Q = 2 × 17 − 26 = 8
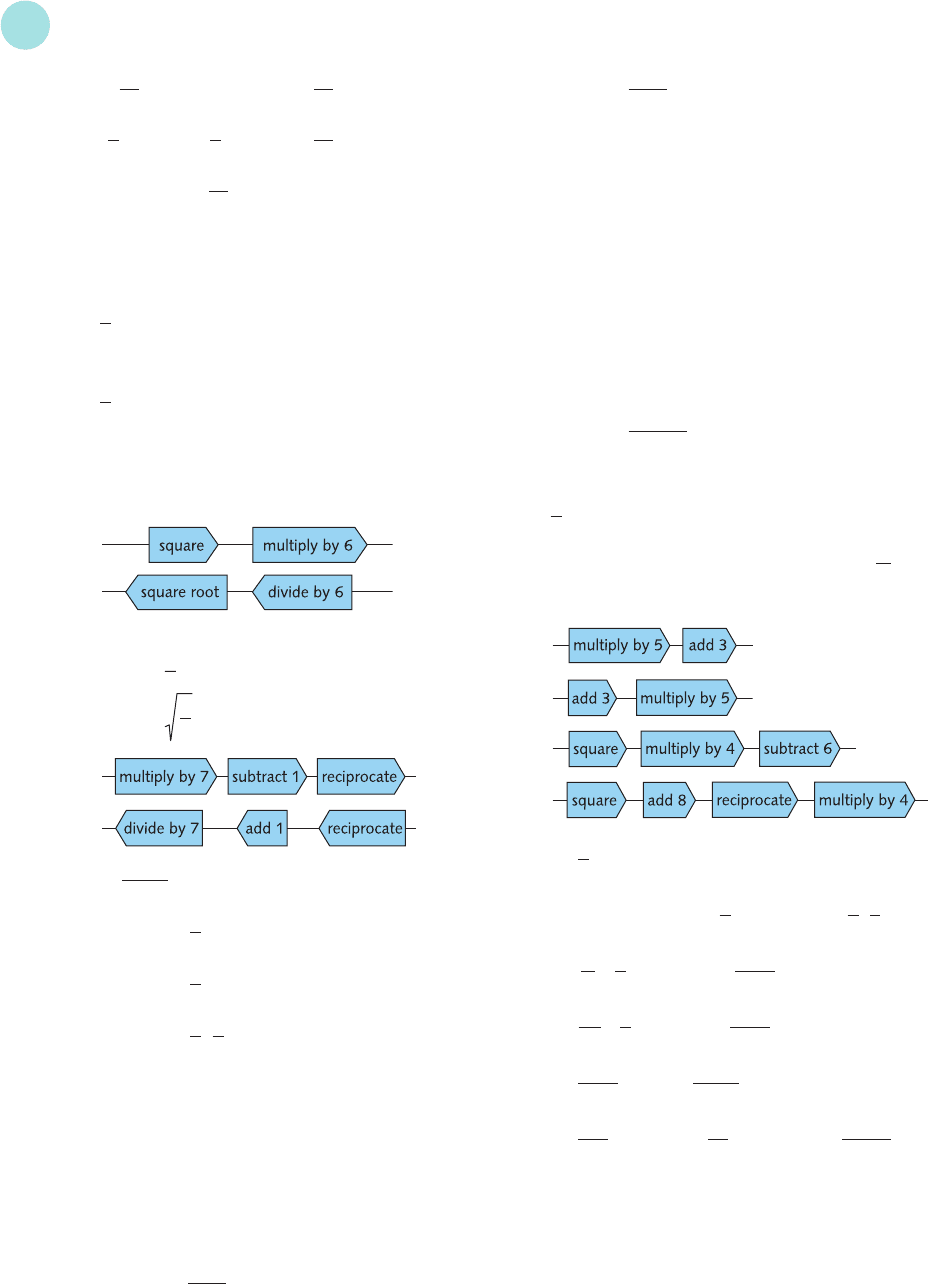
2 (a)
6x
2
= y
x
2
= (divide both sides by 6)
x = (square root both sides)
(b)
= y
7x − 1 = (reciprocate both sides)
7x =+1 (add 1 to both sides)
x =+1 (divide both sides by 7)
3 (a) x − ay = cx + y
x = cx + y + ay
(add ay to both sides)
x − cx = y + ay
(subtract cx from both sides)
(1 − c)x = (1 + a)y
(factorize both sides)
x = y
(divide both sides by 1 − c)
D
F
1 + a
1 − c
A
C
D
F
1
y
A
C
1
7
1
y
1
y
1
7x − 1
y
6
y
6
1
2
1
2
71
21
11
7
1
4
4
5
35
9
11
7
(b) y =
(x + 4)y = x − 2
(multiply both sides by x + 4)
xy + 4y = x − 2
(multiply out the brackets)
xy = x − 2 − 4y
(subtract 4y from both sides)
xy − x =−2 − 4y
(subtract x from both sides)
(y − 1)x =−2 − 4y
(factorize left-hand side)
x =
(divide both sides by y − 1)
4 Q = P − 4; 22.
5 (a) y = 2x + 5; (b) y = 2(x + 5); (c) y = ;
(d) y = 2(x + 4)
2
− 3.
6 (a)
(b)
(c)
(d)
7 (a) x = (y + 6); (b) x = 3y − 4; (c) x = 2y;
(d) x = 5(y − 8); (e) x =−2; (f) x =+7.
8 (a) P =−; (b) Y = ;
(c) P =−; (d) t = .
9 (a) x = ; (b) x = ; (c) x = (g − e)
2
− f;
(d) x =+n; (e) x =+m; (f ) x =
2
.
Section 1.6
1 S = Y − C
= Y − (0.8Y + 25) (substitute expression for C)
= Y − 0.8Y − 25 (multiply out brackets)
= 0.2Y − 25 (collect terms)
D
F
a
2
+ b
2
b − a
A
C
n
2
m
2
ma
2
b
2
a
2
− b
a + 1
c − a
b
V + 1
V − 5
b
a
1
aQ
b + I
1 − a
b
a
Q
a
D
F
4
y
A
C
1
3
1
y
1
9
5
x
2
1
2
−2 − 4y
y − 1
x − 2
x + 4
Solutions to Problems
608
MFE_Z02.qxd 16/12/2005 10:51 Page 608
2 Y = C + I (from theory)
C = 0.8Y + 25 (given in question)
I = 17 (given in question)
Substituting the given value of I into the first equation
gives
Y = C + 17
and if the expression for C is substituted into this then
Y = 0.8Y + 42
0.2Y = 42 (subtract 0.8Y from both sides)
Y = 210 (divide both sides by 0.2)
Repeating the calculations with I = 18 gives Y = 215,
so a 1 unit increase in investment leads to a 5 unit
increase in income. The scale factor, 5, is called the
investment multiplier. In general, the investment
multiplier is given by 1/(1 − a), where a is the marginal
propensity to consume. The foregoing is a special case
of this with a = 0.8.
3 Y = C + I + G (1)
G = 40 (2)
I = 55 (3)
C = 0.8Y
d
+ 25 (4)
T = 0.1Y + 10 (5)
Y
d
= Y − T (6)
Substituting equations (2) and (3) into equation (1)
gives
Y = C + 95 (7)
Substituting equation (5) into (6) gives
Y
d
= Y − (0.1Y + 10)
= 0.9Y − 10
so from equation (4),
C = 0.8(0.9Y − 10) + 25
= 0.72Y + 17 (8)
Finally, substituting equation (8) into (7) gives
Y = 0.72Y + 112
which has solution Y = 400.
4 The commodity market is in equilibrium when
Y = C + I
so we can substitute the given expressions for
consumption (C = 0.7Y + 85) and investment
(I =−50r + 1200) to deduce that
Y = 0.7Y − 50r + 1285
which rearranges to give the IS schedule,
0.3Y + 50r = 1285 (1)
The money market is in equilibrium when
M
S
= M
D
Now we are given that M
S
= 500 and that total demand,
M
D
= L
1
+ L
2
= 0.2Y − 40r + 230
so that
500 = 0.2Y − 40r + 230
which rearranges to give the LM schedule,
0.2Y − 40r = 270 (2)
We now solve equations (1) and (2) as a pair of
simultaneous equations.
Step 1
Multiply equation (1) by 0.2 and (2) by 0.3 and
subtract to get
22r = 176
Step 2
Divide through by 22 to get r = 8.
Step 3
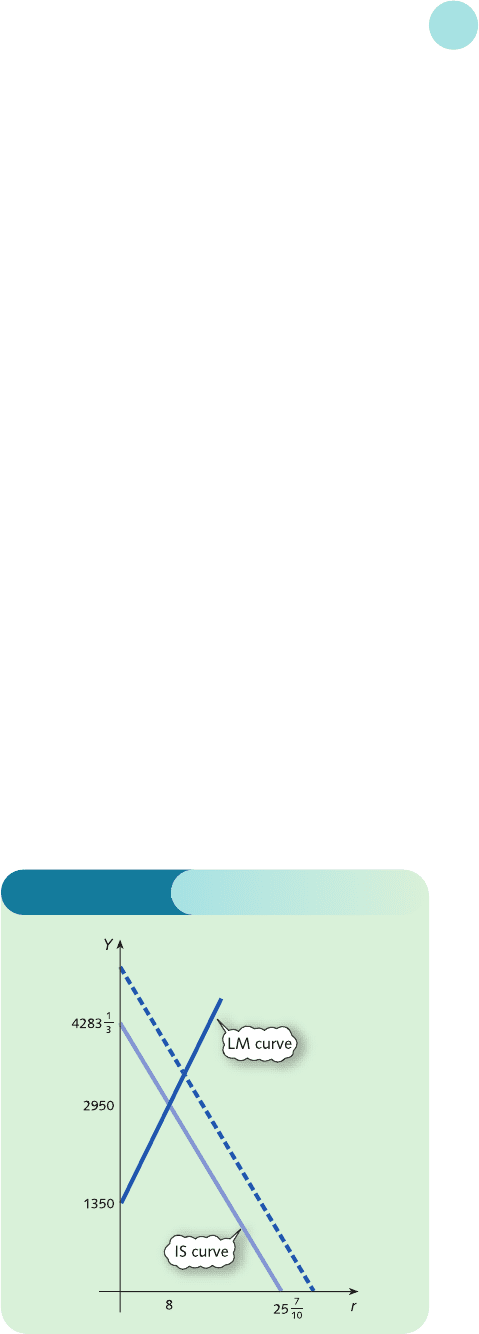
Substitute r = 8 into equation (1) to give Y = 2950.
The IS and LM curves shown in Figure S1.15 confirm
this, since the point of intersection has coordinates
(8, 2950). A change in I does not affect the LM schedule.
However, if the autonomous level of investment
increases from its current level of 1200 then the right-
hand side of the IS schedule (1) will rise. The IS curve
moves upwards, causing both r and Y to increase.
Solutions to Problems
609
Figure S1.15
MFE_Z02.qxd 16/12/2005 10:51 Page 609