Jacques I. Mathematics for Economics and Business
Подождите немного. Документ загружается.

Averaging the Q values gives
Q =
1
/2(203.1 + 217.1) = 210.1
Arc elasticity is
× = 0.333 175
(b) Putting P = 10 directly into the supply equation,
we get Q = 210. Differentiating the supply
equation immediately gives
= 5 + 0.2P
so when P = 10, dQ/dP = 7. Hence
E =× 7 =
Note that, as expected, the results in parts (a) and
(b) are similar. They are not identical, because
in part (a) the elasticity is ‘averaged’ over the
arc from P = 9 to P = 11, whereas in part (b) the
elasticity is evaluated exactly at the midpoint,
P = 10.
5 43/162 = 0.27.
6 22/81 = 0.27; agree to 2 decimal places.
7 (a) 1/4; (b) 1/4; (c) 9/8.
8 4P/(60 − 4P); 7.5.
9 (a) 0.2P.
(b) 0.1P
2
= Q − 4
(subtract 4 from both sides)
P
2
= 10(Q − 4) = 10Q − 40
(multiply both sides by 10)
P =√(10Q − 40)
(square root both sides)
=
(c) =
= = 0.2P =
(d) E = 10/7.
10 1.46; (a) elastic; (b) 7.3%.
11 If P = AQ
−n
then
=−nAQ
−(n+1)
so
=
1
−nAQ
−(n+1)
dQ
dP
dP
dQ
dQ
dP
P
5
(10Q − 40)
5
1
dP/dQ
5
(10Q − 40)
dP
dQ
1
3
10
210
dQ
dP
14
2
10
210.1
Hence
E =− ×
=− ×
=−Q
− n
×=
which is a constant.
12 E =× =×a ==
(a) if b = 0 then E ==1
(b) if b > 0 then aP + b > aP so E =<1
Assuming that the line is sketched with quantity on the
horizontal axis and price on the vertical axis, supply is
unit elastic when the graph passes through the origin,
and inelastic when the vertical intercept is positive.
Section 4.6
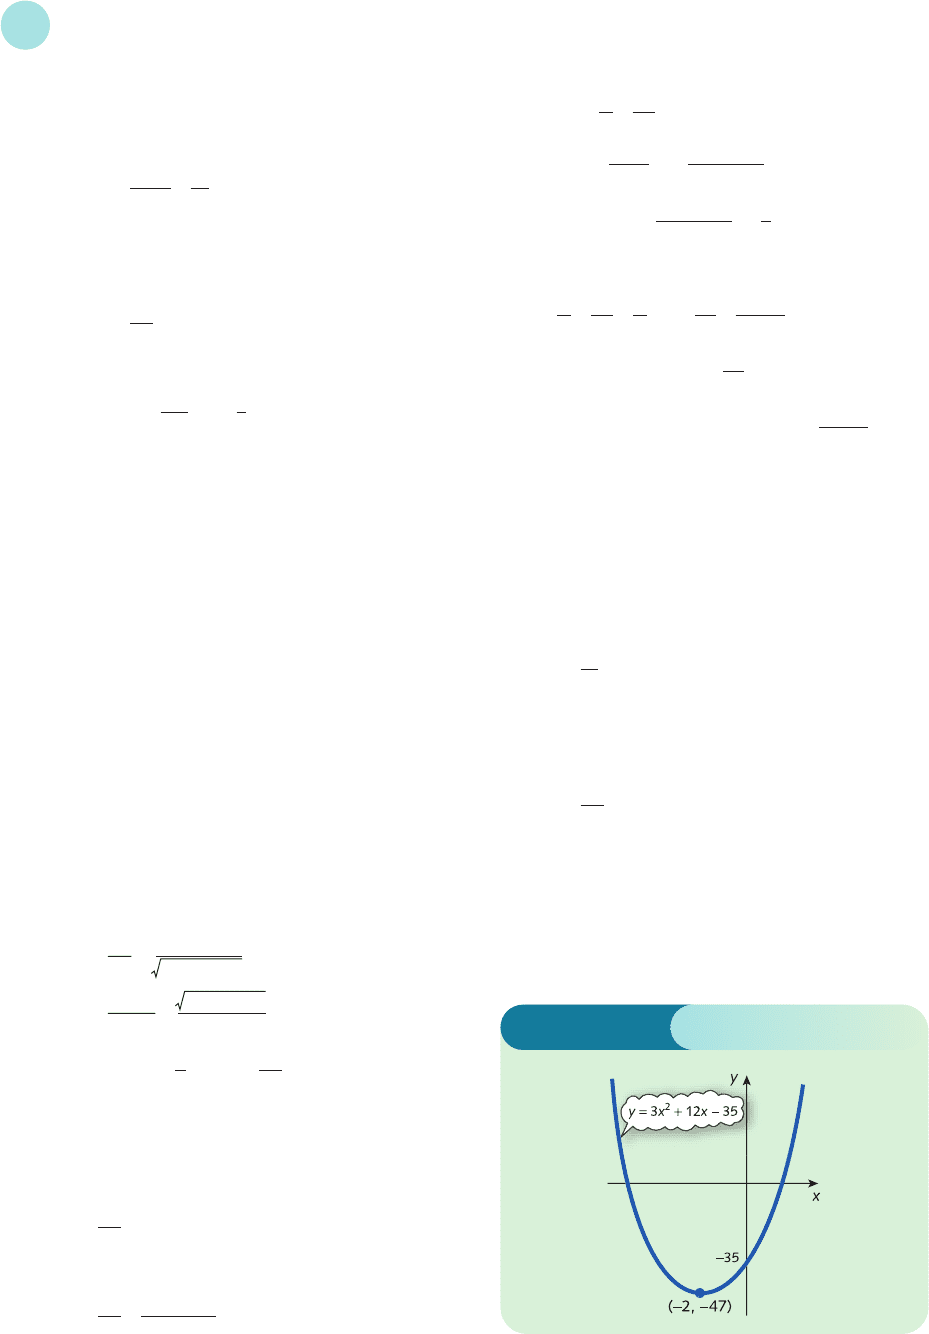
1 (a) Step 1
= 6x + 12 = 0
has solution x =−2.
Step 2
= 6 > 0
so minimum.
Finally, note that when x =−2, y =−47, so the
minimum point has coordinates (−2, −47). A
graph is sketched in Figure S4.5.
d
2
y
dx
2
dy
dx
aP
aP + b
Pa
Pa
aP
aP + b
Pa
Q
P
Q
dQ
dP
P
Q
1
n
D
F
1
−nQ
−n
A
C
D
F
1
−nAQ
−(n+1)
A
C
D
F
AQ
−n
Q
A
C
dQ
dP
P
Q
Solutions to Problems
630
Figure S4.5
MFE_Z02.qxd 16/12/2005 10:51 Page 630
(b) Step 1
=−6x
2
+ 30x − 36 = 0
has solutions x = 2 and x = 3.
Step 2
=−12x + 30x
which takes the values 6 and −6 at x = 2 and x = 3
respectively. Hence minimum at x = 2 and
maximum at x = 3.
d
2
y
dx
2
dy
dx
so at L = 10
MP
L
= 600(10) − 4(10)
3
= 2000
AP
L
= 300(10) − (10)
3
= 2000
that is, MP
L
= AP
L
.
3 (a) TR = PQ = (20 − 2Q)Q = 20Q − 2Q
2
Step 1
= 20 − 4Q = 0
has solution Q = 5.
Step 2
=−2 < 0
so maximum.
(b) π=TR − TC
= (20Q − 2Q
2
) − (Q
3
− 8Q
2
+ 20Q + 2)
=−Q
3
+ 6Q
2
− 2
Step 1
=−3Q
2
+ 12Q = 0
has solutions Q = 0 and Q = 4.
Step 2
=−6Q + 12
which takes the values 12 and −12 when Q = 0 and
Q = 4, respectively. Hence minimum at Q = 0 and
maximum at Q = 4.
Finally, evaluating π at Q = 4 gives the
maximum profit, π=30. Now
MR ==20 − 4Q
so at Q = 4, MR = 4;
MC ==3Q
2
− 16Q + 20
so at Q = 4, MC = 4.
4 AC = Q + 3 +
Step 1
= 1 −=0
has solution Q =±6. A negative value of Q does not
make sense, so we just take Q = 6.
36
Q
2
d(AC)
dQ
36
Q
d(TC)
dQ
d(TR)
dQ
d
2
π
dQ
2
dπ
dQ
d
2
(TR)
dQ
2
d(TR)
dQ
Solutions to Problems
631
A graph is sketched in Figure S4.6 based on the
following table of function values:
x −10 0 2 3 10
f(x) 3887 27 −10−833
2 AP
L
== =300L − L
3
Step 1
= 300 − 3L
2
= 0
has solution L =±10. We can ignore −10 because it
does not make sense to employ a negative number
of workers.
Step 2
=−6L
which takes the value −60 < 0 at L = 10. Hence L = 10
is a maximum.
Now
MP
L
==600L − 4L
3
dQ
dL
d
2
(AP
L
)
dL
2
d(AP
L
)
dL
300L
2
− L
4
L
Q
L
Figure S4.6
MFE_Z02.qxd 16/12/2005 10:51 Page 631
Step 2
=
is positive when Q = 6, so it is a minimum.
Now when Q = 6, AC = 15. Also
MC ==2Q + 3
which takes the value 15 at Q = 6. We observe that the
values of AC and MC are the same: that is, at the point
of minimum average cost
=
There is nothing special about this example and in the
next section we show that this result is true for any
average cost function.
5 After tax the supply equation becomes
P =
1
/
2
Q
S
+ 25 + t
In equilibrium, Q
S
= Q
D
= Q, so
P =
1
/2Q + 25 + t
P =−2Q + 50
Hence
1
/2Q + 25 + t =−2Q + 50
which rearranges to give
Q = 10 −
2
/
5
t
Hence the tax revenue, T, is
T = tQ = 10t −
2
/5t
2
Step 1
= 10 −
4
/
5
t
2
= 0
has solution t = 12.5.
Step 2
= < 0
so maximum. Government should therefore impose a
tax of $12.50 per good.
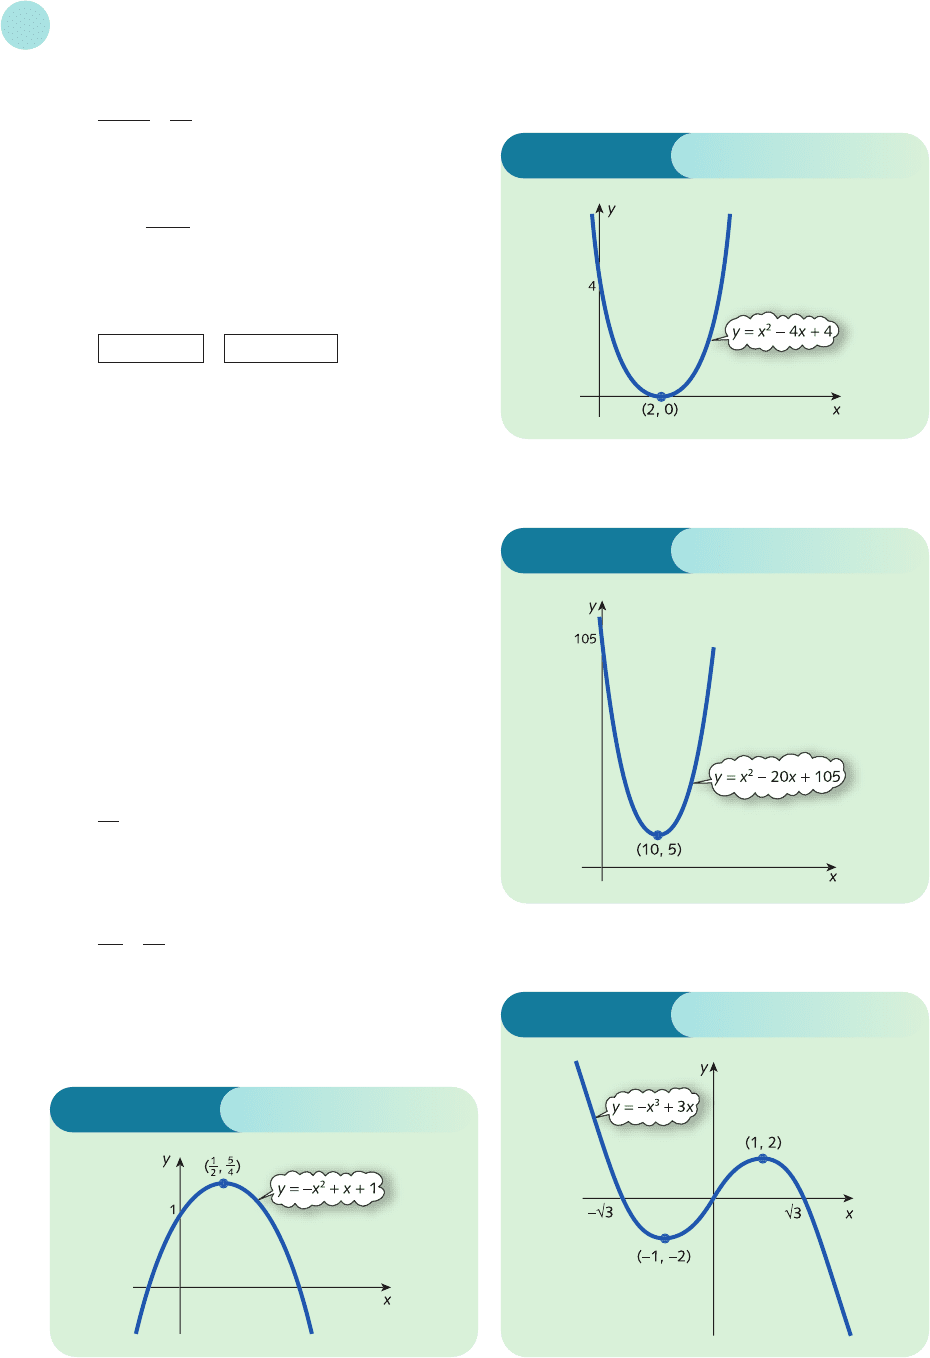
6 (a) Maximum at (1/2, 5/4); graph is sketched in
Figure S4.7.
−4
5
d
2
T
dt
2
dT
dt
marginal cost
average cost
d(TC)
dQ
72
Q
3
d
2
(AC)
dQ
2
(d) Maximum at (1, 2), minimum at (−1, −2); graph is
sketched in Figure S4.10.
Solutions to Problems
632
(b) Minimum at (2, 0); graph is sketched in
Figure S4.8.
(c) Minimum at (10, 5); graph is sketched in
Figure S4.9.
Figure S4.7
Figure S4.8
Figure S4.9
Figure S4.10
MFE_Z02.qxd 16/12/2005 10:51 Page 632
8 10.
9 TC = 2Q
2
+ 15, AC = 2Q + ,
MC = 4Q; √7.5; AC = 11 = MC.
10 30; MP
L
= 450 = AP
L
.
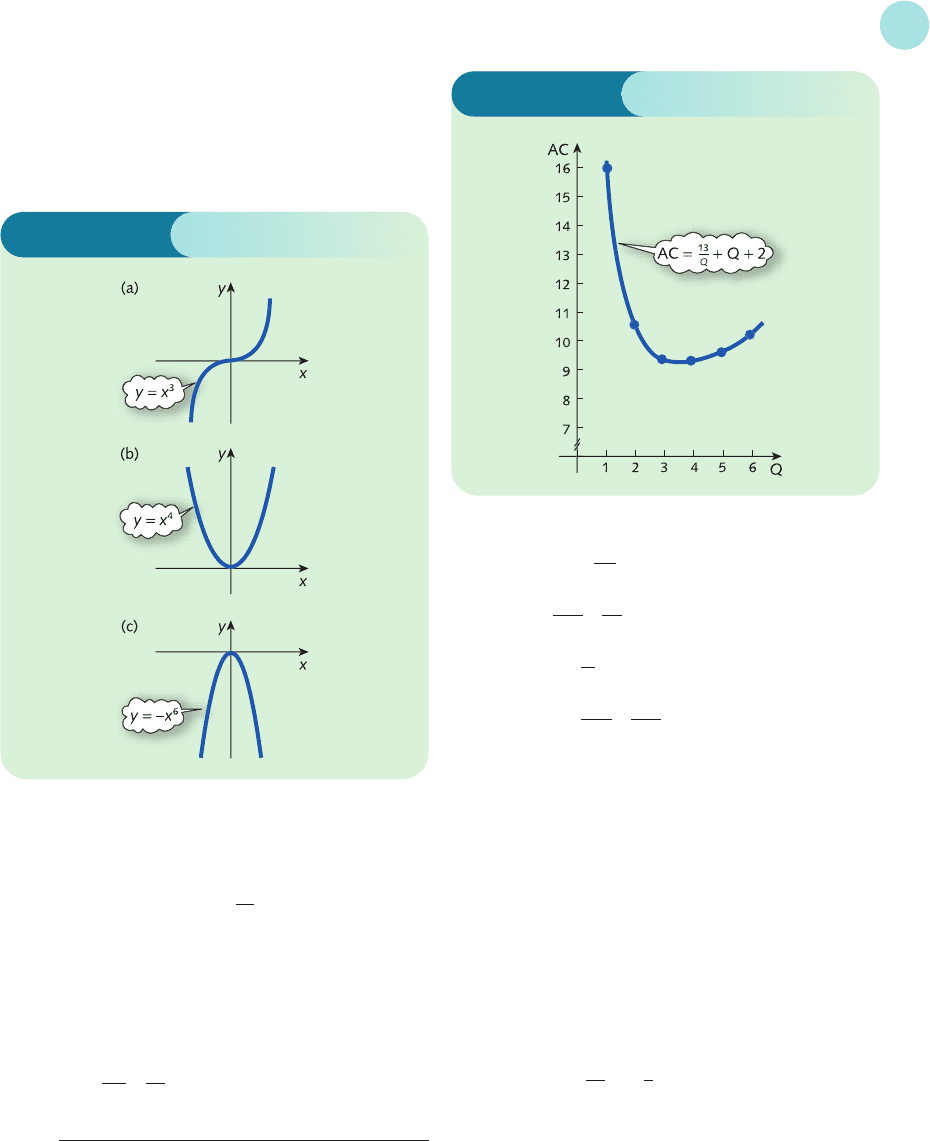
11 (a) TC = 13 + (Q + 2)Q
= 13 + Q
2
+ 2Q
AC ==+Q + 2
Q 12345 6
AC 16 10.5 9.3 9.3 9.6 10.2
The graph of AC is sketched in Figure S4.12.
(b) From Figure S4.12 minimum average cost 9.2.
(c) Minimum at Q =√13, which gives AC = 9.21.
12 (a) 37 037 after 333 days.
(b) 167.
13 167.
13
Q
TC
Q
15
Q
14 (a) TR = 4Q −
π= + +2Q − 4
MR = 4 −
MC = 2 −+
(b) 4. (c) MR = 2 = MC.
15 $3.
16 (a) Minimum at (1, 7) and (4, −34), maximum at (2, −2).
(b) Minimum at (0, −10), inflection at (3, 17).
(c) Minimum at (−1, −
1
/2), maximum at (1,
1
/2).
17 (a) Maple chooses a poor range on the y axis so that
you can barely distinguish the graph from the axes.
This is because the graph is undefined at x = 0,
resulting in very large (positive and negative)
values of y when x is close to 0.
(c) Minimum at (1, 1), maximum at (5,
1
/
9).
18 π=−30Q + Q
2
− Q
3
MC = 80 − 15Q + Q
2
MR = 50 − 2Q
19 29.54.
Section 4.7
1 (a) TR = (25 − 0.5Q)Q = 25Q − 0.5Q
2
TC = 7 + (Q + 1)Q = Q
2
+ Q + 7
MR = 25 − Q
MC = 2Q + 1
1
3
13
2
3Q
2
20
3Q
5
Q
2
Q
2
20
−Q
3
20
Q
2
4
Solutions to Problems
633
7 Graphs of the three functions are sketched in
Figure S4.11, which shows that the stationary
points in (a), (b) and (c) are a point of inflection,
minimum and maximum, respectively.
Figure S4.11
Figure S4.12
MFE_Z02.qxd 16/12/2005 10:51 Page 633
2 MC = 100.
(a) Domestic market P
1
= 300 − Q
1
TR
1
= 300Q
1
− Q
1
2
so
MR
1
= 200 − 2Q
1
To maximize profit, MR
1
= MC: that is,
300 − 2Q
1
= 100
which has solution Q
1
= 100.
Corresponding price is
P
1
= 300 − 100 = $200
Foreign market P
2
= 200 −
1
/2Q
2
TR
2
= 200Q
2
−
1
/
2
Q
2
2
so
MR
2
= 200 − Q
2
To maximize profit, MR
2
= MC: that is,
200 − Q
2
= 100
which has solution Q
2
= 100.
Corresponding price is
P
2
= 200 −
1
/2(100) = $150
(b) Without discrimination, P
1
= P
2
= P, say, so
individual demand equations become
Q
1
= 300 − P
Q
2
= 400 − 2P
Adding shows that the demand equation for
combined market is
Q = 700 − 3P
where Q = Q
1
+ Q
2
.
TR = Q −
so
MR =−
To maximize profit, MR = MC: that is,
−=100
which has solution Q = 200.
Corresponding price is
P = 700/3 − 200/3 = $500/3
Total cost of producing 200 goods is
5000 + 100(200) = $25 000
With discrimination, total revenue is
100 × 200 + 100 × 150 = $35 000
so profit is $35 000 − $25 000 = $10 000.
Without discrimination, total revenue is
200 ×=$33 333
so profit is $33 333 − $25 000 = $8333.
3 Domestic market From Practice Problem 2, profit
is maximum when P
1
= 200, Q
1
= 100. Also, since
Q
1
= 300 − P
1
we have dQ
1
/dP
1
=−1. Hence
E
1
=− ×
=− ×(−1) = 2
Foreign market From Practice Problem 2, profit
is maximum when P
2
= 150, Q
2
= 100. Also, since
Q
2
= 400 − 2P
2
we have dQ
2
/dP
2
=−2. Hence
E
2
=− ×
=− ×(−2) = 3
We see that the firm charges the higher price in the
domestic market, which has the lower elasticity of
demand.
4 Argument is similar to that given in text but with
< replaced by >.
5 (a) TR = aQ
2
+ bQ, TC = dQ + c;
(b) MR = 2aQ + b, MC = d.
(c) The equation 2aQ + b = d has solution
Q =
d − b
2a
150
100
dQ
2
dP
2
P
2
Q
2
200
100
dQ
1
dP
1
P
1
Q
1
500
3
2Q
3
700
3
2Q
3
700
3
Q
2
3
700
3
Solutions to Problems
634
Figure S4.13
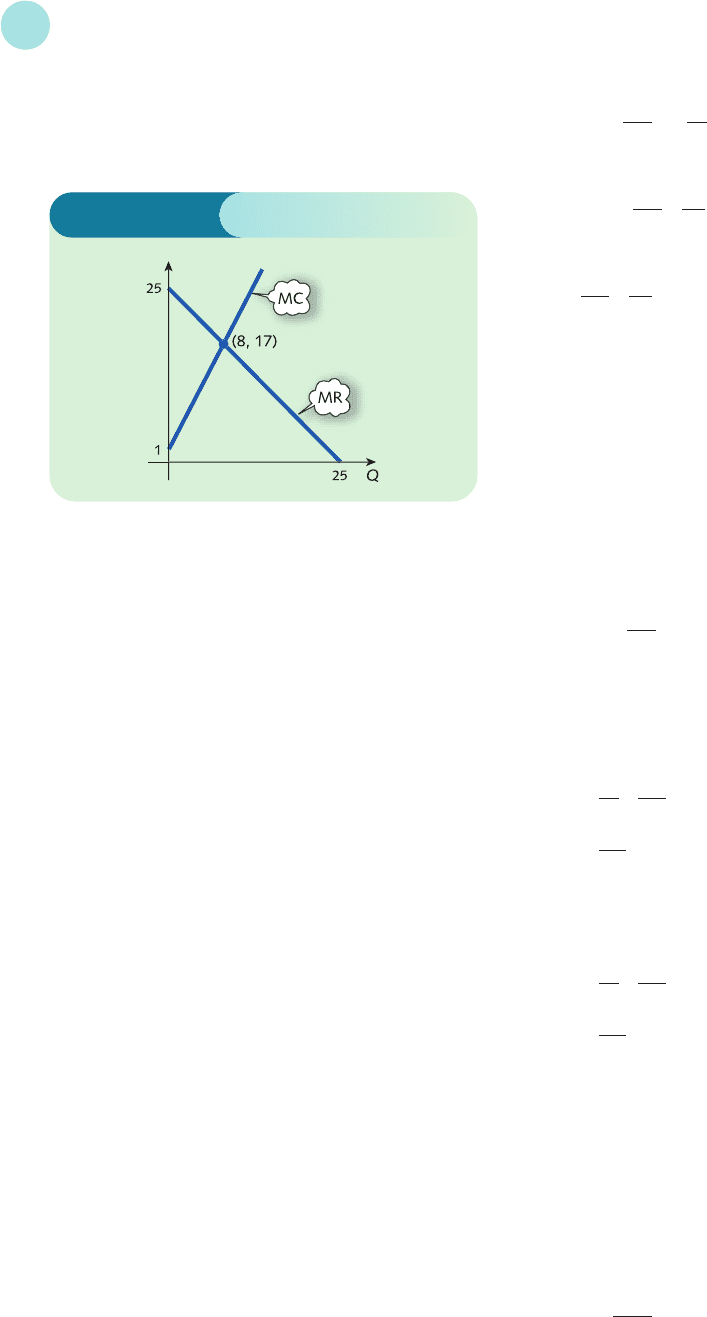
(b) From Figure S4.13 the point of intersection of
the MR and MC curves occurs at Q = 8. The MC
curve cuts the MR curve from below, so this
must be a maximum point.
MFE_Z02.qxd 16/12/2005 10:51 Page 634
6 (a) At the point of maximum total revenue
MR ==0
so E = 1.
(b) Maximum occurs when Q = 10.
7 TC = ACO + ACC
=+(CU)(CC)
At a stationary point
=− + =0
which has solution
EOQ =
Also
=>0
so minimum.
8 (a) P
1
= $30, P
2
= $20. (b) P = $24.44.
The profits in parts (a) and (b) are $95 and $83.89
respectively.
9 The argument is similar to that given in the text for AP
L
.
10 The new supply equation is
P = aQ
S
+ b + t
In equilibrium
aQ + b + t =−cQ + d
which has solution
Q =
Hence
tQ =
which differentiates to give
This is zero when
t =
Also the second derivative is
< 0 (since a and c are both positive)
which confirms that the stationary point is a
maximum.
−2
a + c
d − b
2
d − b − 2t
a + c
(d − b)t − t
2
a + c
d − b − t
a + c
2(ARU)(CO)
(EOQ)
3
d
2
(TC)
d(EOQ)
2
2(ARU)(CO)
(CU)(CC)
(CU)(CC)
2
(ARU)(CO)
(EOQ)
2
d(TC)
d(EOQ)
(EOQ)
2
(ARU)(CO)
EOQ
d(TR)
dQ
Section 4.8
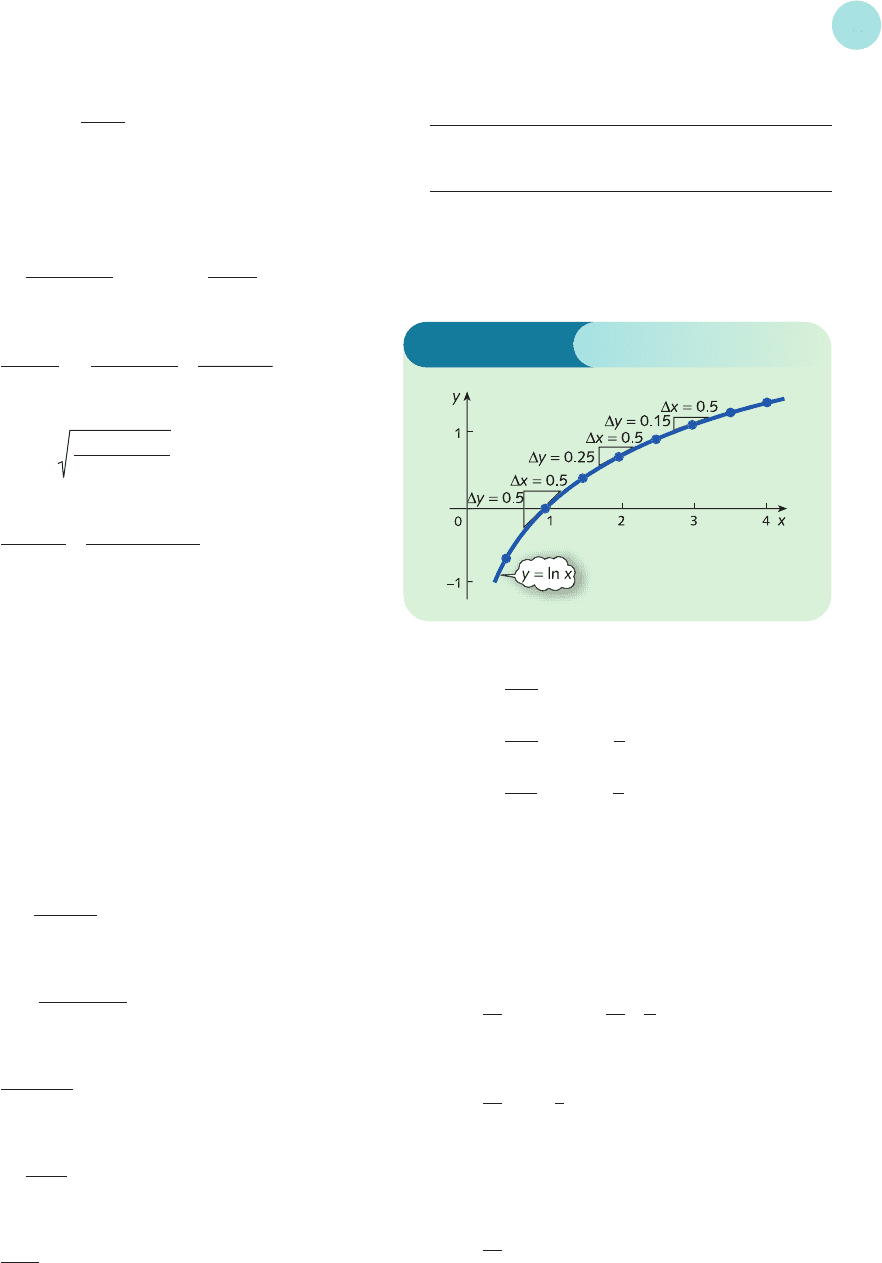
1 x 0.50 1.00 1.50 2.00
f(x) −0.69 0.00 0.41 0.69
x 2.50 3.00 3.50 4.00
f(x) 0.92 1.10 1.25 1.39
The graph of the natural logarithm function is
sketched in Figure S4.14.
Solutions to Problems
635
f ′(1) ==1.00 1
f ′(2) ==0.50
f ′(3) ==0.30
These results suggest that f ′(x) = 1/x.
2 (a) 3e
3x
; (b) −e
−x
; (c) 1/x; (d) 1/x.
3 (a) For the product rule we put
u = x
4
and v = ln x
for which
= 4x
3
and =
By the product rule
= x
4
×+lnx × 4x
3
= x
3
+ 4x
3
ln x
= x
3
(1 + 4 ln x)
(b) By the chain rule
= e
x
2
× 2x = 2xe
x
2
(c) If
u = ln x and v = x + 2
dy
dx
1
x
dy
dx
1
x
dv
dx
du
dx
1
3
0.15
0.50
1
2
0.25
0.50
0.50
0.50
Figure S4.14
MFE_Z02.qxd 16/12/2005 10:51 Page 635

then
= and = 1
By the quotient rule
(multiply top and bottom by x)
4 (a) y = ln x
3
+ ln(x + 2)
4
(rule 1)
= 3 ln x + 4 ln(x + 2) (rule 3)
Hence
=+
=
(b) y = ln x
2
− ln(2x + 3) (rule 2)
= 2 ln x − ln(2x + 3) (rule 3)
Hence
=− (chain rule)
=
=
5 In terms of P the total revenue function is given by
TR = PQ = 1000Pe
−0.2P
and the total cost function is
TC = 100 + 2Q = 100 + 2000e
−0.2P
Hence
π=TR − TC
= 1000Pe
−0.2P
− 2000e
−0.2P
− 100
Step 1
At a stationary point
= 0
To differentiate the first term, 1000Pe
−0.2P
, we use the
product rule with
u = 1000P and v = e
−0.2P
for which
= 1000 and =−0.2e
−0.2P
dv
dP
du
dP
dπ
dP
2x + 6
x(2x + 3)
2(2x + 3) − 2x
x(2x + 3)
2
2x + 3
2
x
dy
dx
7x + 6
x(x + 2)
3(x + 2) + 4x
x(x + 2)
4
x + 2
3
x
dy
dx
x + 2 − x ln x
x(x + 2)
2
d
d
y
x
x
x
x
x
( ) (ln )
( )
=
+×− ×
+
2
1
1
2
2
dv
dx
1
x
du
dx
Hence the derivative of 1000Pe
−0.2P
is
u + v
= 1000P(−0.2e
−0.2P
) + e
−0.2P
(1000)
= e
−0.2P
(1000 − 200P)
Now
π=1000Pe
−0.2P
− 2000e
−0.2P
− 100
so
= e
−0.2P
(1000 − 200P) − 2000(−0.2e
−0.2P
)
= e
−0.2P
(1400 − 200P)
This is zero when
1400 − 200P = 0
because e
−0.2P
≠ 0.
Hence P = 7.
Step 2
To find we differentiate
= e
−0.2P
(1400 − 200P)
using the product rule. Taking
u = e
−0.2P
and v = 1400 − 200P
gives
=−0.2e
−0.2P
and =−200
Hence
= u + v
= e
−0.2P
(−200) + (1400 − 200P)(−0.2e
−0.2P
)
= e
−0.2P
(10P − 480)
Putting P = 7 gives
=−200e
−1.4
This is negative, so the stationary point is a maximum.
6 To find the price elasticity of demand we need to
calculate the values of P, Q and dQ/dP. We are
given that Q = 20 and the demand equation gives
P = 200 − 40 ln (20 + 1) = 78.22
The demand equation expresses P in terms of Q,
so we first evaluate dP/dQ and then use the result
=
1
dP/dQ
dQ
dP
d
2
π
dP
2
du
dP
dv
dP
d
2
π
dP
2
dv
dP
du
dP
dπ
dP
d
2
π
dP
2
dπ
dP
du
dP
dv
dP
Solutions to Problems
636
MFE_Z02.qxd 16/12/2005 10:51 Page 636
To differentiate ln(Q + 1) by the chain rule we
differentiate the outer log function to get
and then multiply by the derivative of the inner
function, Q + 1, to get 1. Hence the derivative of
ln(Q + 1) is
and so
=
Putting Q = 20 gives dP/dQ =−40/21, so that
dQ/dP =−21/40. Finally, we use the formula
E =− ×
to calculate the price elasticity of demand as
E =− × =2.05
7 (a) 6e
6x
; (b) −342e
−342x
; (c) −2e
−x
+ 4e
x
;
(d) 40e
4x
− 4x.
8 (a) ; (b) .
9 (a) 3x
2
e
x
3
; (b)
10 (a) (4x
3
+ 2x
4
)e
2x
; (b) ln x + 1.
11 (a) (b)
12 (a) ; (b) ; (c) .
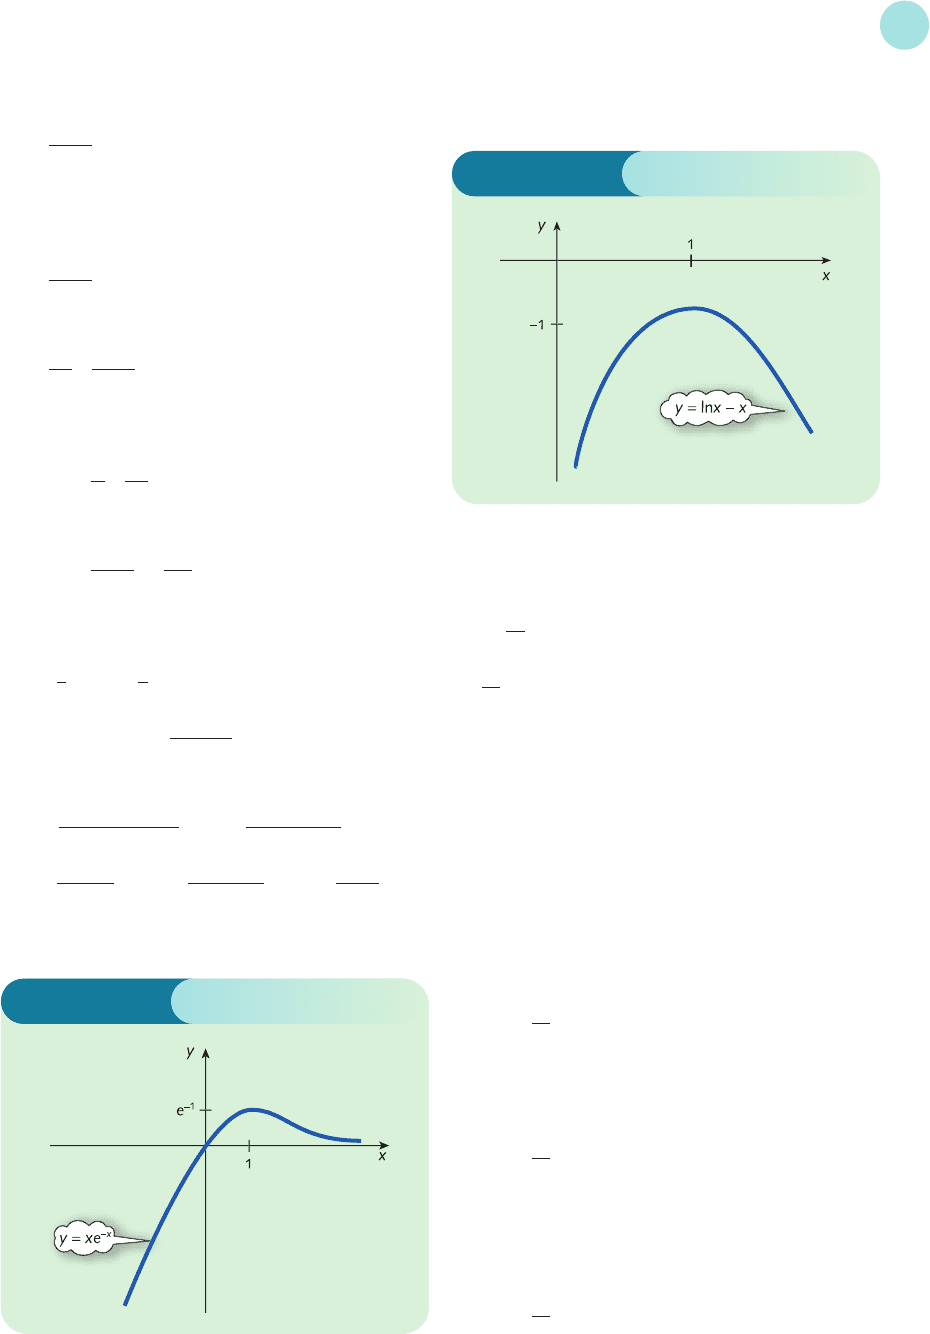
13 (a) Maximum at (1, e
−1
); the graph is sketched in
Figure S4.15.
1
1 − x
2
9x − 2
2x(3x − 1)
1
x(1 − x)
e
x
(x ln x − 1)
x(ln x)
2
2e
4x
(2x
2
− x + 4)
(x
2
+ 2)
2
4x
3
+ 6x
x
4
+ 3x
2
1
x
1
x
D
F
−21
40
A
C
78.22
20
dQ
dP
P
Q
−40
Q + 1
dP
dQ
1
Q + 1
1
Q + 1
14 49.
15 50.
16 E = , which is 1 when Q = 10.
17 ÷ y = Ake
kt
÷ Ae
kt
= k
Chapter 5
Section 5.1
1 (a) −10; (b) −1; (c) 2; (d) 21; (e) 0;
(f) 21. The value of g is independent of the ordering
of the variables. Such a function is said to be
symmetric.
2 (a) Differentiating 5x
4
with respect to x gives 20x
3
and,
since y is held constant, y
2
differentiates to zero.
Hence
= 20x
3
− 0 = 20x
3
Differentiating 5x
4
with respect to y gives zero
because x is held fixed. Also differentiating y
2
with respect to y gives 2y, so
= 0 − 2y =−2y
(b) To differentiate the first term, x
2
y
3
, with respect to
x we regard it as a constant multiple of x
2
(where
the constant is y
3
), so we get 2xy
3
. The second
term obviously gives −10, so
= 2xy
3
− 10
∂f
∂x
∂f
∂y
∂f
∂x
dy
dx
10
Q
Solutions to Problems
637
Figure S4.15
Figure S4.16
(b) Maximum at (1, −1); the graph is sketched in
Figure S4.16.
MFE_Z02.qxd 16/12/2005 10:51 Page 637

To differentiate the first term, x
2
y
3
, with respect to
y we regard it as a constant multiple of y
3
(where
the constant is x
2
), so we get 3x
2
y
2
. The second
term is a constant and goes to zero, so
= 3x
2
y
2
− 0 = 3x
2
y
2
3 (a) f
xx
= 60x
2
f
yy
= 2
f
yx
= f
xy
= 0
(b) f
xx
= 2y
3
f
yy
= 6x
2
y
f
yx
= f
xy
= 6xy
2
4 f
1
==x
2
+ 5x
4
1
f
11
==20x
3
1
f
21
==1
5 = y − 5, = x + 2, so, at (2, 6),
= 1, = 4
∂z
∂y
∂z
∂x
∂z
∂y
∂z
∂x
∂
2
f
∂x
2
∂x
1
∂
2
f
∂x
1
2
∂f
∂x
1
∂f
∂y
(a) ∆x =−0.1, ∆y = 0.1;
z 1(−0.1) + 4(0.1) = 0.3, so z increases by
approximately 0.3.
(b) At (2, 6), z = 14, and at (1.9, 6.1), z = 14.29, so the
exact increase is 0.29.
6 (a) =
(b) =
7 324; 75; 0.
8 85 ≠ 91; (0, y) for any y.
9 (a) f
x
= 2x, f
y
= 20y
4
;
(b) f
x
= 9x
2
, f
y
=−2e
y
;
(c) f
x
= y, f
y
= x + 6;
(d) f
x
= 6x
5
y
2
, f
y
= 2x
6
y + 15y
2
.
10 f
x
= 4x
3
y
5
− 2x
f
y
= 5x
4
y
4
+ 2y
f
x
(1, 0) =−2
f
y
(1, 1) = 7
y
2
5y
4
− 2xy
dy
dx
−y
x − 3y
2
+ 1
dy
dx
Solutions to Problems
638
12 (a) −0.6; (b) −2; (c) −2.6.
13 78; 94; 6.2.
14 (a) f
x
=−3x
2
+ 2, f
y
= 1
=− =3x
2
− 2
(b) y = x
3
− 2x + 1, so
= 3x
2
− 2 ✓
15 1/3.
16 f
1
= ; f
2
=− + ; f
3
=+;
f
11
= 0; f
22
=−; f
33
=−;
1
x
2
3
2x
1
x
2
1
x
2
2
2x
1
x
2
3
x
3
2
1
x
3
2x
1
x
3
x
2
1
x
2
x
1
x
2
3
x
2
2
x
2
3
x
2
dy
dx
−3x
2
+ 2
1
dy
dx
f
12
=− =f
21
; f
13
=− =f
31
;
f
23
==f
32
.
Section 5.2
1 Substituting the given values of P, P
A
and Y into the
demand equation gives
Q = 500 − 3(20) − 2(30) + 0.01(5000)
= 430
(a) =−3, so
E
P
=− ×(−3) = 0.14
20
430
∂Q
∂P
−2x
1
x
3
x
2
2
2x
3
x
2
x
2
3
x
2
2
f
x
f
y
f
xx
f
yy
f
yx
f
xy
(a) yx 0011
(b) e
x
y e
x
e
x
y 0e
x
e
x
(c) 2x + 212000
(d) 4x
−3/4
y
3/4
12x
1/4
y
−1/4
−3x
−7/4
y
3/4
−3x
1/4
y
−5/4
3x
−3/4
y
−1/4
3x
−3/4
y
−1/4
(e) +− − −
1
y
2
−2
x
3
1
y
2
−2
x
3
2x
y
2
6y
x
4
x
y
2
1
x
2
1
y
−2y
x
3
11
MFE_Z02.qxd 16/12/2005 10:51 Page 638
(b) =−2, so
E
P
A
=×(−2) = 0.14
(c) = 0.01, so
E
Y
=×0.01 = 0.12
By definition,
E
Y
=
so demand rises by 0.12 × 5 = 0.6%. A rise in income
causes a rise in demand, so good is superior.
2 = 1000 + 5x
2
− 4x
1
= 450 + 5x
1
− 2x
2
, so at (138, 500)
= 2948 and = 140
If working time increases by 1 hour then leisure time
decreases by 1 hour, so ∆x
1
=−1. Also ∆x
2
= 15. By the
small increments formula
∆U 2948(−1) + 140(15) =−848
The law of diminishing marginal utility holds for both
x
1
and x
2
because
=−4 < 0
and
=−2 < 0
3 Using the numerical results in Practice Problem 2,
MRCS ==21.06
This represents the increase in x
2
required to maintain
the current level of utility when x
1
falls by 1 unit. Hence
if x
1
falls by 2 units, the increase in x
2
is approximately
21.06 × 2 = $42.12
4 MP
K
= 2K and MP
L
= 4L
(a) MRTS ===
(b) K + L = K(2K ) + L(4L)
= 2(K
2
+ 2L
2
) = 2Q ✓
5 (a) 20/1165; (b) −15/1165;
(c) 2000/1165; −0.04%; complementary.
∂Q
∂L
∂Q
∂K
2L
K
4L
2K
MP
L
MP
K
2948
140
∂
2
U
∂x
2
2
∂
2
U
∂x
1
2
∂U
∂x
2
∂U
∂x
1
∂U
∂x
2
∂U
∂x
1
percentage change in Q
percentage change in Y
5000
430
∂Q
∂Y
30
430
∂Q
∂P
A
6 2; 1%.
7 = and =
(a) 37/60; (b) 12/25.
8 MP
K
= 8, MP
L
= 14
1
/4; (a) 1
25
/32; (b) 1
25
/32.
9 K(6K
2
+ 3L
2
) + L(6LK ) = 6K
3
+ 9L
2
K = 3(K
3
+ 3L
2
K )
10 =αAK
α−1
L
β
and
=βAK
α
L
β−1
, so
K + L =αAK
α
L
β
+βAK
α
L
β
= (α+β)(AK
α
L
β
)
= (α+β)Q ✓
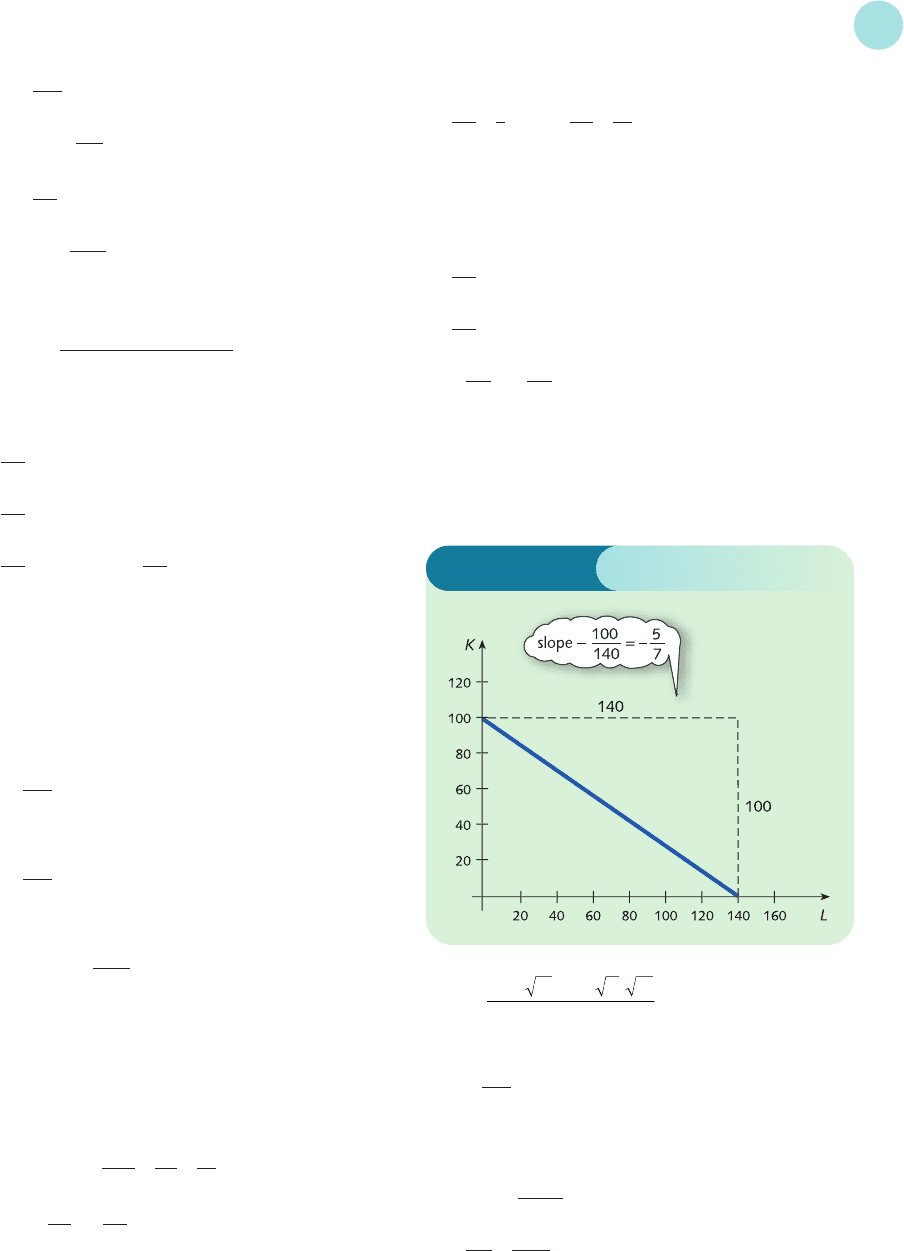
11 The graph is sketched in Figure S5.1, which shows that
MRTS =−(−5/7) = 5/7.
∂Q
∂L
∂Q
∂K
∂Q
∂L
∂Q
∂K
5
12
∂U
∂x
2
1
5
∂U
∂x
1
Solutions to Problems
639
12 (b)
(c) 2.97.
13 (c) ; (d) −0.033.
Section 5.3
1 C = a + b
=>0
because
0 < a <1
a
1 − a
∂C
∂I*
D
F
b + I*
1 − a
A
C
7K
4
3L
4
045 15.( . )KLK
L
+
Figure S5.1
MFE_Z02.qxd 16/12/2005 10:51 Page 639