Jackson M.J. Micro and Nanomanufacturing
Подождите немного. Документ загружается.

Diamond Nanogrinding 553
bond mixture described is one typically used in high-performance
vitrified corundum grinding wheels.
Table 10.3. Mineralogical analyses of raw materials
Compound (wt.
%>
Quartz
Orthoclase
Kaolinite
Mica
Soda feldspar
Miscellaneous ox-
ides/losses
China clay
4.05
0.00
79.70
13.94
0.8
1.51
Ball clay
12.77
15.23
62.71
0.00
1.69
7.60
Potash feld-
spar
4.93
64.96
2.17
0.00
27.07
0.87
Quartz
98.40
0.00
0.00
0.00
0.00
1.60
The raw materials were mixed in a mortar, pressed in a mold,
and fired at various temperatures. A heating rate of 2.9°C min"
1
was
employed until the vitrification temperature was reached.
Diffraction angle, 29 (deg)
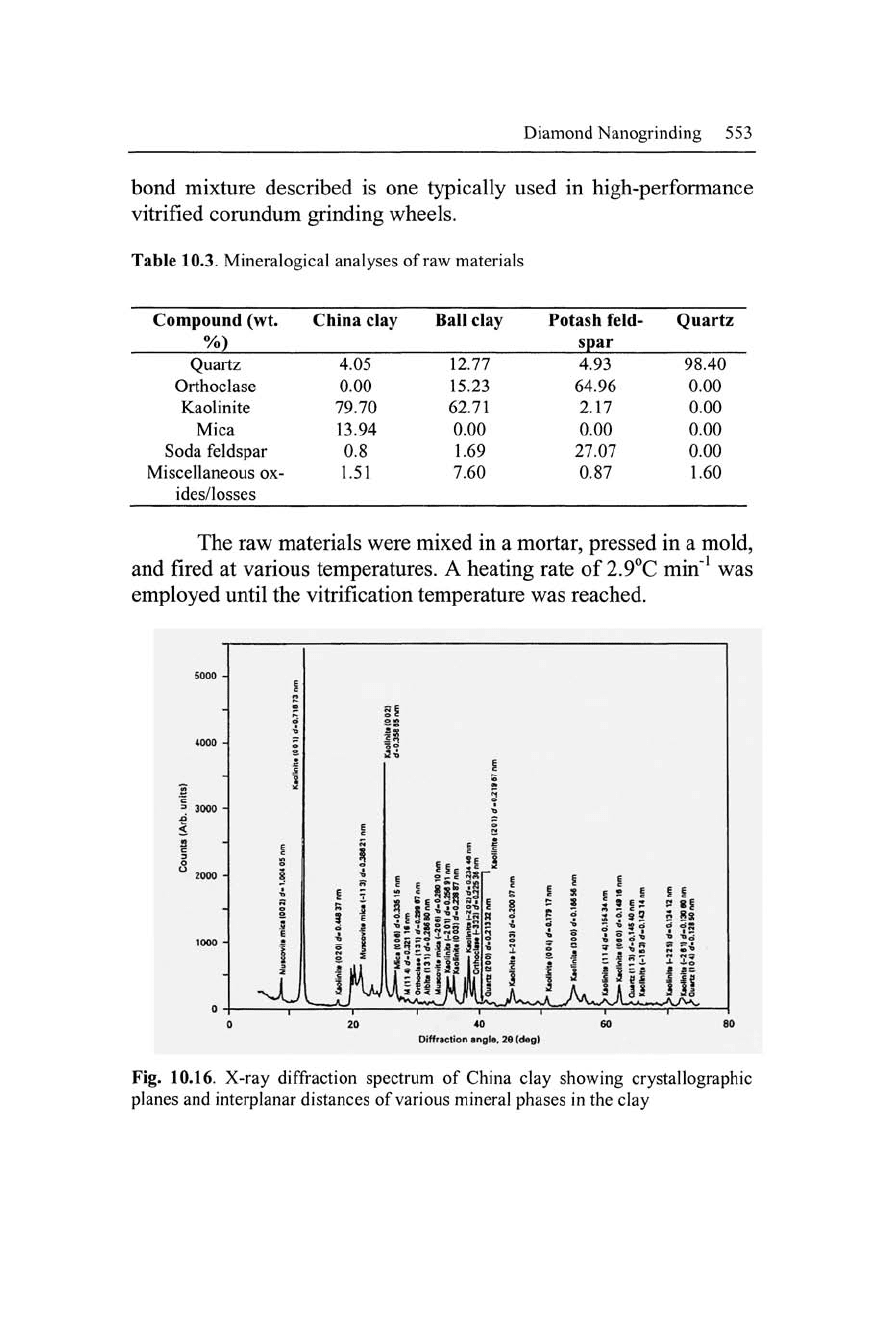
Fig. 10.16. X-ray diffraction spectrum of China clay showing crystallographic
planes and interplanar distances of various mineral phases in the clay
554 Micro-and Nanomanufacturing
0 20 40 60 80
Diffraction angle, 26 (deg)
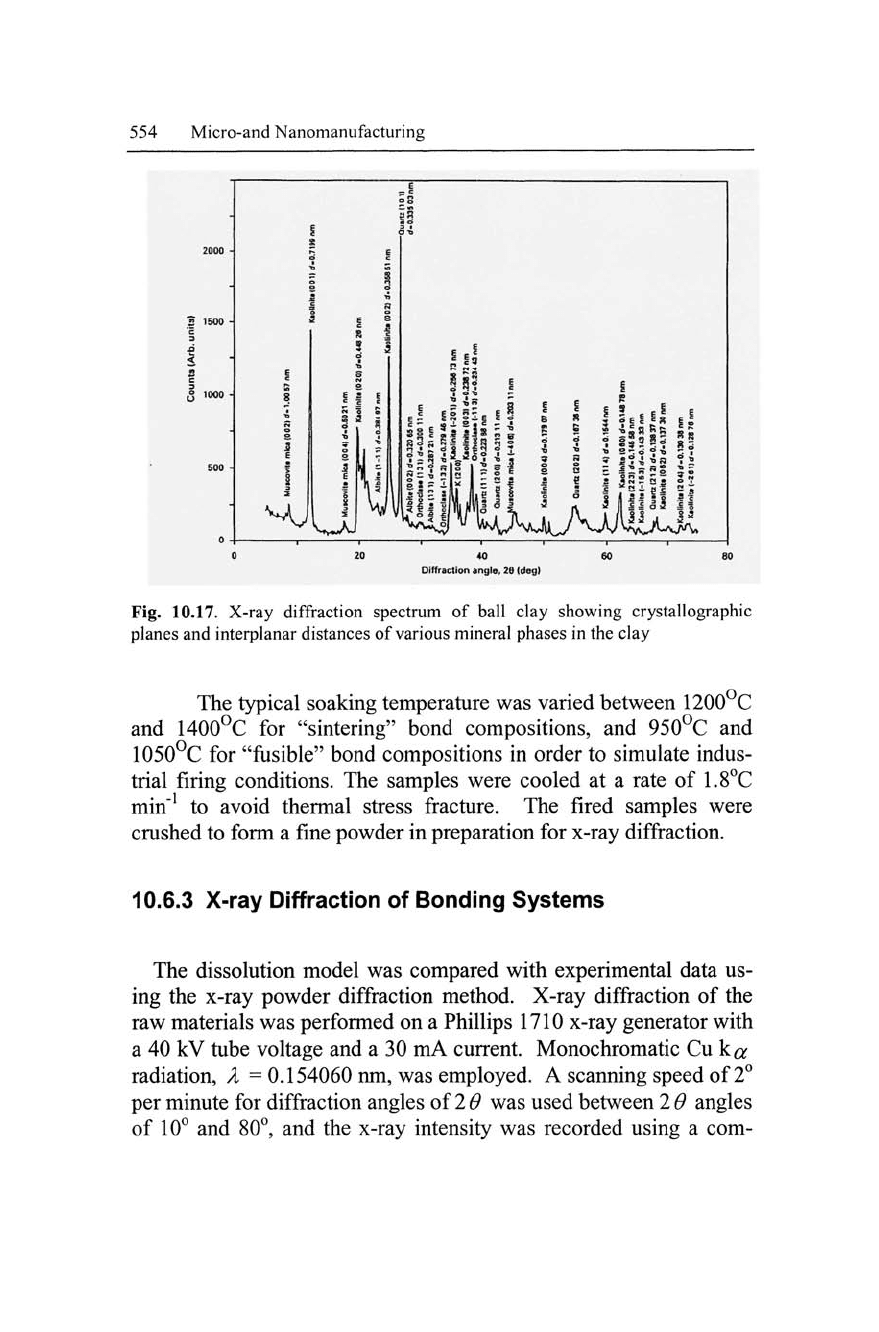
Fig. 10.17. X-ray diffraction spectrum of ball clay showing crystallographic
planes and interplanar distances of various mineral phases in the clay
The typical soaking temperature was varied between 1200 C
and 1400°C for "sintering" bond compositions, and 950°C and
1050°C for "fusible" bond compositions in order to simulate indus-
trial firing conditions. The samples were cooled at a rate of 1.8°C
min"
1
to avoid thermal stress fracture. The fired samples were
crushed to form a fine powder in preparation for x-ray diffraction.
10.6.3 X-ray Diffraction of Bonding Systems
The dissolution model was compared with experimental data us-
ing the x-ray powder diffraction method. X-ray diffraction of the
raw materials was performed on a Phillips 1710 x-ray generator with
a 40 kV tube voltage and a 30 mA current. Monochromatic Cuka
radiation, X = 0.154060 nm, was employed. A scanning speed of 2°
per minute for diffraction angles of
2
6 was used between 2 0 angles
of 10° and 80°, and the x-ray intensity was recorded using a com-
Diamond Nanogrinding 555
puter. The spectrum was then analyzed and compared with known
spectra.
Powder specimens were prepared by crushing in a mortar and
pestle in preparation for quantitative x-ray diffraction. To eliminate
the requirement of knowing mass absorption coefficients of ceramic
samples for quantitative x-ray diffraction, Alexander and Klug [12]
introduced the use of an internal standard. First, the ceramic sample
is crushed to form a powder - the sizes of particles should be small
enough to make extinction and micro-absorption effects negligible.
Second, the internal standard to be added should have a mass ab-
sorption coefficient at a radiation wavelength such that intensity
peaks from the phase(s) being measured are not diminished or am-
plified. It should be noted that the powder diffraction mixture should
be homogeneous on a scale of size smaller than the amount of mate-
rial exposed to the x-ray beam, and should be free from preferred
orientation. The powder bed that is subjected to "x-rays" should be
deep enough to give maximum diffracted intensity.
The expected equilibrium phases from the fired mixtures are
quartz (unreacted and partially dissolved), mullite, cristobalite and
glass.
However, from the samples tested, the compounds quartz,
mullite and glass were successfully detected. A calibration curve
was constructed using a suitable internal standard (calcium fluoride),
a diluent (glass made by melting potash feldspar), and a synthetic
form of the phase(s) to be measured. Synthetic mullite had a purity
greater than
99.8%,
whilst powdered quartz had a purity greater than
99.84%
SiC>2. The method used for quantitative analysis of ceramic
powders was developed by Khandelwal and Cook [13].
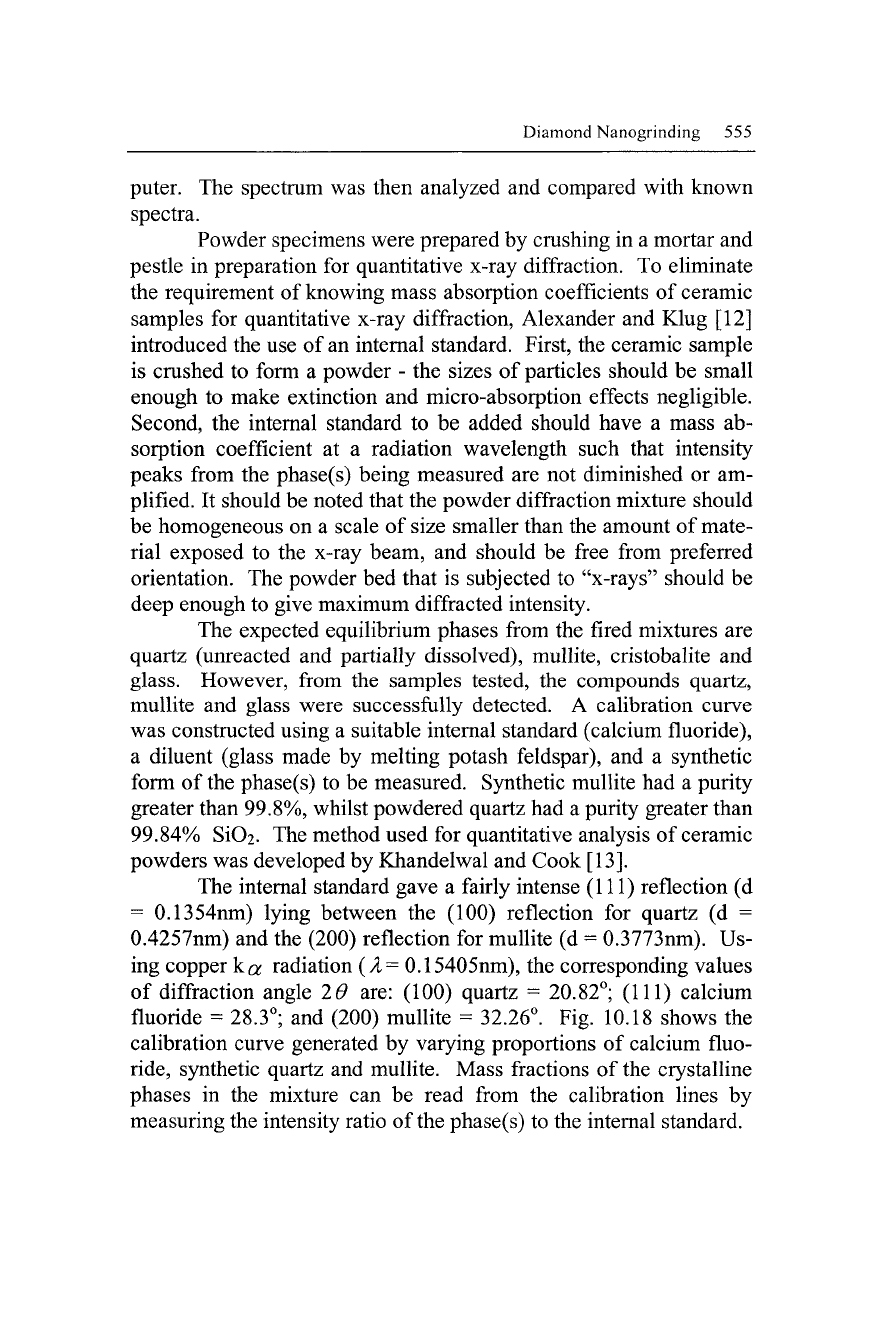
The internal standard gave a fairly intense (111) reflection (d
= 0.1354nm) lying between the (100) reflection for quartz (d =
0.4257nm) and the (200) reflection for mullite (d = 0.3773nm). Us-
ing copper ka radiation (A,= 0.15405nm), the corresponding values
of diffraction angle 20 are: (100) quartz = 20.82°; (111) calcium
fluoride = 28.3°; and (200) mullite = 32.26°. Fig. 10.18 shows the
calibration curve generated by varying proportions of calcium fluo-
ride,
synthetic quartz and mullite. Mass fractions of the crystalline
phases in the mixture can be read from the calibration lines by
measuring the intensity ratio of the phase(s) to the internal standard.
556 Micro-and Nanomanufacturing
0 20 40 60 80 100 120
Quartz or mullite %
Fig. 10.18. Calibration curve for quantitative analysis of x-ray determined quartz
and mullite using the CaF
2
(111) plane generated by the internal standard
Diamond Nanogrinding 557
0
-| , 1 1 , , 1 1
20
40 60 80
Diffraction
angle,
26 (deg)
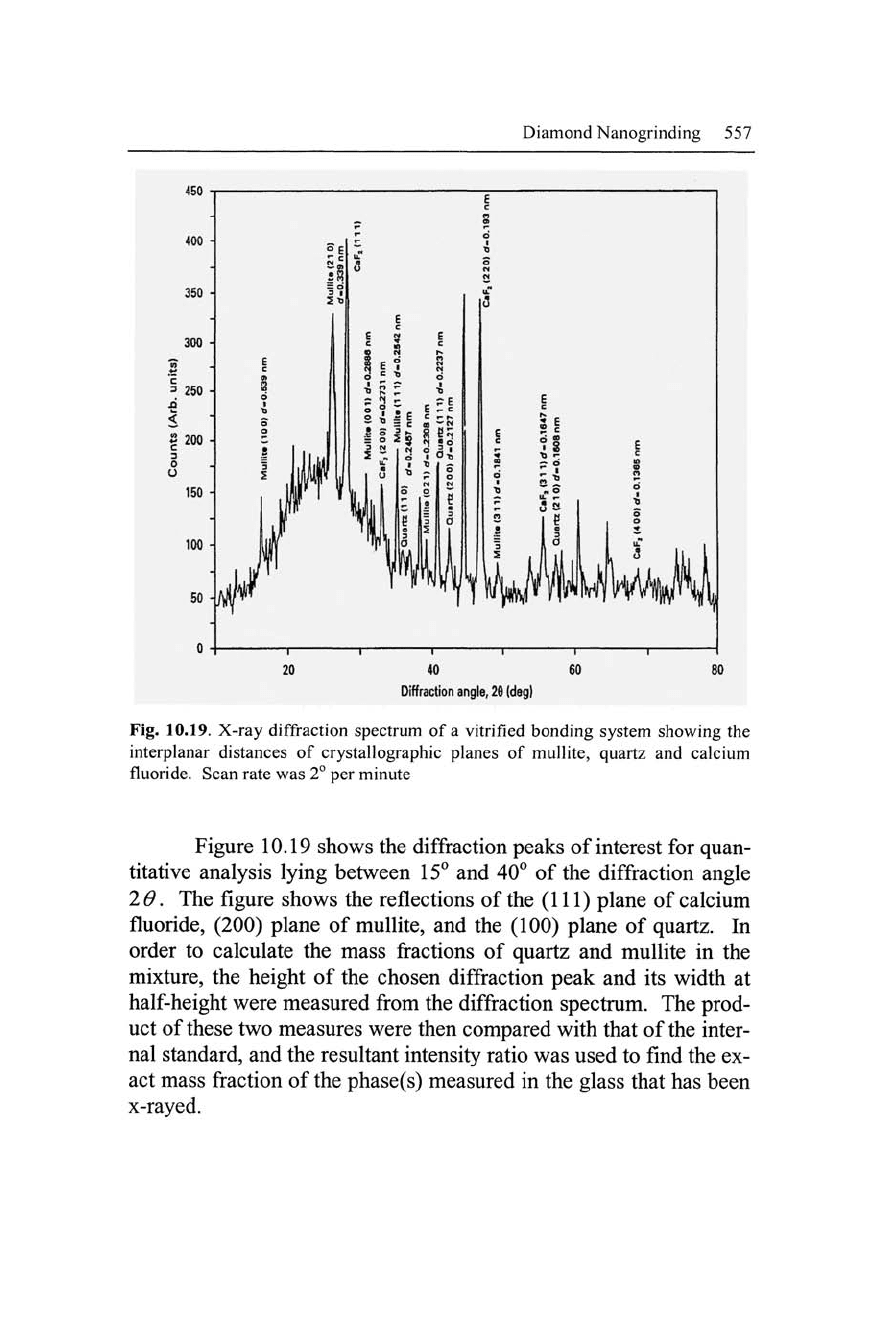
Fig. 10.19. X-ray diffraction spectrum of a vitrified bonding system showing the
interplanar distances of crystallographic planes of mullite, quartz and calcium
fluoride. Scan rate was 2° per minute
Figure 10.19 shows the diffraction peaks of interest for quan-
titative analysis lying between 15° and 40° of the diffraction angle
2 0. The figure shows the reflections of the (111) plane of calcium
fluoride, (200) plane of mullite, and the (100) plane of quartz. In
order to calculate the mass fractions of quartz and mullite in the
mixture, the height of the chosen diffraction peak and its width at
half-height were measured from the diffraction spectrum. The prod-
uct of these two measures were then compared with that of the inter-
nal standard, and the resultant intensity ratio was used to find the ex-
act mass fraction of the phase(s) measured in the glass that has been
x-rayed.
558 Micro-and Nanomanufacturing
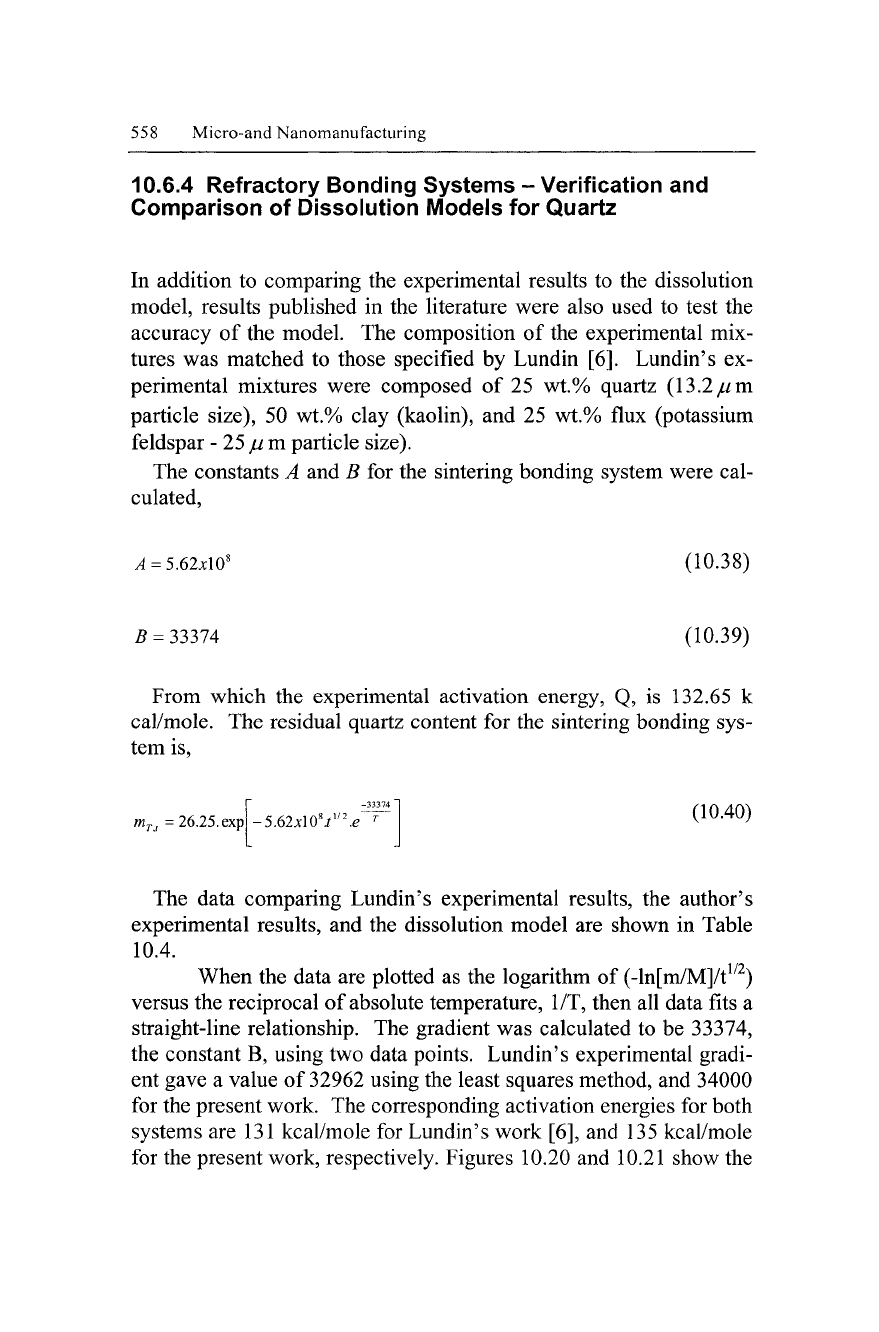
10.6.4 Refractory Bonding Systems - Verification and
Comparison of Dissolution Models for Quartz
In addition to comparing the experimental results to the dissolution
model, results published in the literature were also used to test the
accuracy of the model. The composition of the experimental mix-
tures was matched to those specified by Lundin [6]. Lundin's ex-
perimental mixtures were composed of 25 wt.% quartz (13.2//m
particle size), 50 wt.% clay (kaolin), and 25 wt.% flux (potassium
feldspar - 25
ju
m particle size).
The constants A and B for the sintering bonding system were cal-
culated,
A =
5.62xW (10.38)
£ = 33374 (10.39)
From which the experimental activation energy, Q, is 132.65 k
cal/mole. The residual quartz content for the sintering bonding sys-
tem is,
m
Tt
=
26.25.
exp
-5.62;dOY
/2
.e
T
(10.40)
The data comparing Lundin's experimental results, the author's
experimental results, and the dissolution model are shown in Table
10.4.
i
fry
When the data are plotted as the logarithm of (-ln[m/M]/t )
versus the reciprocal of absolute temperature, 1/T, then all data fits a
straight-line relationship. The gradient was calculated to be 33374,
the constant B, using two data points. Lundin's experimental gradi-
ent gave a value of 32962 using the least squares method, and 34000
for the present work. The corresponding activation energies for both
systems are 131 kcal/mole for Lundin's work [6], and 135 kcal/mole
for the present work, respectively. Figures 10.20 and 10.21 show the
Diamond Nanogrinding 559
effects of time on residual quartz content at different temperatures
according to Eq. 40 together with comparative experimental data.
A comparison was made with dissolution models published
in the literature. One of the earliest models was derived by Jander
[14].
The equation can be expressed:
Where Z is the volume of quartz that has been dissolved, r is
the original particle radius, and D is the diffusion coefficient for the
diffusing species. This equation can be transformed into mass frac-
tions using Archimedes' law, thus,
(10.42)
Where C is a constant dependent on soaking temperature and
initial particle size of quartz. Krause and Keetman [15] expressed
the dissolution of quartz as a function of isothermal firing time, viz,
M-m
=
C
3
.\nt
(10.43)
Where M is the initial quartz content, and m is the residual
quartz content after time, t. The unit of time here is seconds such
that after one second of firing the residual quartz content is equal to
the initial quartz content. Monshi's dissolution model [16] can be
transformed into the following equation assuming isothermal firing
conditions:
\M\
=
~
C6
^
(ia44)
560 Micro-and Nanomanufacturing
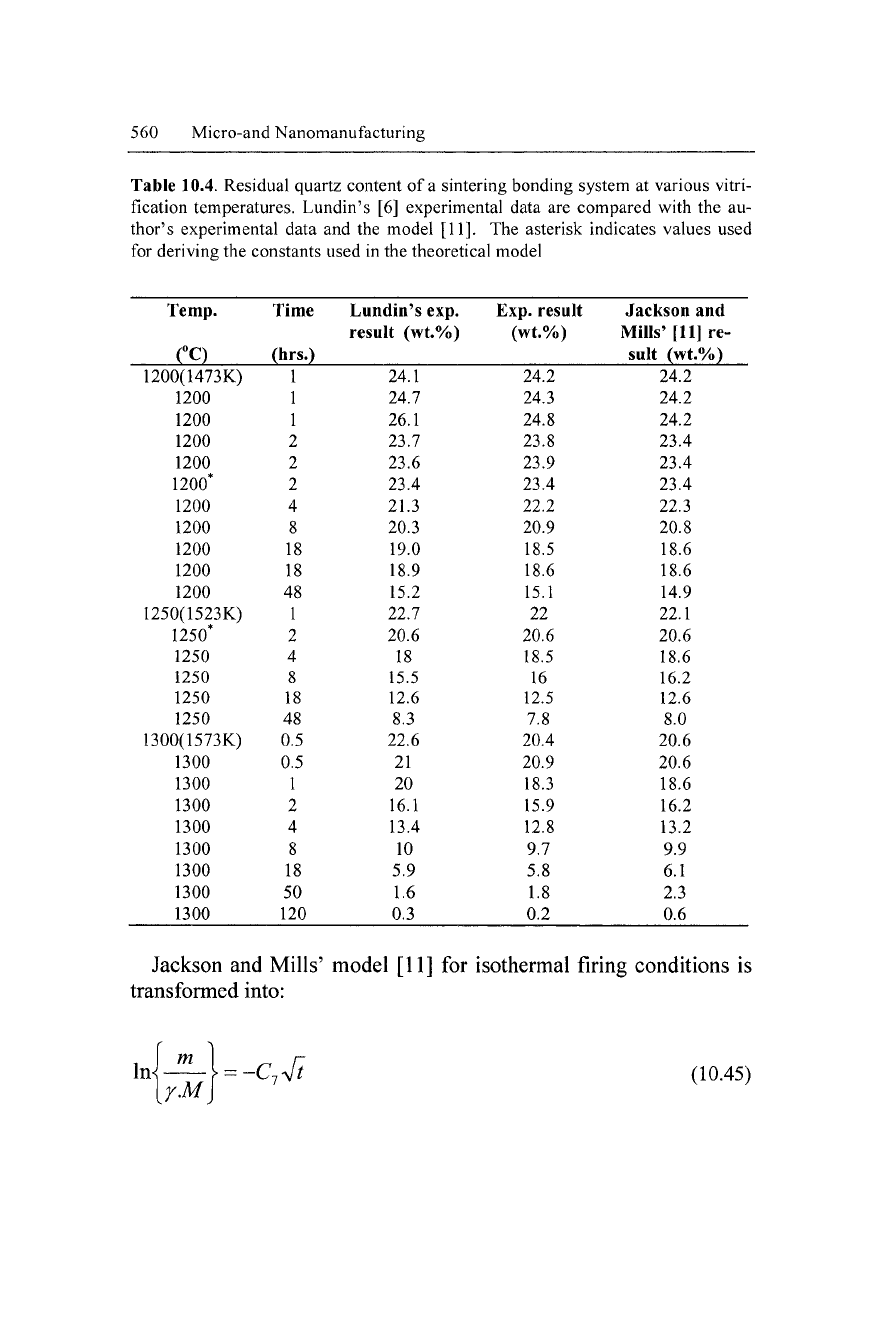
Table 10.4. Residual quartz content of a sintering bonding system at various vitri-
fication temperatures. Lundin's [6] experimental data are compared with the au-
thor's experimental data and the model [11]. The asterisk indicates values used
for deriving the constants used in the theoretical model
Temp.
(°C)
1200(1473K)
1200
1200
1200
1200
1200*
1200
1200
1200
1200
1200
1250(1523K)
1250*
1250
1250
1250
1250
1300(1573K)
1300
1300
1300
1300
1300
1300
1300
1300
Time
(hrs.)
1
1
1
2
2
2
4
8
18
18
48
1
2
4
8
18
48
0.5
0.5
1
2
4
8
18
50
120
Lundin's exp.
result (wt.%)
24.1
24.7
26.1
23.7
23.6
23.4
21.3
20.3
19.0
18.9
15.2
22.7
20.6
18
15.5
12.6
8.3
22.6
21
20
16.1
13.4
10
5.9
1.6
0.3
Exp.
result
(wt.%)
24.2
24.3
24.8
23.8
23.9
23.4
22.2
20.9
18.5
18.6
15.1
22
20.6
18.5
16
12.5
7.8
20.4
20.9
18.3
15.9
12.8
9.7
5.8
1.8
0.2
Jackson and
Mills'
[11] re-
sult (wt.%)
24.2
24.2
24.2
23.4
23.4
23.4
22.3
20.8
18.6
18.6
14.9
22.1
20.6
18.6
16.2
12.6
8.0
20.6
20.6
18.6
16.2
13.2
9.9
6.1
2.3
0.6
Jackson and Mills' model [11] for isothermal firing conditions is
transformed into:
•t^-^
Diamond Nanogrinding 561
Where y is the ratio of densities of (3- and a -quartz.
Constants for all the equations presented here are calculated using
quartz mass fraction data after 18 hours' firing. The constants are
dimensioned in seconds. The equations shown were compared with
experimental data generated by Lundin [6] for a clay-based material
containing 40 wt.% kaolin, 40 wt.% quartz, and 20 wt.% feldspar.
According to the transformed equations, the mass fraction of quartz
can be calculated as follows,
Jander's model [14]
m =
41.9.(l-{l.55xl0-
6
i})
3/2
(10.46)
Krause and Keetman's model [15]
m
= 41.9-(2.58.1n*) (10.47)
Monshi's model [16]
rn
= 4l.9.e-
45xl0
~
3
"
rt
(10.48)
Jackson and Mills' model [11]
m
=
4U3.e-
45xl0
~
2
"
rt
(10.49)
The transformed equations are then tested using data pro-
vided by Lundin [6]. Referring to Table 10.5, it can be shown that
the mass fraction of quartz obtained using the equations derived by
Jander [14] and Krause and Keetman [15] did not agree with
Lundin's experimental results [6].
562 Microand Nanomanufacturing
30 T
25
I-f
c
o
o
N 15
3
(0
3
10
20 40
Soaking time (h)
60
—i
80
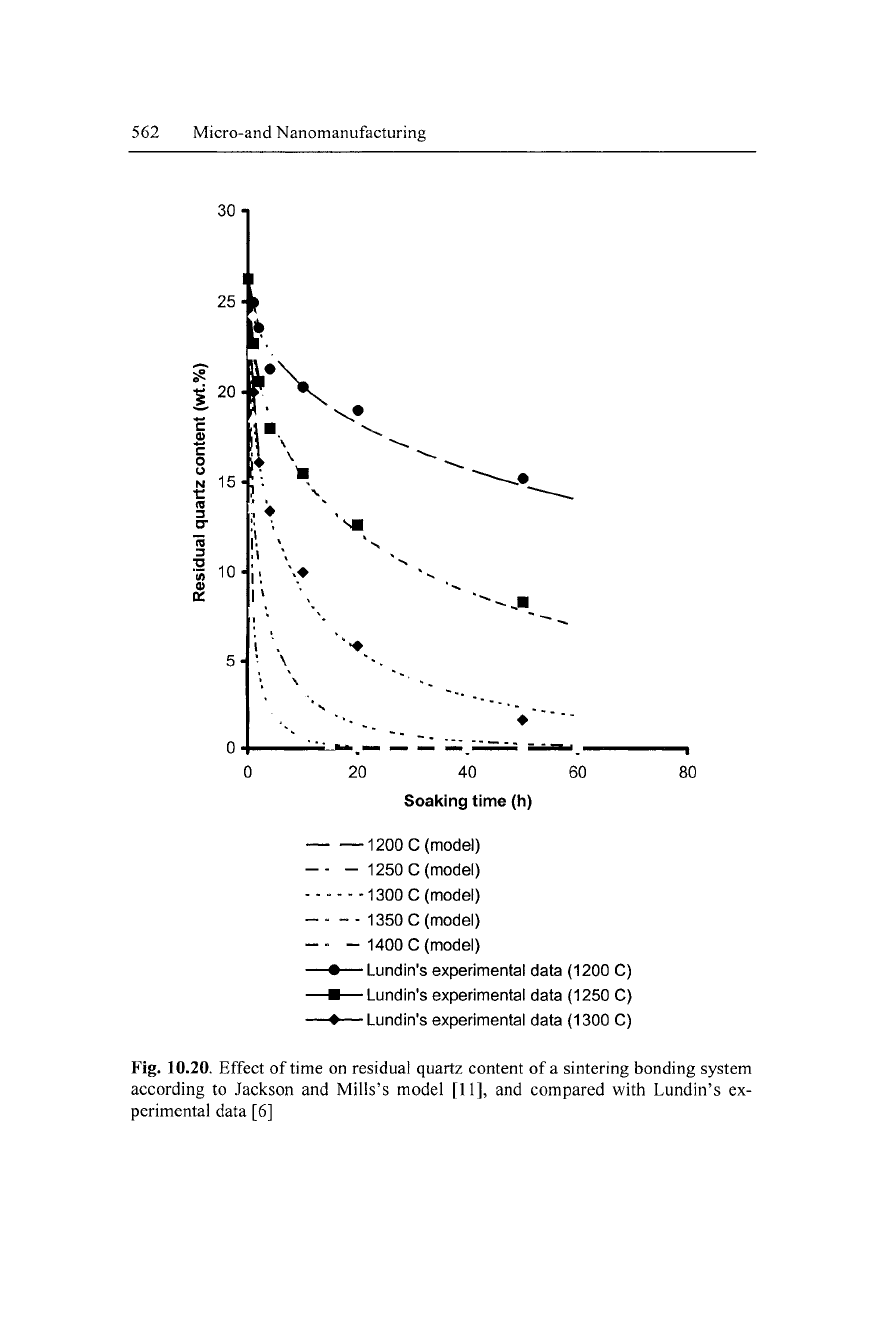
1200 C (model)
• - 1250 C (model)
--- -1300 C (model)
- -- 1350 C (model)
- - 1400 C (model)
• Lundin's experimental data (1200 C)
-•—Lundin's experimental data (1250 C)
• Lundin's experimental data (1300 C)
Fig. 10.20. Effect of time on residual quartz content of a sintering bonding system
according to Jackson and Mills's model [11], and compared with Lundin's ex-
perimental data [6]